Class 10 Exam  >  Class 10 Notes  >  NCERT Textbooks & Solutions for Class 10  >  NCERT Solutions: Statistics (Exercise 13.3)

NCERT Solutions for Class 10 Maths Chapter 13 - Statistics (Exercise 13.3)

Q1: The following frequency distribution gives the monthly consumption of electricity of 68 consumers of a locality. Find the median, mean and mode of the data and compare them.
NCERT Solutions for Class 10 Maths Chapter 13 - Statistics (Exercise 13.3)
Sol: 
Median 
Let us prepare a cumulative frequency table:
NCERT Solutions for Class 10 Maths Chapter 13 - Statistics (Exercise 13.3)

Now, we have  NCERT Solutions for Class 10 Maths Chapter 13 - Statistics (Exercise 13.3)
∵ This observation lies in the class 125−145.
∴ 125−145 is the median class.
∴ l = 125, cf = 22
f = 20 and h = 20
Using the formula,
NCERT Solutions for Class 10 Maths Chapter 13 - Statistics (Exercise 13.3)
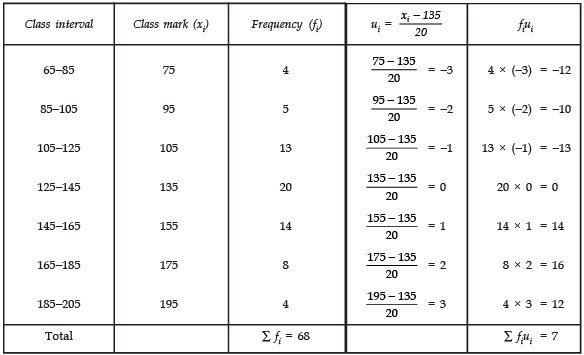
Mean Assumed mean (a) = 135
∵ Class interval (h) = 20
NCERT Solutions for Class 10 Maths Chapter 13 - Statistics (Exercise 13.3)
Now, we have the following table:
NCERT Solutions for Class 10 Maths Chapter 13 - Statistics (Exercise 13.3)

NCERT Solutions for Class 10 Maths Chapter 13 - Statistics (Exercise 13.3)
Mode 
∵ Class 125−145 has the highest frequency.
∴ This is the modal class.
We have:
h = 20
l = 125
f1 = 20
f0 = 13
f2 = 14
NCERT Solutions for Class 10 Maths Chapter 13 - Statistics (Exercise 13.3)
We observe that the three measures are approximately equal in this case.

Q2: If the median of the distribution given below is 28.5, find the values of x and y.
NCERT Solutions for Class 10 Maths Chapter 13 - Statistics (Exercise 13.3)
Sol: Here, we have n = 60 [∵ ∑fi = 60]
Now, cumulative frequency table is:
NCERT Solutions for Class 10 Maths Chapter 13 - Statistics (Exercise 13.3)
Since, median = 28.5
∴ Median class is 20 − 30
We have: l = 20
h = 10
f = 20
cf = 5 + x
NCERT Solutions for Class 10 Maths Chapter 13 - Statistics (Exercise 13.3)
⇒ 57 = 40 + 25 − x
⇒ x = 40 + 25 − 57 = 8
Also 45 + x + y = 60
⇒ 45 + 8 + y = 60
⇒ y = 60 − 45 − 8 = 7
Thus, x = 8
y = 7

Q3: A life insurance agent found the following data for distribution of ages of 100 policy holders. Calculate the median age, if policies are given only to persons having age 18 years on wards but less than 60 years.
NCERT Solutions for Class 10 Maths Chapter 13 - Statistics (Exercise 13.3)
Sol: The given table is cumulative frequency distribution. We write the frequency distribution as given below:
NCERT Solutions for Class 10 Maths Chapter 13 - Statistics (Exercise 13.3)

NCERT Solutions for Class 10 Maths Chapter 13 - Statistics (Exercise 13.3)
∵ The cumulative frequency just greater than n/2 i.e., just greater than 50 is 78.
∴ The median class is 78.
Now n/2 = 50, l = 35, cf = 45, f = 33 and h = 5
NCERT Solutions for Class 10 Maths Chapter 13 - Statistics (Exercise 13.3)

NCERT Solutions for Class 10 Maths Chapter 13 - Statistics (Exercise 13.3)
Thus, the median age = 35.76 years.

Q4: The lengths of 40 leaves of a plant are measured correct to the nearest millimetre, and the data obtained is represented in the following table:
NCERT Solutions for Class 10 Maths Chapter 13 - Statistics (Exercise 13.3)
Find the median length of the leaves.
[Hint: The data needs to be converted to continuous classes for finding the median, since the formula assumes continuous classes. The classes then change to 117.5−126.5, 126.5−135.5, ..., 171.5−180.5]

Sol: After changing the given table as continuous classes we prepare the cumulative frequency table:
NCERT Solutions for Class 10 Maths Chapter 13 - Statistics (Exercise 13.3)
∑ fi =40 ⇒ n = 40
Now,
NCERT Solutions for Class 10 Maths Chapter 13 - Statistics (Exercise 13.3)
The cumulative frequency just above n/2 i.e., 20 is 29 and it corresponds to the class 144.5−153.5.
So, 144.5−153.5 is the median class.
We have:
n/2 = 20, l = 144.5, f = 12, cf = 17 and h = 9
NCERT Solutions for Class 10 Maths Chapter 13 - Statistics (Exercise 13.3)

Q5: The following table gives the distribution of the life time of 400 neon lamps:
NCERT Solutions for Class 10 Maths Chapter 13 - Statistics (Exercise 13.3)
Find the median life time of a lamp

Sol: To compute the median, let us write the cumulative frequency distribution as given below:
NCERT Solutions for Class 10 Maths Chapter 13 - Statistics (Exercise 13.3)
∑ fi = 400 ⇒ n = 400
NCERT Solutions for Class 10 Maths Chapter 13 - Statistics (Exercise 13.3)
Since, the cumulative frequency just greater than n/2 i.e., greater than 200 is 216.
∴ The median class is 3000−3500
∴ l = 3000, cf = 130, f = 86, h = 500 and n/2 = 200
NCERT Solutions for Class 10 Maths Chapter 13 - Statistics (Exercise 13.3)

NCERT Solutions for Class 10 Maths Chapter 13 - Statistics (Exercise 13.3)
Thus, median life = 3406.98 hours.

Q6: 100 surnames were randomly picked up from a local telephone directory and the frequency distribution of the number of letters in the English alphabets in the surnames was obtained as follows:
NCERT Solutions for Class 10 Maths Chapter 13 - Statistics (Exercise 13.3)
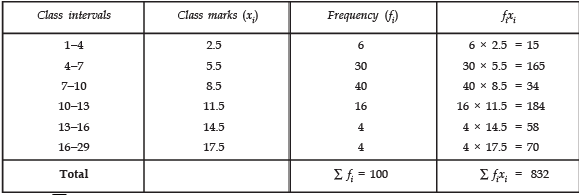
Determine the median number of letters in the surnames. Find the mean number of letters in the surnames? Also, find the modal size of the surnames.
Sol: Median
NCERT Solutions for Class 10 Maths Chapter 13 - Statistics (Exercise 13.3)

NCERT Solutions for Class 10 Maths Chapter 13 - Statistics (Exercise 13.3)
Since, the cumulative frequency just greater than n/2 i.e., greater than 50 is 76.
∴ The class 7 − 10 is the median class,
We have  NCERT Solutions for Class 10 Maths Chapter 13 - Statistics (Exercise 13.3)
l = 7
cf = 36
f = 40 and  h = 3
NCERT Solutions for Class 10 Maths Chapter 13 - Statistics (Exercise 13.3)

NCERT Solutions for Class 10 Maths Chapter 13 - Statistics (Exercise 13.3)
Mode
Since the class 7−10 has the maximum frequency.
∴ The modal class is 7−10
So, we have
l = 7, h = 3
f1 = 40,
f0 = 30
f2 = 16
NCERT Solutions for Class 10 Maths Chapter 13 - Statistics (Exercise 13.3)

NCERT Solutions for Class 10 Maths Chapter 13 - Statistics (Exercise 13.3)
Thus, the required Median = 8.05,
Mean = 8.32 and Mode = 7.88.

Q7: The distribution below gives the weights of 30 students of a class. Find the median weight of the students.
NCERT Solutions for Class 10 Maths Chapter 13 - Statistics (Exercise 13.3)

Sol: We have

Weight (in kg)

Frequency

(f)

Cumulative

frequency

40-45

2

2 + 0= 2

45-50

3

2 + 3= 5

50-55

8

5 + 8 = 13

55-60

6

13 + 6 = 19

60-65

6

19 + 6 = 25

65-70

3

25 + 3 = 28

70-75

2

28 + 2 = 30

Total

If  = 30

n = 30

NCERT Solutions for Class 10 Maths Chapter 13 - Statistics (Exercise 13.3)
The cumulative frequency just more than n/2 i.e., more than 15 is 19, which corresponds to the class 55−60.
n/2 = 15.
l = 5
5f = 6
cf = 13 and h = 5
NCERT Solutions for Class 10 Maths Chapter 13 - Statistics (Exercise 13.3)
Thus, the required median weight = 56.67 kg.

The document NCERT Solutions for Class 10 Maths Chapter 13 - Statistics (Exercise 13.3) is a part of the Class 10 Course NCERT Textbooks & Solutions for Class 10.
All you need of Class 10 at this link: Class 10
348 docs

Top Courses for Class 10

FAQs on NCERT Solutions for Class 10 Maths Chapter 13 - Statistics (Exercise 13.3)

1. What is the importance of statistics in our daily lives?
Ans. Statistics plays a crucial role in our daily lives by providing us with tools and techniques to analyze data and make informed decisions. It helps us in understanding trends, making predictions, and evaluating the reliability of information. For example, statistics can be used to analyze health data to identify patterns and risk factors for diseases, or to analyze financial data for making investment decisions.
2. How is statistics used in business and economics?
Ans. Statistics is extensively used in business and economics for various purposes. It helps in market research and forecasting, allowing businesses to identify consumer preferences, target specific demographics, and develop effective marketing strategies. In economics, statistics is used to analyze economic data, measure economic indicators such as GDP or inflation, and make predictions about the future performance of the economy.
3. What are the different types of statistical measures?
Ans. There are several types of statistical measures used to summarize and analyze data. Some common measures include: - Measures of central tendency: These include mean, median, and mode, which provide information about the central or typical value of a dataset. - Measures of dispersion: These include range, variance, and standard deviation, which indicate the spread or variability of the data. - Measures of association: These include correlation and regression analysis, which examine the relationship between two or more variables. - Measures of probability: These include probability distributions and probability density functions, which quantify the likelihood of different outcomes.
4. How does statistics help in scientific research?
Ans. Statistics plays a vital role in scientific research as it helps in analyzing and interpreting data. It allows researchers to draw meaningful conclusions, identify patterns or trends, and make generalizations about a population based on a sample. Statistical methods help in designing experiments, determining sample sizes, and testing hypotheses. It also helps in evaluating the significance of research findings and assessing the reliability of the results.
5. Can statistics be used to make predictions about the future?
Ans. Yes, statistics can be used to make predictions about the future, although it comes with some limitations. Predictive models are developed by analyzing historical data and identifying patterns or relationships. These models can then be used to forecast future outcomes or trends. However, it is important to note that predictions are not always accurate and can be influenced by various factors. The reliability of predictions depends on the quality and quantity of data, the assumptions made, and the complexity of the phenomenon being studied.
348 docs
Download as PDF
Explore Courses for Class 10 exam

Top Courses for Class 10

Signup for Free!
Signup to see your scores go up within 7 days! Learn & Practice with 1000+ FREE Notes, Videos & Tests.
10M+ students study on EduRev
Related Searches

Free

,

Extra Questions

,

Viva Questions

,

Exam

,

video lectures

,

Summary

,

shortcuts and tricks

,

past year papers

,

NCERT Solutions for Class 10 Maths Chapter 13 - Statistics (Exercise 13.3)

,

Sample Paper

,

pdf

,

NCERT Solutions for Class 10 Maths Chapter 13 - Statistics (Exercise 13.3)

,

practice quizzes

,

Semester Notes

,

Previous Year Questions with Solutions

,

ppt

,

study material

,

Important questions

,

mock tests for examination

,

NCERT Solutions for Class 10 Maths Chapter 13 - Statistics (Exercise 13.3)

,

Objective type Questions

,

MCQs

;