Poverty & Deprivation - 2 | Sociology Optional for UPSC (Notes) PDF Download
| Table of contents |

|
| NITI Aayog’s Taskforce on Elimination of Poverty in India |

|
| New Approaches |

|
| Human Development Index |

|
| What is “Feminization of Poverty”? |

|
NITI Aayog’s Taskforce on Elimination of Poverty in India
Employment-Intensive Sustained Rapid Growth
- An integral part of a well-rounded and holistic anti-poverty strategy must be sustained rapid growth. Conceptually, sustained rapid growth works through two channels to rapidly reduce poverty. First, it creates well-paid jobs and raises real wages. Both factors raise incomes of poor households thereby directly denting poverty. Increased incomes help in another way: households are able to purchase and access education and health services. Second, rapid growth leads to growth in government revenues. In turn, enhanced revenues allow the expansion of social expenditures at faster pace.
Centrality of Agricultural Growth
- Any strategy for poverty reduction must tackle the issues facing rural India, which accounts for 68.8 per cent of the population. about 80% of India’s poor live in rural areas, and livelihood of most of them is dependent directly or indirectly on the performance of agriculture. Agriculture and allied activities employed 49% of the total workforce in India. But the share of agriculture in the GDP at 2004-05 prices that year was only 14.4 per cent. One of the reasons for this skewed distribution of labour force in agriculture is the paucity of alternative livelihood opportunities either at village level or in the nearby townships and cities.
- To break this cycle of poverty in rural areas, a two-pronged strategy is required: we must improve the performance of agriculture and create jobs in industry and services in both rural and urban areas.
Making Growth in Manufacturing and Services Employment Intensive
- While faster agricultural growth that raises rural wages and incomes is an effective means to brining relief to the rural poor, we must bear in mind that bringing shared prosperity in the longer run requires healthy growth of employment- intensive manufacturing and services. In India, the fastest agriculture has grown over a continuous ten-year period in the recorded history is 4.7 % during the 1980s. In order that those employed in agriculture today may share in the prosperity of tomorrow, it is important that industry and services create jobs for them. This is how South Korea and Taiwan eliminated poverty during 1965-90 and China more recently.
- However, successful sectors in India are not Employment Intensive- Fast growing manufacturing sectors such as auto, auto parts, two wheelers, engineering goods, chemicals and petroleum refining use very little low-skilled labor per unit of investment. Other fast growing sectors such as software, pharma, telecom and financial services use mostly skilled labor.
- Sectors such as clothing, textiles, footwear, food processing and electronic goods, which employ lots of low and semi-skilled workers in which China has excelled have not done well in India. These employment intensive sectors are lagging in India because:
- These employment intensive sectors lack critical mass of large firms.
This has impaired India’s ability to capture the vast export markets.
In so far as large firms operate in the world markets, they catalyse technological change and high product quality.
Their absence has meant low productivity of small and medium firms as well in these sectors.
What Must be Done?
1. Effective implementation of Make in India i.e. Infrastructure (esp. power, roads and ports), Ease of Doing Business (including trade facilitation), Credit access for MSMEs, More flexible labor laws, Reform of the Land Acquisition Law, A Modern Bankruptcy Law, Skill Development & Tax certainty
2. Making anti-poverty programs more effective
Nutrition: National Food Security Act, 2013
- Plugging Leakages- Aadhaar based verification of transactions, choice between subsidized Cereals and cash transfer
- Better balance in diet- Intensive information campaign, shift to cash transfers
- Need for reorientation of the subsidy- As per the SECC (Rural), 40% of the rural households satisfy one or more exclusion criteria. This greatly weakens the case for subsidy to more than 60% of the rural households under NFSA.
Nutrition: Midday Meal Scheme
- Poor convergence of MDMS with the school health program.
- State specific guidelines are required for improved quality and safety of food
- 25% of schools lack kitchen sheds and prepare food in open. This is a major cause for concern as it impacts the safety of food students eat.
Mahatma Gandhi National Rural Employment Guarantee Act (MGNREGA)
- Skill Development
- Durable assets
- Enforce the 60:40 wage: materials ratio to be maintained at the district level and allow contactors in the materials part of the expenditures
- Shortage of farm labour in peak season- Allow farmers to hire MGNREGA workers if they are willing to pay bulk of wages
- Consider MGNREGA holiday during peak season
Housing for All (Rural)
- The scheme has progressed well overall but can be improved.
- Faces major challenge in selection of beneficiaries; SECC may be deployed to identify them.
- Gaps in reporting by the States on completion of houses against the physical targets and the updated progress is not reflected in the reporting system.
- States have to come forward with larger resources to meet the objectives of ‘Housing for All by 2022’ in the rural areas.
- Explore the scope for prefabricated houses
Housing for All (Urban)
- Challenges of finding land for urban housing. Urban Land Ceilings and Regulation Act, low FSI and difficulties in the conversion of land from one use to anther pose challenges
- Integration between land and transport planning is needed so that affordable housing is linked with public transport.
- Low-rent housing requires serious thinking since migrants can rarely afford to buy houses and, absent proper rental housing, seek recourse to slums.
New Approaches
Targeting Five Poorest Families in Each Village
- SECC based BPL list may be used for selection
- Gram Panchayat to ensure all Government program benefits reach them
- A modest cash transfer for a pre-specified time may top these benefits
- Aim - to ensure the target families become capable of earning & sustaining above- poverty level of income within 5-7 years
- Similar efforts in urban areas – 100 families in a municipality
Towards Cash Transfers: Jan Dhan Yojana, Aadhaar, Mobile (JAM) trinity
JAM could play a vital role in widening the reach of government to vulnerable sections as:
- Jan Dhan Yojana promise to eventually revolutionize the anti- poverty programmes by replacing the current cumbersome and leaky distribution of benefits under various schemes by the direct benefit transfers (DBT).
- Aadhar linked accounts permit aggregation of the information, the government would have an excellent database to assess the total volume of benefits accruing to each household.
- It could pave the way for replacing countless schemes with consolidated cash transfers except in cases in which there are other compelling reasons to continue with in-kind transfers.
Human Development Index
- The HDI is a summary measure for assessing progress in three basic dimensions of human development: a long and healthy life, access to knowledge and a decent standard of living. A long and healthy life is measured by life expectancy at birth. Knowledge level is measured by mean years of education among the adult population, which is the average number of years of education received in a life-time by people aged 25 years and older; and access to learning and knowledge by expected years of schooling for children of school-entry age, which is the total number of years of schooling a child of school-entry age can expect to receive if prevailing patterns of age-specific enrolment rates stay the same throughout the child's life. The standard of living is measured by Gross National Income (GNI) per capita expressed in 2011 international dollars converted using purchasing power parity (PPP) conversion rates.
- To ensure as much cross-country comparability as possible, the HDI is based primarily on international data from the UN Population Division, UNESCO andWorld Bank.
- The HDI was created to emphasize that people and their capabilities should be the ultimate criteria for assessing the development of a country, not economic growth alone. Economic growth is a mean to that process, but is not an end by itself. The HDI can also be used to question national policy choices, asking how two countries with the same level of GNI per capita can end up with different human development outcomes. These contrasts can stimulate debate about government policy priorities.
- HDI was developed by Pakistani economist Mahbub ul Haq for the UNDP. The index is based on the human development approach, developed by Ul Haq, often framed in terms of whether people are able to "be" and "do" desirable things in life. Examples include—Beings: well fed, sheltered, healthy; Doings: work, education, voting, participating in community life. It must also be noted that the freedom of choice is central—someone choosing to be hungry (e.g. during a religious fast) is quite different to someone who is hungry because they cannot afford to buy food.
- The explicit purpose of HDI is "to shift the focus of development economics from national income accounting to people-centered policies". Haq believed that a simple composite measure of human development was needed to convince the public, academics, and politicians that they can and should evaluate development not only by economic advances but also improvements in human well-being.
- 2016 Human Development Report draws from and builds on the 2030 Agenda for Sustainable Development that the 193 member states of the United Nations endorsed in 2015—and the 17 Sustainable Development Goals (SDGs) the world has committed to achieve.
Criticism
- The Human Development Index has been criticized on a number of grounds, including alleged lack of consideration of technological development or contributions to the human civilization, focusing exclusively on national performance and ranking, lack of attention to development from a global perspective, measurement error of the underlying statistics, and on the UNDP's changes in formula which can lead to severe misclassification in the categorisation of 'low', 'medium', 'high' or 'very high' human development countries. The HDI is also criticized as it simplifies and captures only part of what human development entails. It does not reflect on inequalities, poverty, human security, empowerment, etc.
India’s HDI: India’s HDI value for 2015 is 0.624— which put the country in the medium human development category—positioning it at 131 out of 188 countries and territories.
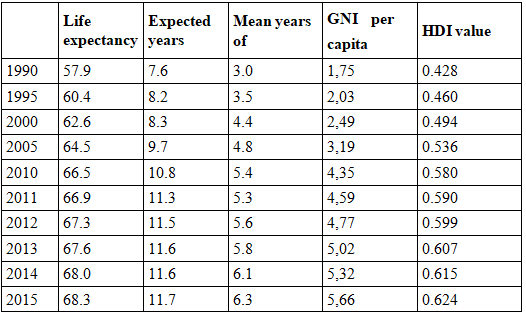
Between 1990 and 2015, India’s HDI value increased from 0.428 to 0.624, an increase of 45.7 %. Table A reviews India’s progress in each of the HDI indicators. Between 1990 and 2015, India’s life expectancy at birth increased by 10.4 years, mean years of schooling increased by
3.3 years and expected years of schooling increased by 4.1 years. India’s GNI per capita increased by about 223.4 % between 1990 and 2015.
Table : India’sHDI trends based on consistent time series data
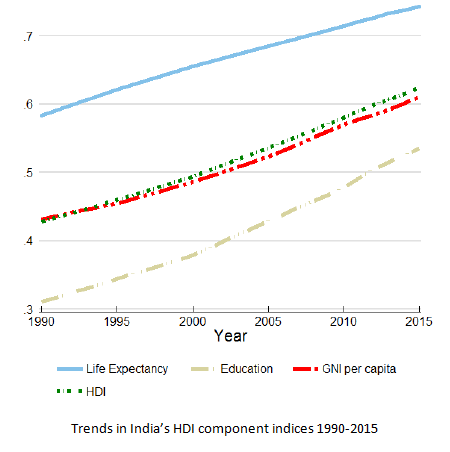
shows contribution of each component index to India’s HDI since 1990
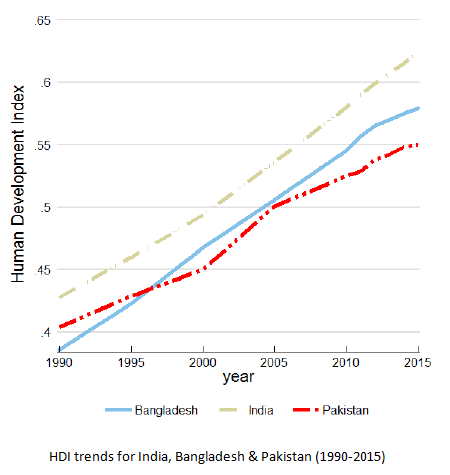
Progress relative to other countries
- The human development progress, as measured by the HDI, can usefully be compared to other countries. During the period between 1990 and 2015 India, Bangladesh and Pakistan experienced different degrees of progress toward increasing their HDIs.
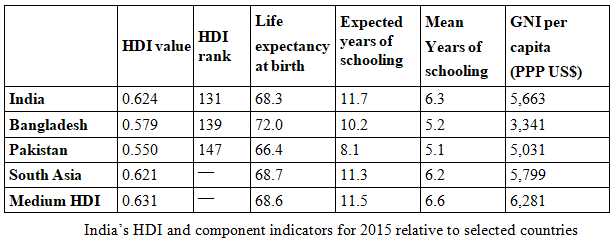
- India’s 2015 HDI of 0.624 is below the average of 0.631 for countries in the medium human development group and above the average of 0.621 for countries in South Asia. From South Asia, countries which are close to India in 2015 HDI rank and to some extent in population size are Bangladesh and Pakistan, which have HDIs ranked 139 and 147 respectively.
- Inequality-adjusted HDI (IHDI) HDI is an average measure of basic human development achievements in a country. Like all averages, the HDI masks inequality in the distribution of human development across the population at the country level. T he 2010 HDR introduced the IHDI, which takes into account inequality in all three dimensions of the HDI by ‘discounting’ each dimension’s average value according to its level of inequality.
- The IHDI is basically the HDI discounted for inequalities. The ‘loss’ in human development due to inequality is given by the difference between the HDI and the IHDI, and can be expressed as a %age. As the inequality in a country increases, the loss in human development also increases. W e also present the coefficient of human inequality as a direct measure of inequality which is an unweighted average of inequalities in three dimensions.
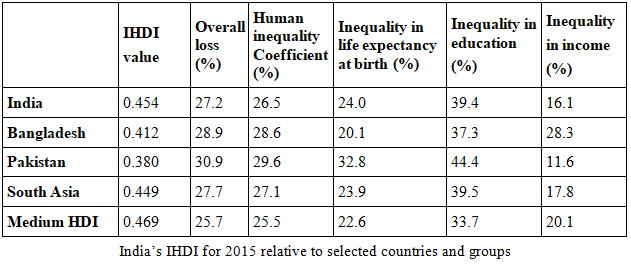
- India’s HDI for 2015 is 0.624. However, when the value is discounted for inequality, the HDI falls to 0.454, a loss of 27.2 % due to inequality in the distribution of the HDI dimension indices. Bangladesh and Pakistan show losses due to inequality of 28.9 % and 30.9 % respectively. The average loss due to inequality for medium HDI countries is 25.7 % and for South Asia it is 27.7 %. The Human inequality coefficient for India is equal to 26.5 %.
 Gender Development Index (GDI)
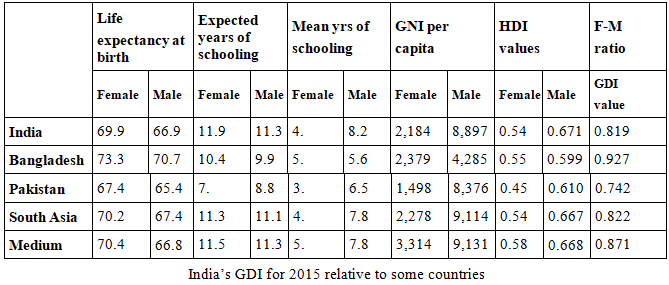
GDI is defined as a ratio of the female to the male HDI. The GDI reflects gender inequalities in achievement in the same three dimensions of the HDI: health (measured by female and male life expectancy at birth), education (measured by female and male expected years of schooling for children and mean years for adults aged 25 years and older); and command over economic resources (measured by female and male estimated GNI per capita). - The female HDI value for India is 0.549 in contrast with 0.671 for males, resulting in a GDI value of 0.819, which places the country into Group 5. In comparison, GDI values for Bangladesh and Pakistan are 0.927 and 0.742 respectively.
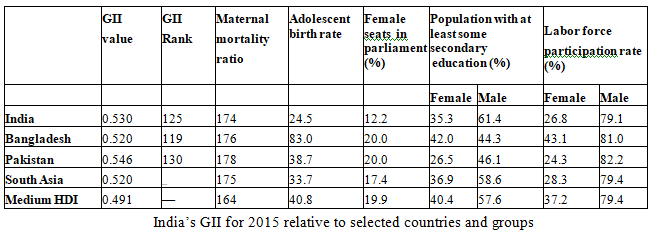
- Gender Inequality Index: GII reflects gender-based inequalities in three dimensions – reproductive health, empowerment, and economic activity. Reproductive health is measured by maternal mortality and adolescent birth rates; empowerment is measured by the share of parliamentary seats held by women and attainment in secondary and higher education by each gender; and economic activity is measured by the labour market participation rate for women and men. The GII can be interpreted as the loss in human development due to inequality between female and male achievements in the three GII dimensions.
- India has a GII value of 0.530, ranking it 125 out of 159 countries in the 2015 index. In India, 12.2 % of parliamentary seats are held by women, and 35.3 % of adult women have reached at least a secondary level of education compared to 61.4 % of their male counterparts. For every 100,000 live births, 174 women die from pregnancy related causes; and the adolescent birth rate is 24.5 births per 1,000 women of ages 15-19. Female participation in the labour market is 26.8 % compared to 79.1 for men. In comparison, Bangladesh and Pakistan are ranked at 119 and 130 respectively on this index.
- Multidimensional Poverty Index MPI identifies multiple overlapping deprivations suffered by households in 3 dimensions: education, health and living standards. The education and health dimensions are each based on two indicators, while standard of living is based on six indicators. If the household deprivation score is 33.3 % or greater, the household is classified as multidimensionally poor. Households with a deprivation score greater than or equal to 20 % but less than 33.3 % live near multidimensional poverty. Finally, households with a deprivation score greater than or equal to 50 % live in severe multidimensional poverty.
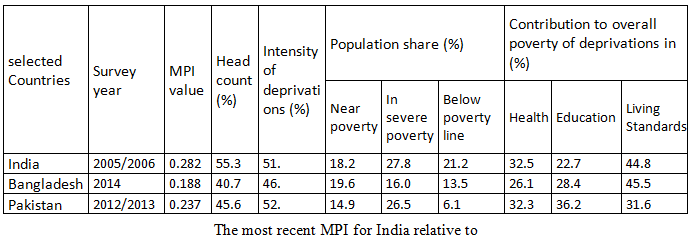
- In India (2006), 55.3 % of the population are multidimensionally poor while an additional 18.2 % live near multidimensional poverty. The breadth of deprivation (intensity) in India, which is the average deprivation score experienced by people in multidimensional poverty, is 51.1 %. MPI is the share of the population that is multi - dimensionally poor, adjusted by the intensity of the deprivations. India’s MPI is 0.282. Bangladesh and Pakistan have MPIs of 0.188 and 0.237 respectively. T
- Table compares multidimensional poverty with income poverty, measured by the %age of the population living below PPP US$1.90 per day. It shows that income poverty only tells part of the story. The multidimensional poverty headcount is 34.1 %age points higher than income poverty. This implies that individuals living above the income poverty line may still suffer deprivations in education, health and other living conditions. Table F also shows the %age of India’s population that lives near multidimensional poverty and that lives in severe multidimensional poverty. The contributions of deprivations in each dimension to overall poverty complete a comprehensive picture of people living in multidimensional poverty in India.
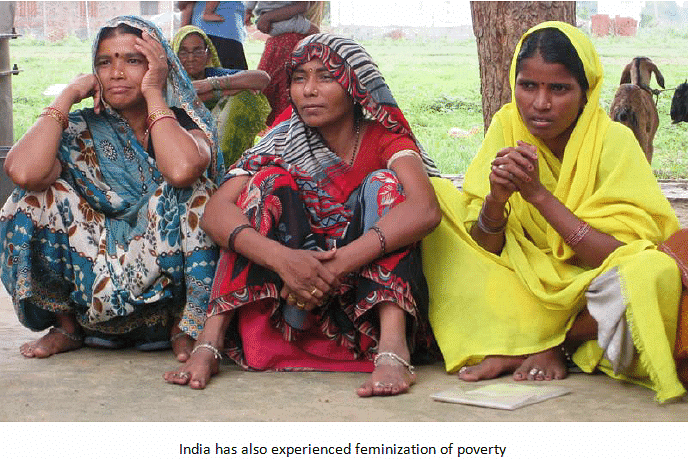
What is “Feminization of Poverty”?
- The “feminization of poverty” is an idea that dates back to the 1970s. It was popularized at the start of the 1990s, not least in research by United Nation agencies. The concept has various meanings, some of which are not entirely consistent with its implicit notion of change. We propose a definition that is in line with many recent studies in the field: the feminization of poverty is a change in poverty levels that is biased against women or female-headed households.
- More specifically, it is an increase in the difference in poverty levels between women and men, or between households headed by females on the one hand, and those headed by males or couples on the other. The term can also be used to mean an increase in poverty due to gender inequalities, though we prefer to call this the feminization of the causes of poverty.
- The precise definition of the feminization of poverty depends on two subsidiary questions: what is poverty? and what is feminization? Poverty is a lack of resources, capabilities or freedoms that are commonly called the dimensions of poverty. The term “feminization” can be used to indicate a gender-biased change in any of these dimensions. Feminization is an action, a process of becoming more feminine. In this case, “feminine” means “more common or intense among women or female-headed households”.
- Because it implies change, the feminization of poverty should not be confused with the prevalence of higher levels of poverty among women or female-headed households. Feminization is a process, whereas a “higher level of poverty” is a state. Feminization is also a relative concept based on a comparison of women and men, including households headed by them. What is important here is the difference between women and men at each moment. Since the concept is relative, feminization does not necessarily imply an absolute worsening in poverty among women or female headed-households. If poverty is reduced sharply among men and only slightly among women, there would still be a feminization of poverty.
- Relative changes in poverty levels can be measured in terms of poverty “among female-headed households” and “among women”. These indicators, however, do not reflect the feminization of poverty. Both these and “feminization” capture a gender dimension of poverty, but in distinct ways. They differ by the unit of analysis and by the population included in each group, and obviously they have different meanings. There are reasons to consider both. The goal of headship-based indicators is to show what happens to specific vulnerable groups of women and their families, and thus their unit of analysis is the household. The population considered includes both men and women (and children) living in those households. It excludes women and men living in other household formations.
- Indicators of poverty among females completely separate men and women as individuals, and include or exclude children as a gendered group in their aggregations. In determining the feminization of poverty, interpretation of results drawn from individual measures of poverty may not be accurate. Since poverty is usually measured at the household level, male poverty is intrinsically associated with female poverty and vice versa.
- The feminization of poverty can also be defined as “an increase in the share of women or female- headed households among the poor”. In contrast to our proposal, this definition focuses on changes in the profile of the poor and not on poverty levels within gender groups. Thus it has a potential disadvantage. It is difficult to interpret the results from this approach because measures of the feminization of poverty can be affected by changes in the demographic composition of the population. For instance, the impoverishment of female-headed households can be offset by a decline in the total number of such households, and thus the result in terms of feminization can be zero. The definition we propose gives rise to indicators that are not affected by these composition effects, which can be analyzed separately.
- The feminization of poverty combines two morally unacceptable phenomena: poverty and gender inequalities. It thus deserves special attention from policymakers in determining the allocation of resources to pro-gender equity or anti-poverty measures. If poverty is not being feminized, resources can be redirected to other types of policies. Of course, whether or not the feminization of poverty is occurring in each country is a matter of empirical analysis.
|
120 videos|427 docs
|
FAQs on Poverty & Deprivation - 2 - Sociology Optional for UPSC (Notes)
| 1. What are the main causes of poverty and deprivation in India? |  |
| 2. How does poverty affect education and health outcomes? |  |
| 3. What are the government schemes in India aimed at alleviating poverty? |  |
| 4. How is poverty measured in India? |  |
| 5. What role does social inequality play in poverty and deprivation? |  |


