Ramesh Singh Summary: Inflation & Business Cycle- 2 | Indian Economy for UPSC CSE PDF Download
| Table of contents |
|
| Introduction |
|
| Depression |
|
| Recovery |
|
| Boom |
|
| Recession |
|
| Double-Dip Recession |
|
| Conclusion |
|
| Recent Developments |
|

Introduction
The discussion on growth and development highlights their mutual interdependence.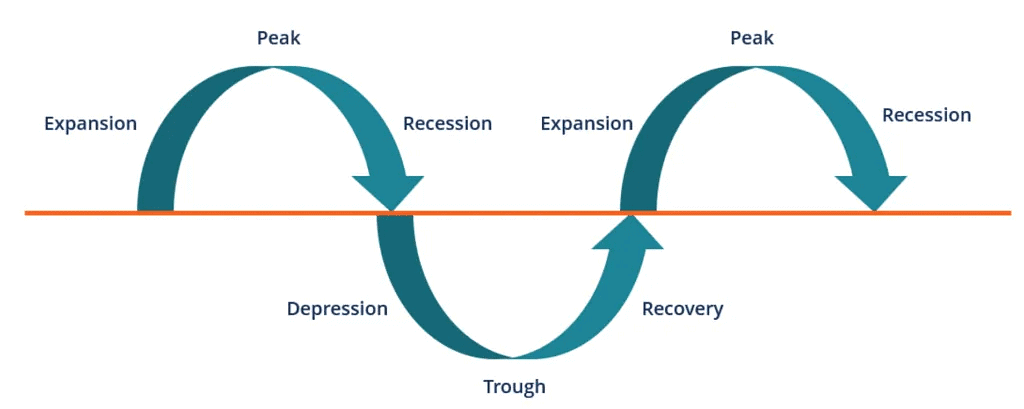 Enhancing the quality of life in an economy requires deliberate public policies that focus on key areas such as food, nutrition, health, education, shelter, and social security. To fund these expenditures and investments, the economy needs an equitable level of income. Income growth occurs through increased production levels, measured by real gross national product (GNP). Thus, development necessitates higher growth and economic activities, leading governments worldwide to constantly adjust their policies to maintain these desired levels. However, governments sometimes fail, resulting in the cyclical phenomenon of boom and bust, particularly in capitalist and market economies.
Key Points
- Interdependence of Growth and Development: Both are essential for enhancing the quality of life.
- Need for Public Policy: Investment in food, nutrition, health, education, shelter, and social security.
- Income Growth: Achieved through increased production levels (real GNP).
- Government Role: Continuous policy adjustments to sustain economic activities.
- Boom and Bust Cycles: Common in capitalist and market economies.
Depression
Although a depression has only occurred globally once, in 1929, economists have identified several key characteristics:
- Extremely Low Aggregate Demand: Causes economic activities to decelerate.
- Lower Inflation: Comparatively lower during this phase.
- Shrinking Employment Opportunities: Rapid increase in unemployment.
- Forced Labor Cuts or Retrenchment: Production houses reduce production costs to stay competitive.
During a depression, economic conditions become so chaotic that governments have little control over the economy. The Great Depression of 1929 led to the adoption of strong government interventions, such as deficit financing and monetary management.
If depression visits an economy, the common response is to replicate the policy measures of 1929. The best strategy to avoid depression is to prevent its occurrence. Therefore, modern economies closely monitor key economic indicators to implement timely prevention measures and avoid depression.
Key Points:
- Replication of 1929 Measures: Using historical policy measures as a guide.
- Prevention Focus: Vigilant monitoring of economic indicators to implement timely measures.
Recovery
When an economy attempts to exit a low production phase, whether it be a depression, recession, or slowdown, governments implement various fiscal and monetary measures to boost demand and production. This leads to an economic recovery, characterized by the following traits:
- Upturn in Aggregate Demand: Accompanied by increased production.
- Expanded Production: Attracts new investments.
- Rising Inflation: Makes borrowing cheaper for investors.
- New Employment Opportunities: Decline in unemployment rates.
Increased incomes from these factors create new demand, starting a cycle of demand and production that aids economic recovery. Common government measures include tax breaks, interest cuts, and salary increases for employees. Innovations by entrepreneurs, incentivized by the government, also play a crucial role in recovery.
Key Points:
- Boost Demand and Production: Through fiscal and monetary measures.
- Tax Breaks and Interest Cuts: Common government actions.
- Entrepreneurial Innovation: Critical for recovery, incentivized by the government.
Boom
A boom is a strong upward fluctuation in economic activities, often resulting from recovery measures taken by governments and the private sector. The major traits of a boom include:
- Accelerated Demand Increase: Prolonged and significant.
- Peak Demand: Exceeds sustainable production levels.
- Demand-Supply Lag: Economic heating up.
- Inflation Rise: Due to demand-supply disequilibrium.
- Structural Problems: Shortage of investable capital, lower savings, falling living standards, and a seller's market.
While recovery is positive, leading to a boom, it often results in rising prices. The experience of developed economies in the 1990s, especially the US, and India in the early 2000s illustrates this pattern. The symptoms of overheating, following a boom, include:
- Downturn in Aggregate Demand: Decline in overall demand.
- Falling Production Levels: Reduced output.
- Stagnant Employment Growth: Lack of new employment opportunities.
- Voluntary Labor Cuts: Increasing unemployment rates.
- Risk of Depression: If not addressed by the government.
- Low Inflation Rates: Discouraging new investments.
Key Points:
- Strong Upward Fluctuation: In economic activities.
- Demand Exceeds Production: Leading to inflation.
- Overheating Symptoms: Decline in demand and production, rising unemployment.
Recession
A recession is similar to a depression but milder, potentially leading to depression if not managed properly. The recent global financial crises triggered severe recessionary trends. The major traits of a recession include:
- General Fall in Demand: Economic activities downturn.
- Low or Falling Inflation: Further signs of decline.
- Rising Unemployment: Declining employment rate.
- Price Cuts by Industries: To sustain business.
In 1996-97, India experienced a recession due to a general downturn in domestic and foreign demands, initiated by the Southeast Asian Currency Crisis. Recovery was achieved only by the end of the decade. Government measures to combat recession typically include:
- Cutting Taxes: Direct and indirect, to increase consumer disposable income and make goods cheaper.
- Reducing Burden of Direct Taxes: Income tax, dividend tax, and interest tax to stimulate demand.
Key Points:
- Milder Form of Depression: Fatal if not handled properly.
- Tax Reductions: To increase disposable income and stimulate demand.
- Historical Examples: India's recovery in the late 1990s.
Government Measures to Enhance Disposable Income
- Tax Reductions: Direct and indirect taxes are slashed to increase consumers' disposable income (income after direct tax payment).
- Salary Increases: Government revises salaries and wages upward to encourage general spending, similar to the implementation of the fifth pay commission recommendations in 1996-97.
- Indirect Tax Cuts: Custom duty, excise duty (CENVAT), sales tax, etc., are reduced to lower the market prices of produced goods.
- Cheap Money Policy: Government reduces interest rates and liberalizes lending procedures.
- Investment Incentives: Tax breaks for new investments in productive areas.
These measures were implemented by the United Front Government in 1996-97 to combat recession. Subsequent governments also adopted similar strategies, aided by a global economic recovery, leading to India's economic revival from recession.
Key Points:
- Tax Cuts: To enhance disposable income.
- Salary and Wage Increases: To boost general spending.
- Reduction of Indirect Taxes: To lower market prices.
- Cheap Money Policy: Lower interest rates and liberalized lending.
- Investment Incentives: Tax breaks for new investments.
Growth recession describes an economy growing so slowly that more jobs are lost than created, making it feel like a recession despite positive GDP growth. This term was used to describe the U.S. economy between 2002 and 2003 and several times over the past 25 years. The financial crises since 2008 in Euro-American economies have revived this concept.
Key Points:
- Slow Job Growth: More jobs lost than created.
- Feel of Recession: Despite positive GDP growth.
- Historical Example: U.S. economy (2002-2003).
Double-Dip Recession
A double-dip recession occurs when an economy falls into recession, recovers briefly, and then falls into recession again, with GDP growth sliding back to negative after a quarter or two of positive growth. Causes include reduced demand due to layoffs and spending cutbacks from the previous downturn. This scenario can lead to a deeper and longer recession, as feared in the Euro Zone crisis by early 2013.
Key Points:
- Recession-Recovery-Recession: GDP growth turns negative after a brief recovery.
- Causes: Reduced demand from previous layoffs and spending cutbacks.
- Worst-Case Scenario: Leads to deeper and longer recession.
Conclusion
Business cycles are fluctuations in economic production levels above and below the trend of equilibrium. Factors causing these fluctuations include:
- Economic Instability and Uncertainty: Discourages investments, reducing long-term growth.
- Lack of Innovation: Absence of creative destruction can lead to economic slumps or slowdowns.
- Anti-Inflationary Policies: Especially near elections, can deter investment.
- Unforeseen Disasters: Can cause economic fluctuations
Recent Developments
- Inflation Trends: Inflation has moderated to 3.34% in March 2025, down from 6.62% in 2020, with food inflation at 2.69%, reflecting deflation in items like eggs and vegetables.
- GDP Growth: FY25 GDP growth is estimated at 6.4%, a stable growth phase compared to the -6.6% contraction in 2020, with India ranked as the 5th largest economy globally.
- Monetary Policy: The RBI cut the repo rate to 6.25% in 2025 to support growth amidst low inflation, a shift from the aggressive rate cuts during the 2020 crisis.
- Government Policies: Recent initiatives include Production Linked Incentive (PLI) schemes, increased infrastructure spending, and agricultural reforms post-2020, unlike earlier policies like demonetization.
- Global and Sectoral Impacts: The Russia-Ukraine war since 2022 has affected commodity prices, while sectors like manufacturing benefit from PLI schemes, and agriculture faces food deflation.
These developments highlight India's shift towards a balanced growth trajectory, supported by proactive fiscal and monetary policies.
Key Points:
- Low Inflation: 3.34% in March 2025, supporting economic stability.
- Stable GDP Growth: 6.4% in FY25, reflecting recovery and growth.
- Policy Reforms: PLI schemes and infrastructure focus drive sectoral growth.
Recent Developments
As of 2025, India’s economy reflects a balanced growth trajectory amidst global and domestic challenges. The following developments in inflation and business cycles are critical for understanding the current economic landscape, particularly for UPSC preparation.
- Inflation Trends: CPI inflation stabilized at ~4.5% in April–May 2025 (RBI target: 4% ± 2%), up from 3.34% in March, driven by food inflation (~5%) due to erratic monsoons (2024 La Niña). Core inflation (~4%) guides RBI policy, reflecting stable non-food/fuel prices. E-commerce (15% of retail) influences price discovery, complicating inflation measurement.
- GDP Growth: FY25 GDP growth projected at 6.5–7% (Economic Survey 2024–25), led by services (54% of GVA) and manufacturing (PLI-driven). This marks a stable expansion phase, though informal sector joblessness raises growth recession concerns. India remains the 5th largest economy, aiming for 3rd by 2030.
- Monetary Policy: RBI maintains a repo rate of 6.25% with a neutral stance (since mid-2024), balancing growth and inflation. The e-Rupee pilot (expanded 2024–25) enhances money supply control. Variable Rate Reverse Repo (VRRR) auctions manage liquidity, replacing COVID-era tools like LTRO.
- Fiscal Policy: Budget 2025 allocates ₹12 lakh crore for capex, focusing on infrastructure and green energy (₹1 lakh crore for solar). Tax slabs revised to make ₹12.75 lakh tax-free (new regime), boosting consumption. Fiscal deficit targeted at <4.5% by FY26, supporting inflation control. The 16th Finance Commission’s report (due 2025) will shape fiscal federalism.
- Global Influences: US Fed rate cuts to ~4.5% (2024–25) ease capital flow pressures, while China’s ~4% growth and deflation impact India’s exports. Russia-Ukraine war stabilization keeps oil at $70–80/barrel, moderating fuel inflation. FTAs (India-UAE, India-Australia) lower import costs, influencing prices.
- Sectoral Dynamics: Services dominate (54% GVA), with IT and fintech thriving. Manufacturing grows via PLI schemes, but agriculture faces deflation risks (e.g., vegetables). Green transition costs (renewables) contribute to short-term cost-push inflation, aligned with net-zero 2070 goals.
- Structural Challenges: Climate shocks (erratic monsoons) and jobless growth in informal sectors pose risks. RBI’s real-time data use (mobility indices, online prices) and anchored inflation expectations (~4–5%, household surveys) enhance policy precision.
|
138 videos|431 docs|128 tests
|
FAQs on Ramesh Singh Summary: Inflation & Business Cycle- 2 - Indian Economy for UPSC CSE
| 1. What is the GDP deflator and how is it calculated? |  |
| 2. What is the base effect in relation to the GDP deflator? | |
| 3. How does inflation impact the business cycle? | |
| 4. Why is it important for policymakers to monitor the GDP deflator? | |
| 5. How does the GDP deflator differ from other measures of inflation, such as the Consumer Price Index (CPI)? | |


mock tests for examination
,MCQs
,Exam
,study material
,video lectures
,Viva Questions
,Previous Year Questions with Solutions
,Free
,Ramesh Singh Summary: Inflation & Business Cycle- 2 | Indian Economy for UPSC CSE
,Summary
,Important questions
,Semester Notes
,Extra Questions
,ppt
,practice quizzes
,Objective type Questions
,Ramesh Singh Summary: Inflation & Business Cycle- 2 | Indian Economy for UPSC CSE
,past year papers
,Sample Paper
,Ramesh Singh Summary: Inflation & Business Cycle- 2 | Indian Economy for UPSC CSE
,shortcuts and tricks
;


Ramesh Singh Summary: Inflation & Business Cycle- 2 Free PDF Download
Importance of Ramesh Singh Summary: Inflation & Business Cycle- 2
Ramesh Singh Summary: Inflation & Business Cycle- 2 Notes
Ramesh Singh Summary: Inflation & Business Cycle- 2 UPSC Questions
Study Ramesh Singh Summary: Inflation & Business Cycle- 2 on the App
|
© EduRev
|
Education Revolution
|


|


