Remote Sensing | NABARD Grade A & Grade B Preparation - Bank Exams PDF Download
Introduction
The lack of dependable information and effective assessment techniques in ecological research can have far-reaching implications for biodiversity conservation and the identification of indicator species capable of predicting changes in a specific ecosystem, as noted by Salem in 2003. Data relevant to these objectives can be obtained through both ground-based and remote sensing methods. Ground-based data acquisition involves activities such as field observations, in-situ data collection, measurements, and land surveying, while remote sensing methods rely on the utilization of image data obtained from various types of sensors like aerial cameras, scanners, or radar, as described by Janssen in 2001. Satellite remote sensing is a valuable technological advancement, especially given the substantial pressures on our natural environment, as emphasized by Roy and Ravan in 1994.
This technology enables the interpretation of images or numerical data acquired from a distance to extract meaningful information about specific features on Earth, as discussed by Janssen and Bakker in 2001 and Mertes in 2002. Over the past few decades, the application of remote sensing has not only transformed data collection methods but has also significantly enhanced the quality and accessibility of critical spatial information for the conservation and management of natural resources, as highlighted by Bedru in 2006. Simultaneously, the increasing reliability of Geographic Information Systems (GIS) has enabled the interpretation of large volumes of data generated through remote sensing to address various environmental challenges, as noted by Menon and Bawa in 1997 and Bedru in 2006.
Remote Sensing

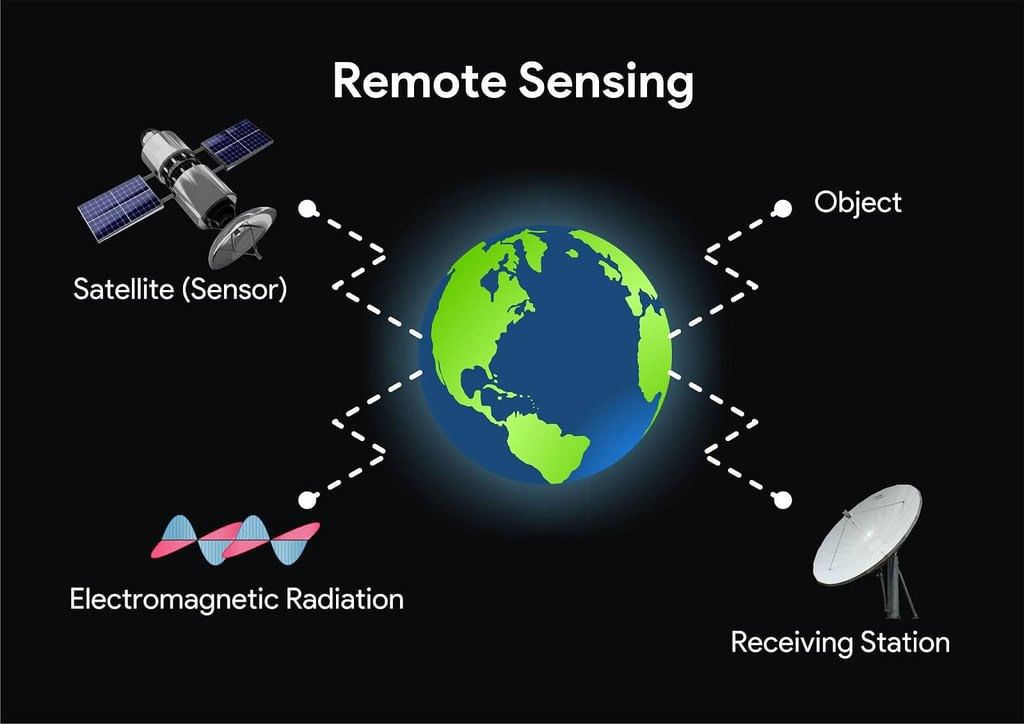
Remote sensing is both an art and a scientific method employed to gather information about a characteristic of an object, region, or phenomenon without direct physical contact with the subject of investigation. This concept is discussed by Janssen in 2001, Mironga in 2004, and Bedru in 2006. Instruments used for remote sensing can utilize various forms of physical energy distribution. For instance, sonars operate on the basis of acoustic wave distribution, while optical devices like cameras and multi-spectral scanners use electromagnetic energy distribution. In this process, the interactions between electromagnetic radiation and the Earth's surface, as measured by sensors on aircraft or satellites, are utilized to gather data related to a specific area and track changes in land-use and land-cover patterns, as explained by Mironga in 2004.
The data obtained through remote sensing, once analyzed, are typically stored in the form of image data, such as aerial photographs or satellite images. These images can be integrated and examined using Geographic Information Systems (GIS) to represent real-world features. Although it is possible to process and interpret remote sensing data independently, the most effective results are often achieved by connecting remote sensing measurements with ground or surface measurements and observations, as suggested by Janssen in 2001.
Electromagnetic Energy and Remote Sensing
Remote sensing is dependent on the measurement of electromagnetic energy that is either reflected from or emitted by the Earth's surface. This concept is discussed by Janssen in 2001 and Woldai in the same year. Electromagnetic energy, which travels through space in the form of waves, is characterized by perpendicular electrical and magnetic fields, as explained by Woldai in 2001. Objects with a certain temperature emit electromagnetic waves across various wavelengths. The entire range of wavelengths is collectively known as the electromagnetic spectrum, which spans from gamma rays to radio waves. Remote sensing is employed in different regions of the electromagnetic spectrum. The ultraviolet part of the spectrum has the shortest wavelengths, while the thermal and microwave regions encompass longer wavelengths that are practically utilized in remote sensing.
When electromagnetic radiation interacts with a surface, some of the energy is absorbed, some passes through the surface, and the remainder is reflected. Earth's surfaces also naturally emit radiation, primarily in the form of heat (infrared radiation), and these reflected and emitted radiations are captured on photographic film or by a digital sensor, as noted by Mironga in 2004. The thermal infrared portion of the electromagnetic radiation provides information about surface temperature, which can be linked to various Earth features such as the mineral composition of rocks or the condition of vegetation cover. Microwaves offer insights into surface roughness and properties of the Earth's surface, such as water content. The visible region of the spectrum, commonly referred to as light, is the only segment associated with colors. Within this visible spectrum, blue, green, and red are considered the primary colors.
Active and Passive Remote Sensing
Remote sensing relies on devices called sensors, which are capable of measuring and recording electromagnetic energy. Active sensors, like radar and laser, have their own energy source and can emit a controlled beam of energy towards the Earth's surface, subsequently measuring the amount of energy reflected back. These sensors are employed to calculate the time delay between emission and return, enabling the determination of an object's location, height, speed, and direction. Active sensors are versatile, as they can emit their own controlled signals, allowing them to operate both day and night, independent of external energy sources.
In contrast, passive sensors exclusively rely on natural energy sources. Most passive sensors utilize sunlight as their primary energy source, limiting their operation to daytime. However, passive sensors that measure longer wavelengths associated with the Earth's temperature are not reliant on external illumination sources and can be used at any time, as elucidated by Woldai in 2001.
Image Data Characterization
Remote sensor data go beyond mere pictures; they consist of measurements of emitted or reflected electromagnetic energy. These image data are typically organized in a structured grid format with rows and columns, where each individual picture element is represented as a 'pixel.' Since the intensity and wavelengths of reflected and emitted electromagnetic radiation are unique to each Earth surface, each surface possesses its distinctive 'spectral signature.' This signature can be mapped and analyzed using remote sensing techniques, as discussed by Janssen and Bakker in 2001, Mironga in 2004, and Jensen in 2005.
Information extracted from remote sensing images can be interpreted through visual image analysis, relying on an individual's ability to relate colors and patterns to real-world features. The image is then displayed on a screen or in a printed format and used to interpret the colors and patterns within the image. In digital image classification, the operator provides instructions to the computer for the interpretation process, as explained by Janssen and Bakker in 2001.
Limitations of Remote Sensing
Despite its extensive utility in various fields of interest, the application of remote sensing technology for monitoring and managing habitats and ecosystems is likely to encounter certain practical limitations. These limitations encompass inherent constraints associated with the technology itself. For instance, there is a constraint in the ability of light to penetrate through water and the atmosphere, posing challenges when it comes to data acquisition.
Another limitation pertains to the challenges in selecting appropriate sensors. Remote sensing, for example, often provides information related to the physical characteristics of geographic features (geomorphological) rather than ecological data concerning reef structures. This limitation is attributed to the limited spectral and spatial resolution of sensors due to external factors such as turbidity and water depth.
Additionally, a prominent limitation of remote sensing is the issue of cloud cover. Cloud cover can significantly reduce the availability of suitable images throughout different seasons, impeding the continuous monitoring of areas of interest, as pointed out by Mironga in 2004.
Geographic Information System (GIS)

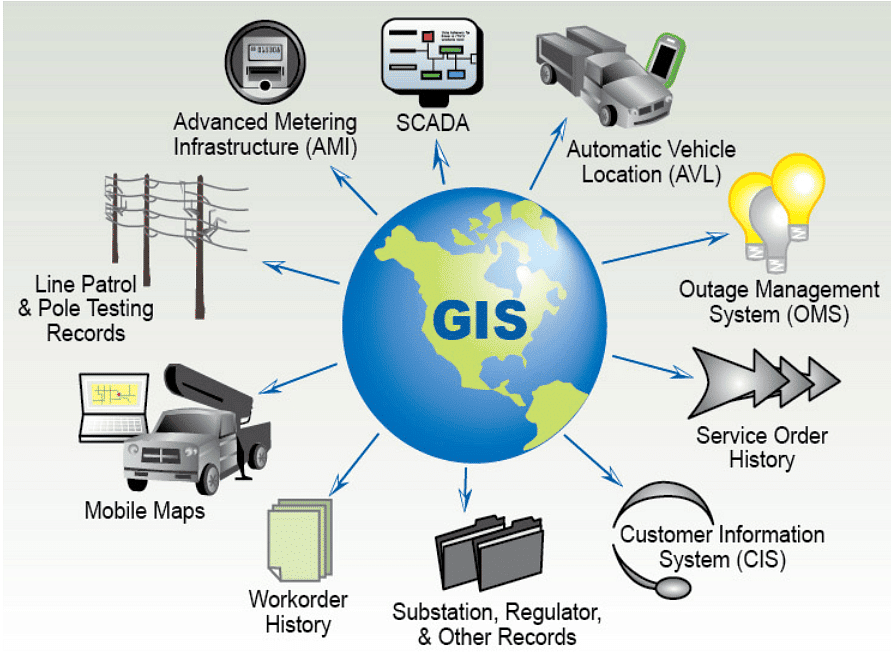
GIS is computerized software designed to store, retrieve, manipulate, analyze, and display data sets that are geographically referenced. These data sets have a wide range of applications, as discussed by Roy in 1993, Roy and Ravan in 1994, DeBy in 2001, Salem in 2003, Larson and colleagues in 2004, and Mironga in 2004. GIS handles two primary types of data: geospatial data, which defines the location of features or objects on the Earth's surface, and attribute data, which describe the characteristics of these features, as outlined by Larson and colleagues in 2004.
The implementation of georeferenced data in GIS involves three crucial stages: data preparation and entry, analysis, and presentation, according to the research by Roy and Ravan in 1994 and DeBy in 2001. GIS has the capacity to present information in a precise and comprehensive manner accessible to all users, as emphasized by Mironga in 2004.
GIS data is represented and stored in either vector or raster formats. In the vector data structure, geospatial data are represented as points, lines, or polygons. For example, points may represent fire rings or campsites, lines can depict trails or streams, and polygons could represent forests or recreation opportunity areas. Conversely, a raster data structure represents geospatial data in a grid of cells, with attributes applying to each entire cell. Raster data offer continuous coverage of an area. For instance, a Digital Elevation Model can use a raster data structure to display slope, aspect, and elevation for an area.
Attribute data can be managed within a rational database software, comprising records and fields. GIS's unique strength lies in its ability to link spatial and attribute data and conduct manipulation and analysis of relationships between them, as described by Larson and colleagues in 2004. This analytical capability leads to the generation of new information as patterns and spatial relationships are unveiled, as explained by Milla and colleagues in 2005.
GIS serves as a valuable tool for analyzing resource selection of wildlife species and predicting and mapping their habitat suitability. It allows researchers to utilize diverse sources of land cover and habitat data, including remote imagery from aerial photographs, satellite sensors, and GIS databases containing information on elevation, surface water, climate, and land types. Consequently, advances in our understanding of wildlife habitat are achieved through the development and application of GIS technologies, as highlighted by Larson and colleagues in 2003.
|
847 videos|1297 docs|420 tests
|


