Standard Deviation & Coefficient of Variation | Botany Optional for UPSC PDF Download
Introduction
Standard deviation, a fundamental statistical measure, plays a crucial role in comprehending the dispersion of data in a dataset. This article delves into the intricacies of the standard deviation formula, offering insights into how it quantifies the spread of data points around the mean value. Readers will gain a comprehensive understanding of this essential statistical concept, including various methods for calculating standard deviation and real-world examples.
Standard Deviation Definition
Standard deviation is a statistical metric that measures the extent to which data points in a dataset deviate from the mean (average) value. It quantifies the degree of variation in a set of data, providing insights into how individual data points differ from the mean value.
The standard deviation of the given sample of the data set is also defined as the square root of the variance of the data set. The mean deviation of the n values (say x1, x2, x3, …, xn) is calculated by taking the sum of the squares of the difference of each value from the mean, i.e.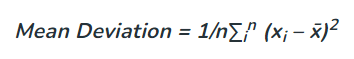
 The mean deviation is used to tell us about the scatter of the data. The lower degree of deviation tells us that the observations xi are close to the mean value and the depression is low, whereas the higher degree of deviation tells us that the observations xi are far from the mean value and the dispersion is high.
Standard Deviation Formula
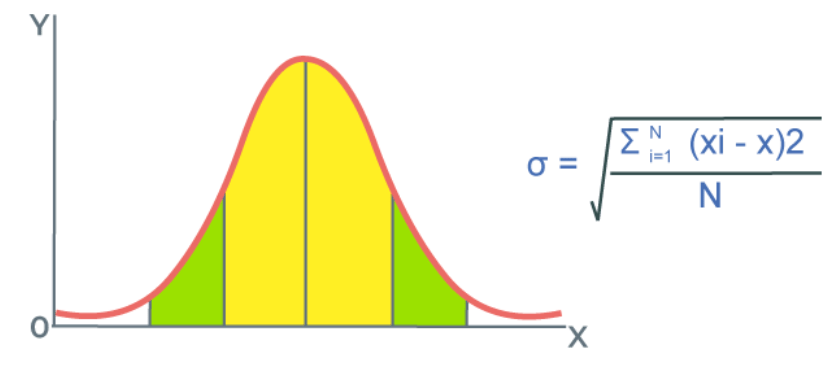
The standard deviation formula is instrumental in assessing the spread of statistical data. It quantifies how far data points deviate from their mean position. To calculate standard deviation, there are two primary formulas:
- Population Standard Deviation Formula:

Where,
s = Population Standard Deviation,
xi = ith observation,
x̄ = Sample Mean, and
N = number of observations. - Sample Standard Deviation Formula:Where,
σ = Population Standard Deviation,
xi = ith observation,
μ = Population mean, and
N = number of observations.
 Where,
The key distinction between these formulas lies in the denominator: N for population data and n−1 for sample data. This adjustment, known as Bessel's correction, ensures more accurate results for sample data.
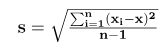
Formula for Calculating Standard Deviation
The formula used for calculating the Standard Deviation is discussed in the image below: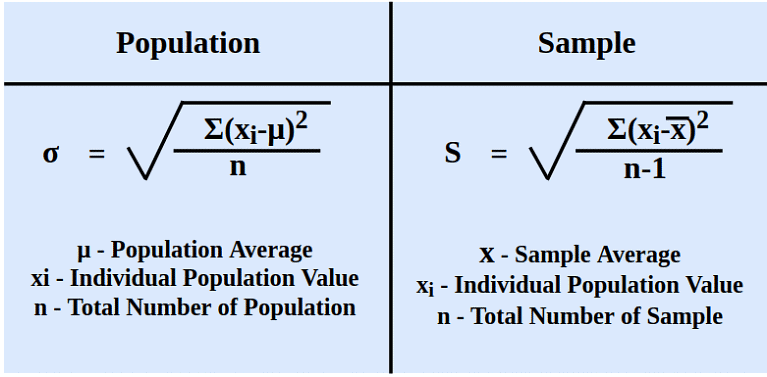
How to Calculate Standard Deviation?
Generally, when we talk about standard deviation we talk about population standard deviation. The steps to calculate the standard deviation of a given set of values is,
- Step 1: Calculate the mean of the observation using the formula (Mean = Sum of Observations/Number of Observations)
- Step 2: Calculate the squared differences of the data values from the mean. (Data Value – Mean)2
- Step 3: Calculate the average of the squared differences. (Variance = Sum of Squared Differences / Number of Observations)
- Step 4: Calculate the square root of variance this gives the Standard Deviation. (Standard Deviation = √Variance)
Standard Deviation of Ungrouped Data
For ungrouped data, three methods are commonly used:
- Actual Mean Method: Calculate the mean (average) and then apply the standard deviation formula.
- Assumed Mean Method: Assume an arbitrary mean value and compute standard deviation accordingly.
- Step Deviation Method: Calculate step deviations and apply the standard deviation formula.
Standard Deviation by Actual Mean Method
Standard Deviation by actual mean method uses the basic mean formula to calculate the mean of the given data and using this mean value we find out the standard deviation of the given data values. We calculate the mean in this method with the formula,
μ = (Sum of Observations)/(Number of Observations)
and then the standard deviation is calculated using the standard deviation formula.
σ = √(∑in (xi – x̄)2/n)
Standard Deviation by Assumed Mean Method
For very large values of x finding the mean of the grouped data is a tedious task and so we assumed an arbitrary value (A) as the mean value and then calculate the standard deviation using the normal method. Suppose for the group of n data values ( x1, x2, x3, …, xn), the assumed mean is A then the deviation is,
di = xi – A
Now, the assumed mean formula is,
σ = √(∑in (di)2/n)
Standard Deviation by Step Deviation Method
We can also calculate the standard deviation of the grouped data using the step deviation method. As in the above method in this method also, we choose some arbitrary data value as the assumed mean (say A). Then we calculate the deviations of all data values (x1, x2, x3, …, xn),
di = xi – A
In the next step, we calculate the Step Deviations (d’) using
d’ = d/i
where ‘i‘ is a common factor of all ‘d’ values
Then, the standard deviation formula is,
σ = √[(∑(d’)2 /n) – (∑d’/n)2] × i
where ‘n‘ is the total number of data values.
Standard Deviation of Discrete Grouped Data
For discrete grouped data, similar methods as in ungrouped data can be used:
- Actual Mean Method
- Assumed Mean Method
- Step Deviation Method
Standard Deviation of Continuous Grouped Data
For continuous grouped data, the standard deviation can be determined by applying the discrete data formulas after replacing each class with its midpoint.
Standard Deviation of Probability Distribution
In probability distributions such as normal, binomial, and Poisson, specific formulas are used to calculate the standard deviation:
- For normal distribution: σ = 1
- For binomial distribution: σ = √npq
- For Poisson distribution: σ = √λt
Standard Deviation of Random Variables
Random variables are numerical values representing possible outcomes of random experiments. The standard deviation of a random variable is calculated using the formula:
σ = √(∑ (xi – μ)2×P(X)/n)
This formula offers insights into the probability distribution and deviation from the expected value.
What is Coefficient of Variation?
- When dealing with data sets expressed in different units, comparing their variability using standard deviation is not appropriate, as standard deviation is an absolute measure of dispersion. To address this issue, we turn to relative measures of standard deviation, and the Coefficient of Variation is one such measure.
- The Coefficient of Variation allows us to compare two or more groups of similar data concerning their stability, homogeneity, or consistency. It provides insight into the relationship between the standard deviation and the arithmetic mean of the given distributions or series. Importantly, the Coefficient of Variation is expressed as a percentage, making it a valuable tool for comparative analysis.
The Formula for Coefficient of Variation
The formula for calculating the Coefficient of Variation (CV) is as follows: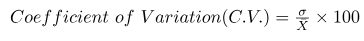
Where,
C.V. = Coefficient of Variation
σ = Standard Deviation
x ˉ = denotes the arithmetic mean.
In simple terms, the Coefficient of Variation is 100 times of Coefficient of Standard Deviation. The distribution/series for which the coefficient of variation is greater is more variable (less homogeneous, less consistent, less stable, or less uniform).
|
179 videos|140 docs
|

|
Nov 21, 2024 Last updated |

|
Explore Courses for UPSC exam
|
|
Standard Deviation & Coefficient of Variation | Botany Optional for UPSC
,ppt
,MCQs
,video lectures
,mock tests for examination
,Exam
,Free
,Extra Questions
,Objective type Questions
,Important questions
,shortcuts and tricks
,Previous Year Questions with Solutions
,Viva Questions
,Summary
,Standard Deviation & Coefficient of Variation | Botany Optional for UPSC
,practice quizzes
,Sample Paper
,Semester Notes
,past year papers
,Standard Deviation & Coefficient of Variation | Botany Optional for UPSC
,study material
;


Standard Deviation & Coefficient of Variation Free PDF Download
Importance of Standard Deviation & Coefficient of Variation
Standard Deviation & Coefficient of Variation Notes
Standard Deviation & Coefficient of Variation UPSC Questions
Study Standard Deviation & Coefficient of Variation on the App
|
© EduRev
|
Education Revolution
|


Follow Us
|


