The Hindu Editorial Analysis- 14th November 2024 | Current Affairs & Hindu Analysis: Daily, Weekly & Monthly - UPSC PDF Download

Surprise Spike
Why in News?
India’s consumer prices have gained fresh momentum over September and October, rendering the tangible softening in inflation to a pace below the official median target of 4% in the two months preceding them, a fleeting reprieve. From 3.65% in August, retail price rise had hit a nine-month high of 5.5% in September. To be clear, the Reserve Bank of India (RBI)’s Monetary Policy Committee (MPC), in its October review, had termed the inflation moderation as slow and uneven, and anticipated a reversal in September.
What is Inflation?
- Inflation refers to a consistent increase in the prices of different goods and services within the economy.
- It is typically measured on a yearly basis.
- For instance, if there is an inflation rate of 6% in April 2024, it indicates that prices of goods and services have risen by 6% compared to April 2023.
- Inflation is usually shown as a rateusing the following formula:
- Rate of Inflation = (Price in this Period – Price in the Previous Period) × 100 / Price in the Previous Period
- It is assessed through the Price Index (more details about the Price Index are provided in the sections below).
Types of Inflation
It can be categorized on the basis of its rate as well as its causes. Different types of inflation based on these two parameters have been explained in detail in the sections that follow.
Types of Inflation based on Rate
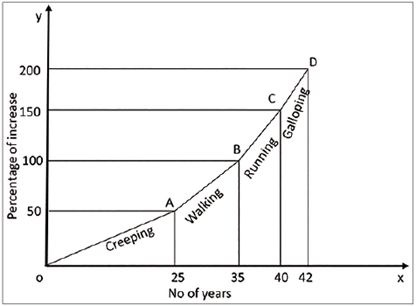
Depending on the rate of rise in prices, there are 4 types of inflation as explained below.
Creeping Inflation or Mild Inflation or Low Inflation
- Creeping Inflation refers to a slow but steady increase in prices.
- Typically, a price rise of 2 percent to 3 percent is seen as Creeping Inflation.
- This type of inflation is manageable and is usually viewed as beneficial for economic growth.
- When prices rise at this rate (2 percent to 3 percent), it allows producers and traders to earn reasonable profits.
- These profits encourage them to invest more in their businesses.
Walking Inflation or Trotting Inflation
- When the increase in prices is higher than what is seen in Creeping Inflation, it is referred to as Walking Inflation or Trotting Inflation.
- This type of inflation typically falls within a range of 3 percent to 10 percent.
- The government should view this situation as a wake-up call, because if it is not addressed, it could escalate into Running Inflation or Galloping Inflation.
Galloping Inflation or Hopping Inflation or Running Inflation
- When prices increase by more than 10 percent but less than 50 percent, it is referred to as Galloping Inflation.
- This significant rise in prices means that businesses and workers' incomes struggle to match the rising costs.
- As a result, investors tend to avoid putting their money into economies that are experiencing this high level of inflation.
Hyperinflation
- Hyperinflation is a severe type of inflation where prices increase at an extremely fast rate, typically by more than 50 percent each month.
- This situation usually happens when there is a significant rise in the money supply.
- In extreme cases of hyperinflation, the value of the local currency can drop to nearly zero, making it necessary to carry large amounts of money just to buy basic items like a loaf of bread.
- As a result, money loses its ability to act as a store of value and becomes less useful as a way to exchange goods and services.
- Recent examples of hyperinflation include situations in Zimbabwe from 2004 to 2009 and in Venezuela in 2019.

Types of Inflation based on Causes
Based on the underlying causes, inflation is, broadly, categorized into thefollowing types.
Demand-Pull Inflation
- A rise in the prices of goods and services due to a boost in overall demand and consumption is known as Demand-Pull Inflation.
- This type of inflation usually happens because people have more disposable income, which leads to higher demand for various goods and services.
- When households have more money to spend, they tend to buy more, which increases the overall demand.
- As a result, even though the total supply of goods and services stays the same, the sharp rise in demand causes prices to go up.
Cost-Push Inflation
- A rise in the prices of goods and services caused by an increase in the cost of factors of production, such as land, labor, capital, and entrepreneurs, is known as Cost-Push Inflation.
- The main reason for this type of inflation is the higher cost of one or more inputs needed for production, which includes land, labor, capital, and entrepreneurs.
- For instance, if wages for workers go up, this contributes to the overall increase in production costs.
- When the costs of producing goods or services rise, the prices for those goods or services also go up in the market.
Supply-Shock Inflation
- A rise in the cost of goods and services caused by an unexpected or sudden drop in the supply of products is known as Supply-Shock Inflation.
- It is termed “Supply-Shock” because the reasons for this inflation are beyond the control of both businesses and workers.
Structural Inflation or Bottleneck Inflation
- A rise in the prices of goods and services caused by problems in the economy, such as inefficient storage and distribution facilities and low productivity, is known as Structural Inflation or Bottleneck Inflation.
- These issues lead to a shortage of the supply of certain goods and services. When there is less supply available, the prices for those items tend to increase.
- As a result, the government faces significant challenges in addressing this type of inflation. Finding solutions to improve the economy and eliminate these inefficiencies is not easy.
Protein Inflation
- It is usually caused by changes in the eating habits of a country's people due to rising income levels.
- As more individuals start to eat foods high in protein, such as milk, pulses, meat, and fish, the demand for these items increases.
- This growing demand leads to a rise in the prices of these food items.
Measures of Inflation
- To effectively monitor and control the level of inflation in an economy, policymakers use various kinds of instruments.
- In India, inflation is mainly measured through 2 price indices – the Wholesale Price Index (WPI) and theConsumer Price Index (CPI).
- Another measure of inflation frequently used across the world is – GDP Deflator.
All these measures of inflation are discussed in detail in the sections that follow.
Price, Price Level, and Price Index
What is Price?
- The price of a good or service is the amount of money that is given in exchange for it.
- In simpler terms, the price is what you get when you sell one unit of that good or service, or what you pay when you buy it.
What is Price Level?
- The Price Level refers to the average cost of all goods and services that are available for sale in an economy.
- Understanding the price level helps economists track how prices change over time.
What is Price Index?
- A Price Index is a statistical tool that shows the average change in prices over time for a selected group of goods and services.
- This index is compared to a specific time period known as the Base Year.
- The base year is chosen and its index is set at 100. Price indices for other years are then calculated based on this.
- The formula to calculate the price index is: Price Index = (Current Year’s Price / Base Year’s Price) x 100.
- Price Indices are useful for measuring inflation levels in the economy.
Wholesale Price Index (WPI)
- The Wholesale Price Index (WPI) tracks how the prices of goods sold in bulk change over time.
- In simpler terms, the WPI looks at the average price changes for goods sold in large quantities within the early stages of sales in India's local markets.
- The WPIincludes three main groups of goods:
- Primary Products
- Fuel and Power
- Manufactured Products
- It's important to note that the WPI does not include services.
- The prices that the WPIfollows are:
- Ex-factory prices for manufactured goods
- Mandi prices for agricultural products
- Ex-mines prices for minerals
- Each item in the WPI has a weight based on its production value, which is adjusted for imports and exports.
- The Office of Economic Advisor, part of the Ministry of Commerce and Industry, compiles and publishes the WPI every month.
- The base year used for the WPI is 2011-12.
Consumer Price Index (CPI)
- Consumer Price Index (CPI) tracks the average change in prices that consumers pay for a specific set of goods and services over time.
- In simpler terms, the CPI looks at how prices change over time for the items and services that households buy for everyday use.
- Due to the different financial situations of consumers, various types of CPI are calculated in India.
CPI for Industrial Workers (CPI-IW)
- CPI for Industrial Workers (CPI-IW) tracks changes in the prices of goods that industrial workers frequently buy.
- This index is compiled and published every month by the Labor Bureau located in Shimla, under the Ministry of Labor.
- The base year for calculating CPI-IW is 2016.
- CPI-IW is important for adjusting wages in both government and organized sectors.
CPI for Urban Non-Manual Employees (CPI-UNME)
- CPI for Urban Non-Manual Employees (CPI-UNME) tracks how the prices of goods used by non-manual workers, such as those who work in offices, change over time.
- This index has now been discontinued.
- It was regularly put together by the Central Statistical Organisation (CSO), which is part of the Ministry of Statistics and Programme Implementation.
- The CPI-UNME was updated on a monthly basis.
CPI for Rural Laborers and Agricultural Laborers (CPI-AL&RL)
- CPI for Rural Laborers and Agricultural Laborers (CPI-AL&RL) tracks how the prices of goods that rural workers buy change over time.
- This index is prepared and published every month by the Labor Bureau located in Shimla, which is part of the Ministry of Labor.
- The base year for CPI-AL is 1986-87.
- This index is important because it is used to update minimum wages for agricultural workers across different states.
New Consumer Price Indices (CPIs)
- Old CPIs only represent a small part of the population, like agricultural workers and industrial laborers, which means they do not reflect the entire country’s situation.
- To address this issue, three new indices were created to include all groups of people in India.
- These new CPIs are put together and shared by the Central Statistical Organisation (CSO) for both the All India Level and the State/UT Level.
- The base year for these new CPIs is 2012.
- The three new indices are described as follows:
- CPI (Rural): This index tracks the changes in the prices of goods and services that people in rural areas specifically consume.
- CPI (Urban): This index measures the changes in the prices of goods and services that people in urban areas specifically consume.
- CPI (Combined): This index is calculated by merging the CPI (Rural) and CPI (Urban) indices.
- Following the suggestions of the Urjit Patel Committee, the Reserve Bank of India (RBI) has adopted the CPI (Combined) as the main measure of inflation for its monetary policy decisions.
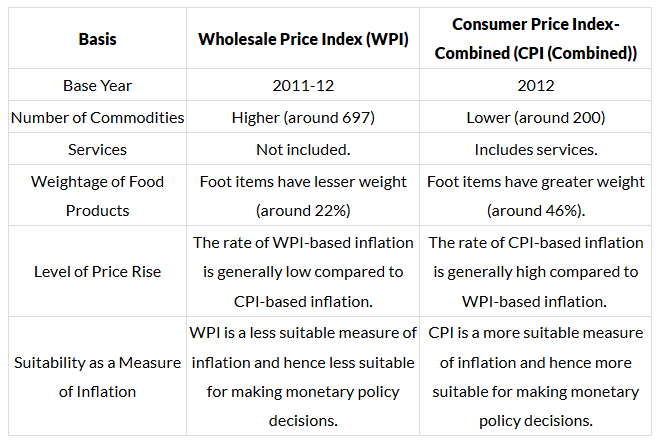
Wholesale Price Index (WPI) Vs Consumer Price Index (CPI)
The difference between WPI and CPI can be understood through a comparative study between the two. The same is presented as follows.

Producer Price Index (PPI)
- The Producer Price Index (PPI) measures the average change over time in the selling prices received by domestic producers for their output.
- While the Wholesale Price Index (WPI) and Consumer Price Index (CPI)measure price changes from the perspective of buyers, the Producer Price Index (PPI) measures price changes from the perspective of producers.
GDP Deflator
- GDP Deflator is the ratio of GDP at Current Prices to GDP at Constant Prices.
- It can be calculated with the formula: GDP Deflator = GDP at Current Prices / GDP at Constant Prices.
- The GDP Deflator provides insight into changes in the price level in the economy.
- If the GDP Deflator equals 1, it indicates that there has been no change in the overall price level.
- If the GDP Deflator is greater than 1, it shows that there has been an increase in the general price level.
- If the GDP Deflator is less than 1, it suggests a decrease in the general price level.
- Compared to WPI (Wholesale Price Index) and CPI (Consumer Price Index), the GDP Deflator is a more comprehensive measure of inflation because it considers all goods and services in the economy.
- However, the GDP Deflator is not typically used for short-term inflation targets since data related to GDP is not available on a monthly basis.
Effects of Inflation
ITs effects on various sectors of the economy can be seen as follows.
- Redistribution of Income and Wealth: This leads to a shift of money and assets from one group to another. Some people lose out, while others benefit.
- Borrower (Debtor) Vs Lender (Creditor): The borrower gains, but the lender loses. For instance, if a debtor borrows 100/- at a 5% interest rate per year, they must repay 105/- the next year. If inflation exceeds 5%, that 105/- will not buy as much as 100/- could this year, diminishing the creditor's money value.
- Producer Vs Consumer: Consumers' money loses value, causing them to pay more for the same goods and services. Thus, producers benefit, while consumers face losses.
- Flexible Income Group Vs Fixed Income Group: Flexible income groups, like sellers and self-employed individuals, adjust their earnings according to inflation and are less affected. In contrast, fixed-income groups, such as daily-wage workers, suffer as their purchasing power declines.
- Debenture or Bond Holders Vs Issuers: Bond issuers benefit while bondholders lose because the fixed payments for bonds do not keep up with inflation.
- Equity Holders: The earnings of equity holders depend on company profits. In times of inflation, companies generally make higher profits, allowing equity holders to earn more.
- Effects on Production and Consumption: When prices rise, demand for goods and services often decreases, which may lead to reduced production levels.
- Investment may shift from other sectors to those experiencing price increases, as investors seek higher profits.
- Other Effects of Inflation:
- Savings: Inflation erodes the value of money, making it unwise to hold cash. People tend to deposit money in banks to counteract inflation effects.
- Growth and Employment: Initially, rising inflation can lead to economic growth and increased employment. However, this is not guaranteed in the long run.
- Balance of Payment (BoP): High prices reduce exports and increase imports from countries where goods are cheaper, leading to a negative BoP.
- Exchange Rate: A higher volume of imports and lower exports creates a greater demand for foreign currencies compared to the domestic currency, resulting in its depreciation.
- Social and Political Impacts: High prices can cause social and political unrest, leading to strikes and protests.
Measures to Control Inflation
Measures, usually, taken to control the price rise can be studied under the following heads.
- Monetary Measures
- The RBI uses monetary tools to decrease the amount of money available in the market.
- This reduction leads to lower demand, which in turn helps to lower prices.
- In serious cases, demonetization can occur, where a specific type of currency is declared invalid.
- This action quickly cuts down the money supply, which reduces demand for goods and services.
- Fiscal Measures
- The government can lower its spending, which helps to reduce demand and lower price levels.
- Increasing direct taxes, such as Income Tax, decreases the amount of disposable income people have.
- This leads to lower demand and subsequently lower prices.
- The government might also decrease indirect taxes like Excise Duty and Sales Tax, which directly lowers prices for goods and services.
- Passing a surplus budget, where the government spends less than it earns, also helps to lower the money supply and demand.
- Trade Measures
- The government can take various steps to address shortages of goods in the local market.
- One way is by importing goods from other countries, which increases supply and helps to reduce prices.
- Administrative Measures
- Implementing a fair Wage Policy can help control production costs and the prices of goods and services.
- Sometimes, the government directly controls prices by setting maximum price limits through systems like the Administered Price System or subsidy programs.
- The government may also use rationing, which involves setting limits on how much of a good can be consumed, to help manage demand and reduce prices.
|
38 videos|5293 docs|1118 tests
|
FAQs on The Hindu Editorial Analysis- 14th November 2024 - Current Affairs & Hindu Analysis: Daily, Weekly & Monthly - UPSC
| 1. What is the main theme of the article "Surprise Spike"? |  |
| 2. How do surprise spikes in economic data affect government policy? |  |
| 3. What are some potential causes of a surprise spike in inflation? |  |
| 4. How can investors respond to a surprise spike in economic indicators? |  |
| 5. What role does data analysis play in predicting economic surprises? |  |


