Tools and Techniques for Strategic Analysis | Management Optional Notes for UPSC PDF Download
| Table of contents |

|
| Impact Matrix |

|
| Experience Curve |

|
| BCG Matrix |

|
| Industry Analysis |

|
| Concept of Value Chain |

|
| Tools and techniques for strategic analysis: GEC Mode |

|
Impact Matrix
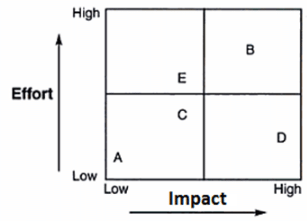
The Impact Matrix serves as an effective instrument for organizations aiming to operationalize their strategies. Positioned vertically for impact and horizontally for performance, it offers a visual representation of the relative strengths in these aspects. A higher position on the vertical axis signifies a more significant impact on perceived value. To determine the order of impact strength, one should review the matrix from top to bottom, identifying the processes from strongest to weakest influence.
- The Impact/Performance Matrix helps organizations plan better by considering different factors.
- It shows which parts of the organization are most important and how well they are performing.
- Managers can use it to figure out which people or groups have the most influence and how they affect the success of a project.
- It's a lot like other tools called Power/Interest or Power/Influence grids.
- By focusing on the main people involved in a project, managers can decide what to do first, how much time to spend, and how to avoid conflicts between them.
Impact grid
Experience Curve
The concept of the experience curve, which originated in the Boston Consultancy Group in 1968, is a relatively small but significant idea that was employed decades ago to delineate the mathematical relationship between a product's cumulative output and its associated costs. Initially developed to analyze various chemical and electronic industries in the 1960s, this work aimed to elucidate the pricing and competitive dynamics within rapidly growing market segments of these industries (Drejer, 2002). The experience curve, reflecting all costs and effects, gained widespread use after the mid-1960s, proving to be a powerful analytical tool for the burgeoning chemical and electronics sectors. Numerous studies have demonstrated that production costs typically decrease by 10% to 30% with each doubling of cumulative output.
Factors Behind Experience Curve:
- According to Bhalla (1987), three key factors contribute to the existence of the experience curve: learning, economies of scale, and technology.
Low-Cost Producer Concept:
- The experience curve suggests that the company producing the most in an industry will be the one with the lowest costs.
- Some consulting firms argue that cutting prices to gain market share is a strategy for achieving a cost advantage (Kozami, 2002).
Strategy Timing and Product Life Cycle:
- Experience curve strategies are most effective early in a product's life cycle when cumulative output doubles rapidly.
- Especially useful when a product is highly sensitive to price changes, as lowering prices in these industries can lead to significant increases in demand.
Accelerating Development Through Demand:
- Cutting prices in price-sensitive industries boosts demand, accelerating a company's movement down the experience curve.
- Lower costs resulting from increased production provide room for further price cuts, creating a cycle of improvement.
Graphical Representation:
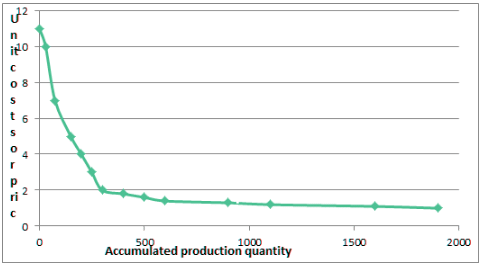
- The learning curve, a component of the experience curve, can be graphically represented.
- In this representation, unit costs are on the vertical axis (ordinate), and accumulated production quantities are on the horizontal axis (abscissa) (Reichmann, 2012).
Example of experience curve
The experience curve is characterized by a power law function, occasionally known as Henderson's Law, expressed as:
C n =C 1 n −a
Here:
C1 represents the cost of the initial unit of production.
Cn denotes the cost of the nth unit of production.
n signifies the cumulative volume of production.
a indicates the elasticity of cost concerning output.
Uses of Experience Curve
Strategic Applications:
- Experience curves find application in strategic areas, helping in understanding changes in costs with increased production volume.
- They are useful in estimating the costs involved in launching new products and deciding on appropriate pricing.
Internal Utilization:
- Within the organization, experience curves play a role in various internal processes.
- This includes setting labor standards, creating schedules, planning budgets, and deciding whether to make or buy certain components.
External Implementation:
- Externally, organizations use experience curves for dealing with suppliers and managing cash flow.
- They are handy in budgeting and estimating the costs associated with purchasing goods from suppliers.
Disparagements of the Experience Curve
Critiques of the Experience Curve:
- Some critics argue that the experience curve shouldn't be considered on its own.
- They point out that the shape of the curve heavily relies on the attitudes and outlooks of the individuals being observed.
Effect of Attitude on Curve:
- If individuals have a positive outlook, the resulting curve tends to resemble a learning curve.
- Conversely, if the attitude is negative, the curve may not accurately represent efficiency gains over time.
Summary of the Experience Curve:
- Essentially, the experience curve illustrates how workers become more efficient as they repeat the same tasks.
- It's based on the idea that as a company produces more, the cost per unit tends to decrease due to accumulated experience.
BCG Matrix
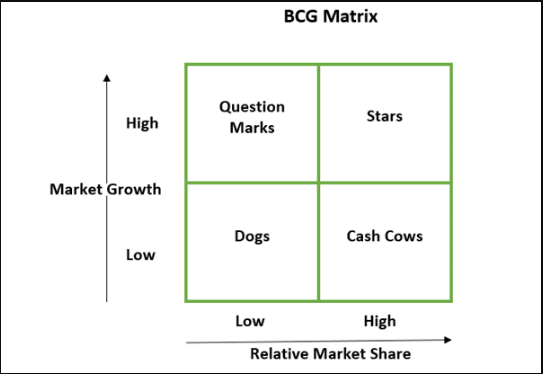
- The BCG matrix was made by Bruce Henderson from the Boston Consulting Group in the early 1970s. It's a tool to figure out which products or businesses are doing well or not so well, based on how fast the market is growing and how much of the market they have. The Boston Consulting Group created the BCG matrix to help companies see where their products are in their life cycle.
- Just like animals, products go through different stages in their life, which need different amounts of resources. The BCG matrix puts each product a company sells into a category based on how fast the business is growing and how much of the market the product controls.
- The main goal of the BCG Matrix is to help companies decide where to invest their money when they have many different products or business units. The BCG matrix is used to figure out the profiles of products or businesses, how much money they need, how fast they're growing, and where to put resources or stop investing.
- Companies can use the BCG Matrix as a tool to look into their different products and make smart decisions. It's like a chart with two lines where each product or business is placed based on two things: how fast it's growing and how much of the market it has.
- This tool helps companies figure out where to focus their efforts in areas like planning, managing products, and promoting brands. The BCG Matrix is handy for understanding and organizing different parts of a business.
Structure of BCG Matrix
Question Marks: These are products that don't make much profit unless the company spends more money to make them popular. The company has to decide whether to invest more or give up on these products.
Stars: These are the company's top products, almost like industry leaders. The plan is to invest in these products to make them even better and keep a strong position. While they need a lot of money, they also contribute to the company's profits and eventually become 'cash cows' with market saturation.
Cash Cows: These products are mature and make good profits and cash. However, they need to be replaced because their future growth will be lower. Still, they're essential because they fund other ongoing activities, including 'stars' and 'question marks'.
Dogs: These products are in a declining market and are highly competitive. The company wants to get rid of them soon as they are expensive to maintain. The company needs to minimize these products and decide whether to invest more money or eliminate them in the near future.
Benefits of BCG matrix
Simple Understanding:
- BCG Matrix is easy to understand and straightforward.
Quick Opportunity Screening:
- It helps users quickly assess opportunities and think about how to make the most of them.
Resource Allocation:
- It identifies how a company's money can be best used to grow and make more profits in the future.
Limitations of BCG Matrix
Limited Categorization:
- BCG Matrix only categorizes businesses as low or high, but sometimes businesses can be in the middle too. It might not show the true nature of a business.
Market Share and Profits:
- Just having a high market share doesn't always mean high profits. Sometimes, having a big market share comes with high costs.
Limited Indicators:
- BCG Matrix only looks at market share and growth rate, ignoring other important signs of profitability.
Two-Dimensional Model:
- It uses only two factors, which might not capture the full picture of a business.
Data Challenges:
- Gathering accurate data on market share and growth can be challenging.
Summary
- In a nutshell, the BCG Matrix is a handy tool for companies to understand how well their different parts or products are doing.
Industry Analysis
- An industry analysis is a crucial business practice conducted by business owners and management experts to assess the current business environment effectively. It serves as a valuable tool for market assessment, providing insights into the complexity of specific industries. The analysis delves into economic, political, and market factors shaping the industry's trajectory, including supplier and buyer dynamics, competitive landscape, and the potential for new entrants.
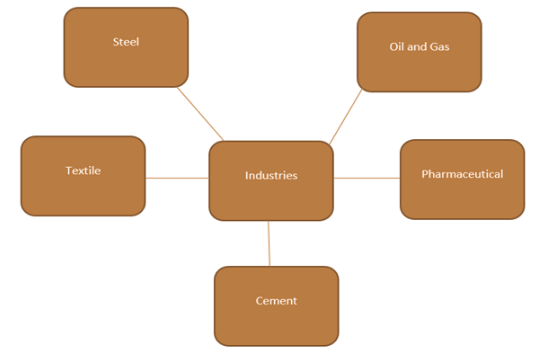
- In management literature, an industry is defined as a homogeneous grouping of companies producing similar products to meet the needs of a common set of customers. Industry analysis involves evaluating the relative strengths and weaknesses of specific industries. Industries are typically categorized based on the products they produce, such as steel, pharmaceuticals, oil and gas, textiles, and cement.
Why Industry Analysis is Important for Businesses:
- Helps businesses understand economic factors in the market.
- Guides in using these factors smartly for a competitive edge.
Standards for Industry Analysis:
- Basic rules exist for performing industry analysis.
- Small business owners often do this before starting their business.
Role of Industry Analysis in Business Planning:
- Small business owners include it in their business plan.
- Summarizes key market components like competitors, substitute goods, target markets, and demographics.
Purpose of Business Information in Analysis:
- Used to secure external financing for a new business.
- Banks or lenders may need this information.
Major Elements of Industry Analysis:
- Underlying forces at work in the industry.
- Overall attractiveness of the industry.
- Critical factors determining a company's success in the industry.
Porter's Five Forces Analysis
The Model's Origin:
- Michael E. Porter, a famous management theorist, created a significant industry analysis model.
- He introduced it in his 1980 book titled Competitive Strategy: Techniques for Analyzing Industries and Competitors.
Porter's Five Forces:
- Porter's model focuses on five key forces that shape competition within an industry.
- These forces include the threat of new competitors, bargaining power of buyers and suppliers, availability of substitute goods, and the intensity of rivalry among existing competitors.
Purpose of the Five Forces:
- The primary aim is to gauge the attractiveness of an industry.
- It helps businesses understand the competitive dynamics they face.
Significance of the Model:
- Porter's model is widely used in business strategy and management.
- It offers valuable insights into industry dynamics and guides strategic decision-making.
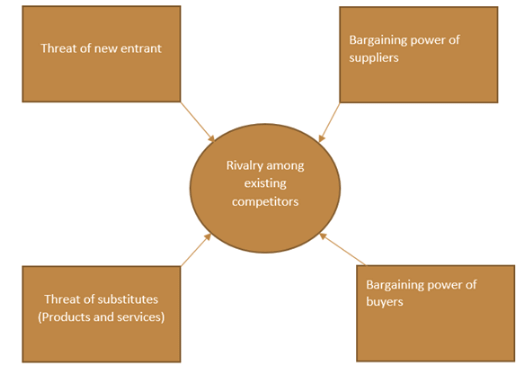
The framework for the Five Forces Analysis consists of these competitive forces:
Industry Rivalry:
- This aspect examines the intensity of competition among existing firms within an industry.
- High competition typically leads to reduced profit potential for companies operating within the industry.
- Factors indicating tough rivalry include:
- Presence of many competitors.
- High barriers to exit the industry.
- Slow or negative industry growth.
- Lack of product differentiation and ease of substitution.
- Competitors of similar size.
- Low customer loyalty, making it easier for customers to switch between brands or companies.
Threat of Substitutes:
- This force assesses the availability of substitute products or services that can fulfill the same needs as those offered by companies within the industry.
- The threat is significant when buyers can easily find alternatives that offer better prices, quality, or functionality.
- Factors indicating a high threat of substitutes include:
- Easy availability of substitute products.
- Low switching costs for customers.
- Buyer sensitivity to price and quality differences.
- Ability of substitute products to satisfy customer needs effectively.
Bargaining Power of Buyers:
- This force examines the influence that buyers (customers) have on prices and terms within the industry.
- Buyers exert strong bargaining power when they can:
- Purchase in large volumes or control access to the final consumer market.
- Choose from a limited number of suppliers.
- Easily switch between suppliers with minimal costs.
- Threaten to integrate backward into the production process.
- Have access to numerous substitute products.
- Are highly price-sensitive or have specific quality requirements.
Bargaining Power of Suppliers:
- This force evaluates the influence that suppliers have on the industry.
- Suppliers possess strong bargaining power when they can:
- Provide unique or scarce resources that are essential to the industry.
- Threaten to integrate forward into the industry's value chain.
- Control access to critical raw materials or components.
- Offer few alternatives or substitutes for their products.
- Increase switching costs for companies by making it expensive or difficult to change suppliers.
Barriers to Entry:
- This force examines the obstacles that new entrants face when attempting to enter an industry.
- High barriers to entry deter new competitors and help existing firms maintain their market share and profitability.
- Barriers may include:
- High initial capital requirements.
- Strong brand loyalty and customer preferences for existing firms.
- Economies of scale that favor larger incumbents.
- Regulatory barriers and government policies.
- Access to proprietary technology or intellectual property.
- Significant switching costs for customers.
- Limited access to distribution channels or supplier networks.
Steps in Industry Analysis
Identify the Industry:
- Understand the industry locally, regionally, nationally, or globally.
- Define industry codes and provide stats and historical data.
Summarize Industry Nature:
- Outline growth patterns, economic fluctuations, and income projections.
- Document recent developments, news, and innovations in the industry.
Provide Industry Forecast:
- Compile economic data and industry predictions over time.
- Cite sources; the industry's type and size affect available information.
Identify Government Regulations:
- Recognize laws and regulations affecting the industry.
- Mention licenses or authorizations needed for business in the target market.
Explain Unique Industry Position:
- List leading companies and analyze direct and indirect competition.
- Communicate the company's unique value proposition.
List Limitations and Risks:
- Identify factors negatively impacting the business in the short and long term.
- Outline driving forces such as regulations, technology, globalization, and competition.
Engage with the Industry:
- Attend tradeshows and business events to gather information.
- Develop a competitive strategy based on industry insights.
Importance of Industry Analysis
Understanding the Operating Environment:
- Take an impartial view of primary forces, attractiveness, and success factors in the industry.
- Formulate effective strategies and position the company for success.
Developing a Competitive Strategy:
- Identify strengths and weaknesses through a SWOT analysis.
- Anticipate shifts in industry factors for a competitive advantage.
Basis for Corporate Goals:
- Industry analysis guides analysts in setting corporate goals.
- Develop insight for crafting appropriate strategies.
Major Success Factors for Industry Analysis
- Attracting new customers.
- Retaining existing customers.
- Attracting and retaining good employees.
- Successful advertising campaigns.
- Effective product or service management.
- Efficient human resources management.
- Strong cash flow management.
- Revenue growth and profit management.
- Optimal utilization of operating capacity.
- Robust distribution channels.
- Low-cost production structure.
- Strong technology capabilities.
- Proximity to customers.
- Business sustainability.
Summary
Industry analysis is a systematic process helping companies understand their status relative to competitors. It involves gathering and analyzing information about global and domestic industries, considering economic, social, political, and technological factors. Understanding industry forces enables strategic planning and empowers small businesses to recognize threats, focus on opportunities, and develop unique capabilities for a competitive advantage. Popular theorist Porter's five forces aid in efficient industry analysis, facilitating companies in gaining a competitive edge.
Concept of Value Chain
- In the fast-paced business world, companies strive to provide top-notch products for lasting competitiveness. To achieve success, companies need to not only keep up with but surpass their competitors, understanding and meeting customer needs and expectations. Strategic analysis assists companies in honing their plans to gain a competitive edge.
- Value chain analysis, a strategic management accounting tool, gauges the significance of customer-perceived value. By assessing the pros and cons of a company's activities and value-creating processes in the market, value chain analysis helps evaluate its competitive advantages.
- Value chain analysis provides a systematic view of organizations, depicting stages in the transformation process with inputs and outputs. It focuses on the idea that companies do best when they operate in areas where they have an advantage over competitors. Companies need to figure out where they can offer the best value to their customers.
Introduction by Michael Porter:
- Michael Porter introduced the concept of the value chain in his book "Competitive Advantage: Creating and Sustaining Superior Performance" in 1995.
- The value chain, representing value added, helps build a sustainable competitive advantage for organizations in the 21st century.
- All organizations have activities forming a value chain, including purchasing, manufacturing, distribution, and marketing.
Purpose of Value Chain Framework:
- The value chain framework is a powerful tool for strategic planning in organizations for almost two decades.
- It aims to maximize value creation while minimizing costs, considering cost as a value that contributes to a company's wealth.
Porter's Perspective:
- Porter views a company's value chain as a reflection of its history, strategy, strategy implementation approach, and the underlying economics of activities.
- The value chain involves internal processes like design, production, sales, delivery, and support of products.
- Cost is seen as contributing to company wealth, not just an expense in profit and loss accounting.
Fundamental Purpose and Analysis:
- Fundamentally, the value chain framework breaks down business functions into strategically relevant activities that add value to products and services.
- Value chain analysis helps understand cost behavior and sources of differentiation.
- Porter argued that a business can gain a sustainable competitive advantage based on cost, differentiation, or a combination of both.
Shank and Govindarajan (1993)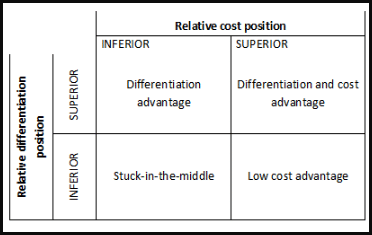
Understanding Value Chain Analysis:
- Value chain analysis involves identifying steps in a company's production process to eliminate or improve, resulting in cost savings or increased productivity.
- The focus is on providing customers with the best product value at the lowest cost, benefiting the company in the long term.
Concept of Value Chain:
- The value chain concept views organizations as systems with inputs, transformation processes, and outputs.
- It aims to measure the value and profit contributed by each link in the chain, starting from raw material acquisition to product distribution to consumers.
Primary and Support Activities:
- Organizations engage in primary activities directly involved in transforming materials into finished goods, including inbound logistics, operations, outbound logistics, marketing and sales, and service.
- Support activities facilitate primary activities and include procurement, human resource management, technological development, and company infrastructure.
Value Chain Analysis Components:
- Value chain analysis considers both the industry value chain, encompassing all industry activities from raw material to after-sales service, and the company's internal value chain.
- Analysts gather information from sources like annual reports, company websites, competitor analysis, SWOT analysis, journal articles, and trade publications to understand how value is created and which activities contribute most to profitability.
Information Gathering for Analysis:
- Analysts study annual reports over several years to track changes in activity costs and alignment with competitive strategy.
- Comparing company and competitor websites provides insights into core competencies.
- SWOT analysis and industry publications help identify key strengths, weaknesses, and value-generating activities in the industry.
Implementation of Value Chain Analysis
- Activity Analysis: Identify the steps involved in processing a product or service.
- Value Analysis: Figure out what customers value in each activity and calculate changes based on relevant cost factors.
- Evaluation and Planning: Decide on changes to make and plan how to implement them.
Importance of Value Chain Approach:
- Organizations focus on creating products or services, with some recognizing the strategic importance of specific activities in their value chain.
- The value chain approach helps companies understand and concentrate on activities that bring the most value to customers, giving them a competitive advantage.
Analysis for Competitive Advantage:
- Internal Cost Analysis: Identify sources of profitability and relative cost positions of internal processes.
- Internal Differentiation Analysis: Understand sources of differentiation, including costs, within internal processes.
- Vertical Linkage Analysis: Understand relationships and associated costs with external suppliers and customers to maximize value and minimize cost.
Steps in Internal Cost Analysis:
- Identify value-creating processes.
- Determine the portion of total product or service cost for each process.
- Identify cost drivers for each process.
- Identify links between processes.
- Evaluate opportunities for achieving relative cost advantage.
Adopting a Process Perspective:
- De-emphasize functional structures and focus on identifying value-creating processes.
- A horizontal view of the organization, starting from product inputs to outputs and customers.
Value Chain and Competitive Advantage:
- Suppliers and channels have their own value chains, influencing a firm's performance.
- Firms must understand their role in the buyer's value chain to achieve competitive advantage.
- The ultimate basis for differentiation is understanding the firm's value chain and how it fits into the overall value system.
Value Chain And Competitive Advantage (David Barnes, 2001)
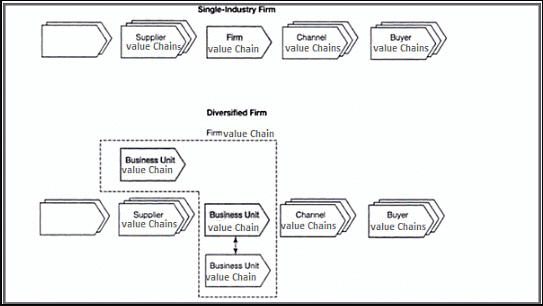
Benefits of Value Chain Analysis
Understanding Value Chain Analysis:
- The value chain connects a series of activities from suppliers to customers, aiming to perform these activities more efficiently and at a lower cost than competitors.
- The focus is on the customer's perspective, extending from materials input to after-sales services and support activities like procurement and human resources management.
Benefits of Value Chain Analysis for Online Learning Organizations:
- Helps identify linkages between value activities within the organization, focusing on processes rather than functions or departments.
- Supports the identification of strategic alliances within the industry value system.
- Enables managers to pinpoint cost drivers and optimize returns throughout the value chain.
- Provides insights into cost management problems, helping avoid missed opportunities.
Drawbacks of Value Chain Analysis:
- Availability of Data: Limited access to multiple-period data for long-term decision-making.
- Ascertainment of Revenues, Costs, and Assets: Difficulty in identifying appropriate data for each value chain activity.
- Identification of Cost Drivers: Challenges in isolating cost drivers and computing supplier and customer profit margins.
- Identification of Stages: Difficulty in breaking down value stages and diagnosing abilities at various stages.
- Opposition from Employees: Resistance from employees due to the newness and complexity of the concept.
Usefulness of Value Chain Analysis:
- Integrates external and internal data to conduct activities more efficiently and outperform competitors.
- Involves strategic partners like suppliers and customers.
- Helps determine competitive advantage and develop strategies accordingly.
- Provides clarity about organizational strengths and weaknesses, making it a popular framework for analysis and competitive advantage development.
Tools and techniques for strategic analysis: GEC Mode
- Overview: The General Electric Matrix is a tool used to assess competitive scenarios.
- Purpose: It helps managers develop organizational strategy based on market attractiveness and business strengths.
Development of the GE-McKinsey Nine-Box Matrix
- Origin: McKinsey and Company developed it in the 1970s during consulting engagements with General Electric.
- Objective: It's a systematic approach for multi-business corporations to prioritize investments among their business units.
- Structure: It consists of a 3x3 grid with Market Attractiveness and Business Strength as axes, each measured on a high, medium, or low scale.
- Steps: Five key steps are involved in formulating the matrix.
Market Attractiveness
- Definition: It refers to how beneficial a market is for a company to enter and compete.Factors: Several factors contribute to market attractiveness, such as Industry size, Growth rate, Profitability, Competition intensity, and Distribution structure.
- Understanding the GE Matrix: It's a tool used to analyze competition and plan strategies based on market attractiveness and business strengths.
- Origin of the GE-McKinsey Nine-Box Matrix: Developed by McKinsey in collaboration with General Electric, it helps companies prioritize investments among different business units.
- Structure of the Matrix: It's set up as a 3x3 grid with two main factors - Market Attractiveness and Business Strength - each rated as high, medium, or low.Market Attractiveness: This refers to how good a market is for a company to enter and compete, influenced by factors like size, growth rate, profitability, and competition level.
Business and Competitive Strength
This aspect helps decide if a company can compete well in its markets.
It includes factors like the company's assets, market share, brand position, customer loyalty, ability to innovate, and handling of market changes and environmental/government concerns.
Factors Affecting Business Strength include asset strength, brand power, market share, and customer loyalty.
Measuring Market Attractiveness and Business Strength
Each factor is given a rating and magnitude.
A calculation is done by multiplying the rating of each factor by its magnitude.
This helps evaluate how attractive the market is and how strong the business is.
Plotting
Plotting SBUs (Strategic Business Units):
- SBUs are represented as circles.
- The circle's size shows the market's magnitude.
- A pie chart inside the circle represents the SBU's market share.
- An arrow outside the circle shows the expected future position of the SBU.
GE Matrix Model
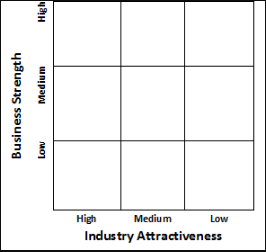
Comparing GE McKinsey Matrix with BCG Matrix:
- GE McKinsey Matrix and BCG Matrix both analyze a company's product or business unit portfolio.
- GE McKinsey Matrix has nine cells while BCG Matrix has four.
- GE McKinsey Matrix is more detailed and flexible.
- It assesses factors beyond market share, unlike BCG Matrix.
- It helps companies plan their strategies by predicting the position of businesses/products in the market.
GE Matrix: Market attractiveness competitive position- portfolio classification and strategies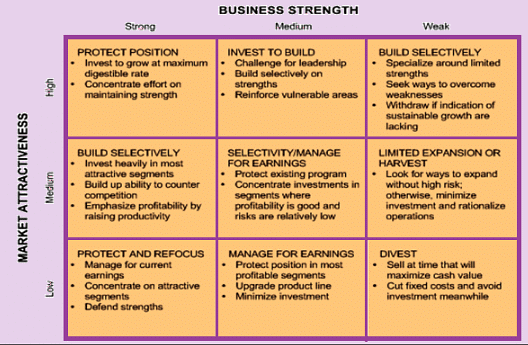
Advantages of the GE McKinsey Matrix
More Comprehensive:
- It uses 9 cells compared to the BCG Matrix, which only has 4 cells.
- Considers various factors, avoiding oversimplified conclusions.
- Provides a sophisticated framework for analyzing business portfolios.
Flexible Classification:
- Offers classifications like high/medium/low and strong/average/low, providing better portfolio distinctions.
- Allows users to select criteria based on their specific needs.
Disadvantages of the GE McKinsey Matrix
Consultant Dependency:
- Requires experts to assess industry attractiveness and business unit strength accurately, making it costly to implement.
Economic Assumptions:
- Relies on economies of scale in production and distribution, limiting its applicability in certain scenarios.
Neglects Core Competencies:
- Doesn't account for a company's core capabilities, which could be crucial for competitive strength across SBUs.
Complexity and Scalability Issues:
- Can become complicated and unwieldy with increasing business units.
- Struggles to depict the positions of new units in emerging markets effectively.
Summary
The GE McKinsey Matrix helps evaluate the capabilities of a company's Strategic Business Units (SBUs) but has drawbacks like complexity, dependency on consultants, and limitations in representing emerging markets.
FAQs on Tools and Techniques for Strategic Analysis - Management Optional Notes for UPSC
| 1. What is the Impact Matrix? |  |
| 2. What is the Experience Curve? |  |
| 3. What is the BCG Matrix? |  |
| 4. What is Industry Analysis? |  |
| 5. What is the Concept of Value Chain? |  |


