Volume-Cost-Profit Relationship as a tool of Profit Planning | Commerce & Accountancy Optional Notes for UPSC PDF Download
| Table of contents |

|
| Introduction |

|
| What is CVP analysis? |

|
| Examples |

|
| Profit Graph |

|
| Cost Segregation |

|
| Marginal Cost and Contribution |

|
| Conclusion |

|
Introduction
Managers frequently make decisions involving considerations of selling prices, variable costs, and fixed costs as part of their planning responsibilities, relying on predictions about costs and revenues. Almost every question posed in this context has a "cost-profit" aspect. According to Horngren (1985, p43), cost-volume-profit analysis is inherently appealing to most management students because it offers a broad overview of the planning process and serves as a tangible example of the significance of understanding cost behavior—the way costs respond to various influences. If you are inclined to explore the planning process and comprehend cost behavior, you are likely to find the study of cost-volume-profit relationships immediately engaging.
What is CVP analysis?
- Cost-Volume-Profit (CVP) analysis aims to evaluate the impact of changes in volume, cost, price, and product mix on profits. It is evident that these variables are interconnected, and each is influenced by various internal and external factors. For example, costs can be influenced by factors such as the choice of plant, scale of operations, technology, workforce efficiency, management efficiency, and market forces affecting externally purchased inputs. While numerous factors play a role in influencing costs and profits, the volume of output stands out as the most significant variable affecting them in the short run.
- Consequently, the CVP relationship becomes crucial for managers making short-run decisions on aspects like product profitability, the impact of selling price reductions on profits, the effect of volume or product mix changes on costs and profits, determination of the break-even point with changing volume and costs, understanding the impact of increased wages and operating expenses on profit, and assessing the effects of plant expansion on costs, profit, and sales volume. In addressing these questions, a cost-benefit framework is essential, and CVP analysis provides the methodology to accomplish it.
- In essence, CVP analysis can be seen as one of the decision models that managers utilize to make choices among alternative courses of action.
The fundamental (simplified) CVP model can be outlined as follows:
- You may now be getting ready to comprehend the CVP concept. You will observe that profits are a function of the interplay of costs, prices, and each one of them is relevant to profit planning. The variance between actual and budgeted profit arises due to one or more of the following factors: selling price, volume of sales, variable costs, and fixed costs.
- You will also appreciate that these four factors, which cause deviations in planned profits, differ from each other in terms of controllability by management. It is evident that selling prices largely depend upon external forces. Costs, of course, are more controllable. But they pose a problem of measurement. This is more so when a firm manufactures two or more products. Nevertheless, knowledge of fixed and variable costs is essential if costs are to be controlled. Consider a tenuous cost - volume-profit transit.
- “Sales price change □ volume change □ unit cost change □ profit structure change.”
- You may try an answer to the question: How will costs change in the future situation? Would you succeed? Probably, not quite so at this stage! But the CVP decision model will, of course, have an answer within its assumptive framework.
Interplay and Impact of factors on profit
We have said above that costs and volume do influence profit. You will observe more objectively the extent and nature of this impact with the help of an illustration. It is proposed to evaluate the effect of
- Price changes on net profit,
- volume changes on net profit,
- price and volume changes on net profit,
- an increase or decrease in variable costs on net profit,
- an increase or decrease in fixed costs on net profit,
- all four factors viz., price, volume, variable costs, and fixed costs on net profit.
Examples
Illustration 9.1: The following assumptions are made in the illustration: normal sales volume is 2,00,000 units at a selling price of Rs. 2 per unit; capital investment is Rs. 2,00,000, and management expects to earn a fair return on it: fixed costs are Rs. 1,60,000; variable expenses are Re. 1 per unit.
Solutions for the three situations are tabulated separately. The control column of each table shows normal volume, and a decrease in volume/price by 10% and 20% is shown on the left, while an increase in volume/price by the same percentages is shown on the right of the „central column‟. Calculations show net profit or loss for each set of conditions and the net profit per unit, the percentage return of investment, and the break-even point.
Influence of price changes on Net Profit.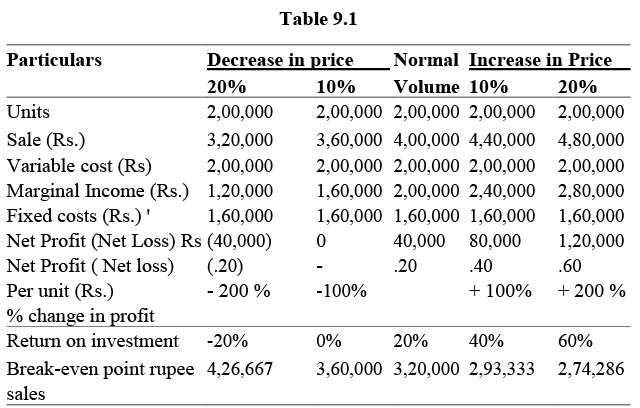 You may note the following from the above situation: (a) a 10% decrease in price reduces profit to zero, while a 10% increase in price increases profits by 100%.
(b) with lower selling prices and a constant volume, the break-even point increases.
This happens because a reduction in sales revenue due to decrease in sales price reduces the marginal income (contribution). A much greater number of units have to be sold in order to recover the fixed costs. Influence of volume changes on Net Profit.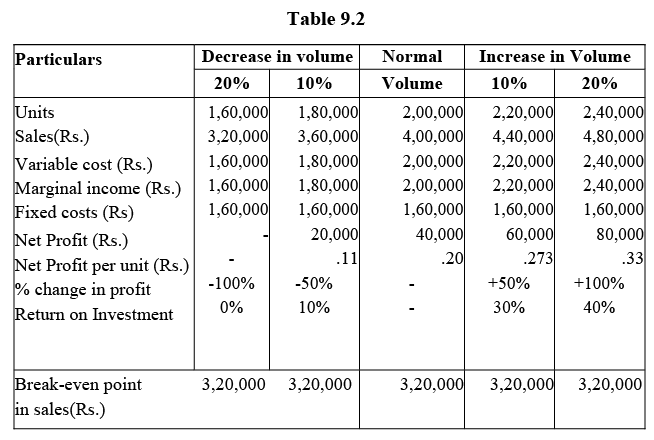 You may note here the following: (a) a 20% decrease in volume reduces sales to the break-even point, which remains constant because variable costs change in proportion to sales. (b) a 20% increase in volume improves profit by 100%. A similar increase in price (viz., by 20%) increases profit by 200% (see above).
Influence of changes in prices and volume on Net Profit.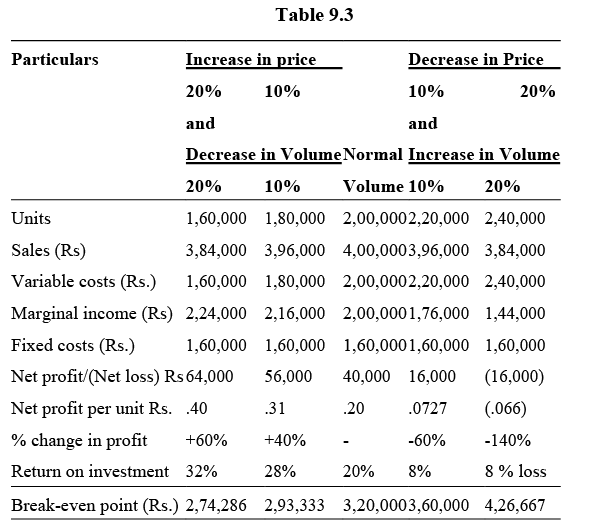 Please note in this situation that (a) the price increase, as assumed, would result in higher profits, even if it is accompanied by a decrease in volume of the same order. The reverse, however, is true of a price decrease accompanied by a volume increase.
(b) the break-even point would be at its lowest when prices are increased and volume is decreased because higher rupee volume with lower unit volume reduces the variable cost ratio.
Profit Graph
- A business firm typically pursues the objective of maximizing profits, and both its operational and overall plans are framed with this profit objective in mind. The key variables in these plans are cost, volume, and profit forecasts for the planning period. The volume of sales forecast is a crucial variable around which cost and profit estimates are developed.
- During the planning stage, managers often face the question of how changes in the forecasted level of sales would impact profits. Given the dynamic nature of conditions, managers seek guidance to address such questions. The profit graph, illustrating the relationship between profit and volume (P/V relationship), offers valuable insights and potential answers to these queries.
- In previous calculations regarding the impact of changes in price, volume, etc., on profit, a term called 'marginal income' was derived (refer to item number 4 in Tables 9.1, 9.2, and 9.3). Marginal income represents the difference between sales and variable expenses, signifying the total contribution to fixed expenses and profit. Alternatively, if variable expenses are expressed as a percentage of sales, the variable cost ratio is obtained. The total contribution or marginal income is then equal to "1 - variable cost ratio." In the scenarios presented in Section 9.3, the variable cost ratio for the normal volume of sales is 50% or 0.50. Therefore, the total contribution or marginal income is 1 - 0.50 = 0.50 or 50%. Another term for 'marginal income' is the P/V ratio, indicating the profit-volume ratio. Importantly, the P/V ratio is not calculated by dividing sales volume by profit, but rather by subtracting the variable cost ratio from unity (1).

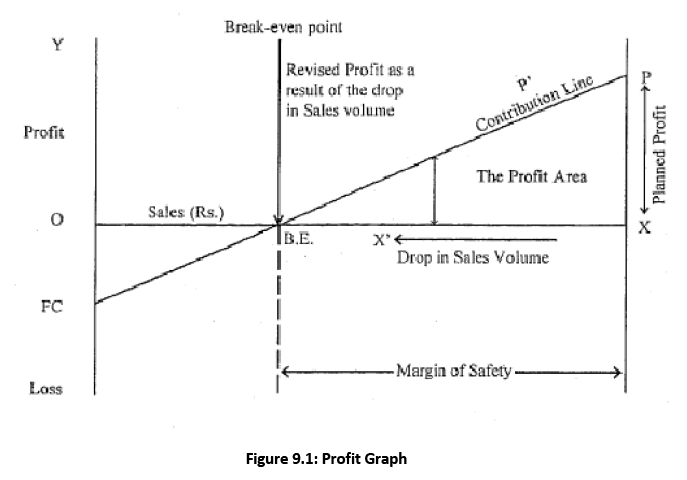
- Having clarified the main objective of the profit graph and understanding some essential variables, you can now explore a hypothetical profit graph to grasp the underlying relationships. Figure 9.1 presents this graph. We will elucidate the construction of the graph and then outline the assumptions behind it in the next section. The X-axis (OX) represents sales volume, and the Y-axis (OY) depicts profit above 0 and loss below 0. OFC denotes fixed costs, and the line FCP connects two points – FC (fixed cost) and P (expected profit) as per the profit-volume plan. The area enclosed by XBE represents the margin of safety, with BE being the break-even point. BEPX signifies the profit area, and the line FCBEP represents the total contribution or the PV line. If the sales volume deviates from the planned point X and drops to X', the profit zone will shrink to a new profit area BEX'. Further decreases in sales volume will be accommodated by the margin of safety, after which losses will become evident. These points will be further clarified in subsequent sections.
Assumptions in Profit Graph
Upon encountering the Profit Graph, you may have developed some inquiries, such as questioning how the total contribution line maintains its straightness when variable costs per unit fluctuate or when operational efficiency improves within the planned activity range. Your concerns are valid.
As previously mentioned, the Cost-Volume-Profit (CVP) model serves as a decision model, and like many such models, it relies on simplifying assumptions to make the underlying analysis more comprehensible, even if somewhat unrealistic.
Consider the following assumptions, which play a significant role:
a) Variable costs remain constant on a per-unit basis. This implies that the variable cost rate remains consistent, even if total variable costs increase proportionally with an escalation in output volume or sales.
b) Total fixed costs remain unchanged within the planned activity range.
c) Operational efficiency remains constant throughout the planned activity range.
d) All costs, including semi-variable and mixed costs, can be segregated into fixed and variable elements.
e) Selling prices per unit of sale remain stable.
f) The sales mix for a multi-product firm remains steady.
g) Volume is the sole factor influencing costs.
h) Factor prices, such as material prices and wage rates, remain unaltered.
i) Costs and revenue are compared based on a single activity base, like the sales value of output or units produced. Moreover, stock levels will not experience significant variations during the plan's covered period.
j) Fluctuations in opening and closing inventories are negligible. The crucial implications are that there exists a relevant range of activity where cost behavior is linear, all prices remain unaltered, and costs can be categorized into fixed and variable costs.
Cost Segregation
To categorize costs into two primary groups—fixed and variable—certain general guidelines can be proposed, as outlined below:
a) Costs that remain constant regardless of the volume of activity are deemed fixed. It's crucial to note that no costs remain fixed indefinitely, and this concept is relative to the planning horizon, typically in the short run, and the relevant activity range.
b) Costs that fluctuate in direct proportion to the volume of activity are designated as variable costs.
c) Costs falling into a mixed category—those that don't neatly align with either category (a) or (b)—would be allocated to either fixed or variable categories. If a mixed cost exhibits variability, albeit not directly proportional to output or activity volume, it would be classified as a variable cost. Conversely, if a mixed cost is primarily associated with fixed characteristics, it would be categorized as a fixed cost.
Methods to segregate costs
Various methods of segregating semi-variable costs into fixed and variable elements were discussed. Here, we repeat two statistical techniques which may be employed to separate fixed costs and variables costs.
- Least-squares
- Scatter Diagram
We illustrate these methods.
Least Squares: Power charges are a semi-variable or a mixed cost of Ravalli Ltd. It is proposed to segregate them into fixed and variable components using the method of least squares.
Monthly data regarding direct labour hours and electricity charges are given below: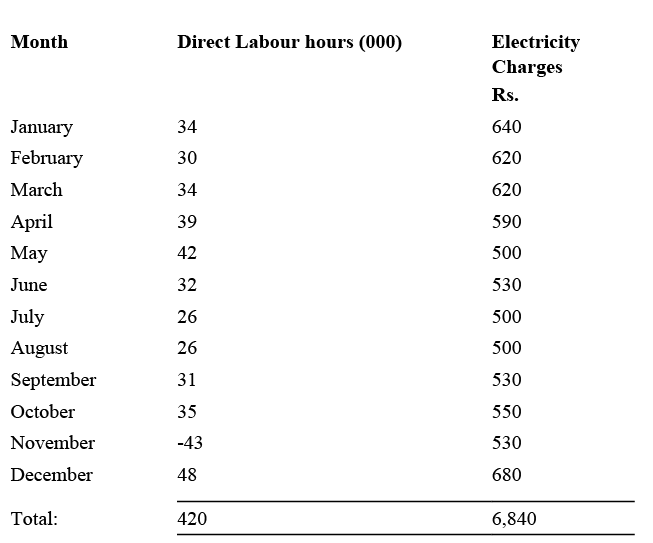
The following calculations are made for the variable rate and the fixed element of electricity charges:
Where Y is the dependent variable, x is the independent variable (i.e., direct labour hours in the example), a is the constant i.e., the fixed cost element to be solved, and b is the slope of the regression line i.e., the variable cost per unit.
Calculation of Fixed and Variable Elements: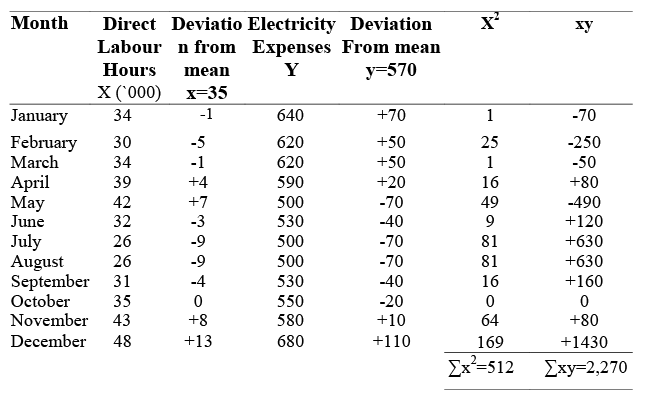

Fixed element of electricity charges ‘a’ can be found out by substituting values in the equation, a + bx, where
Y=570
X = 35,000 labour hours
we get: Rs. 570 = a + .0044 (35000)
Rs. 570 = a + Rs. 154 Rs. 570 - Rs: 154 = a Rs. 416 = a (the fixed element)
Scatter Diagram: The regression equation calculated above may be fitted by freehand on a diagram where direct labour hours are plotted on the X-axis and electricity charges are plotted on the Y-axis. There will be 12 points scattered within the quadrant space of the graph. A line may be made to pass through these points so that there is roughly an equal member of points above and below the line. The vertical intercept of the regression line thus drawn (i.e., the point at which the line intersects the Y-axis ) will measure the fixed element of the electricity charges.
The slope of the regression line may be found to ascertain the variable rate per 100 labour hours. Alternatively, the fixed expense as given by the vertical intercept may be multiplied by 12 to get the annual fixed expenses on electricity. This may be deducted from the total electricity charges of Rs.6,840. The balance may be divided by the total annual labour hours viz. 4,20,000 hr. and that quotient would be the approximate rate per labour hour.
Marginal Cost and Contribution
- Once fixed and variable costs are separated, it becomes feasible to compute both the total contribution and total contribution per unit. Total contribution is the difference between sales and variable (marginal) costs. Total contribution per unit is expressed on a per-unit basis by dividing both sales and variable costs by the total number of units and subtracting per-unit variable cost from per-unit selling price. Alternatively, total contribution may be directly divided by the total number of units to yield similar results.
- It is important to recall that total contribution represents the contribution of sales revenue to fixed cost recovery and profit after covering the total variable costs. Additionally, total contribution can be expressed as a percentage known as the P/V ratio, which is the "1-variable cost" ratio. The variable cost ratio is calculated by dividing sales by total variable cost.
- Understanding the Profit Graph presented earlier, you may now comprehend how the contribution line was plotted. The contribution line is derived by plotting contribution per unit figures against various levels of sales values. When examining the Profit Graph, observe that the contribution line starts from the loss zone, rises to the break-even point (BE) on the sales volume line, and this part of the contribution line up to BE indicates the recovery of fixed costs. Only after this point does the contribution line merge with the X-axis and the right Y-axis, forming a triangle (PXBE) marked as the profit area.
Break-even Point
We had earlier stated that the break-even point is not all that is contained in the CVP analysis. It is only incidental to such an analysis. You have already seen that the break-even point is just one point on the whole journey of the contribution line as it transits from the fixed cost point F to the profit point P via the sales revenue line viz, the X-axis. The horizontal intercept of the contribution line at BE is the break-even point. At this point, total costs and total revenues are held in equilibrium and a no-profit no loss position emerges.
Margin of Safety
While revealing the estimated profit or loss at different levels of activity, the Profit Graph also suggests the magnitude by which the planned activity level can fall before a loss is experienced. This is known as the Margin of Safety and is obtained by deducting the break-even sales from the planned sales.
A graphical glimpse into cost-volume-profit structures: Two cases of companies A and B are presented. You may examine the sales and total cost lines and offer your comments. You should note the differences between these graphs and the profit graph presented earlier.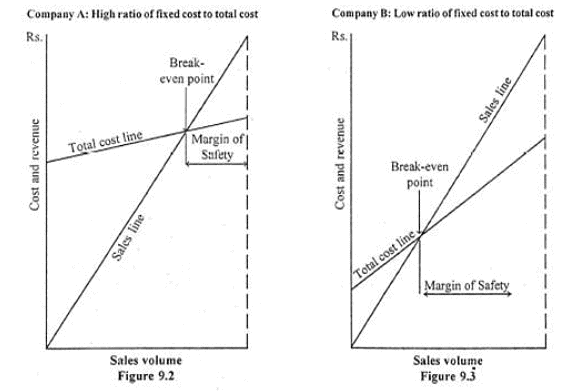
A significant difference between companies A and B is in terms of the location and slope of their respective total cost line. Company A has a high ratio of fixed cost to total cost because the vertical intercept of its total cost line is very high. In contrast, company B’s vertical intercept is quite low and it has a low ratio of fixed costs to total costs accordingly.
The following results follow:
a) Once the break-even point is reached for company A, large profits are made quickly as volume rises. The profit growth for the company is slower after this break-even point.
b) Company B, however, has larger Margin of Safety than company A and can, therefore, sustain difficult business spells without immediately cutting down on its level of activity. Company A cannot hazard a similar course and may have to shut down much earlier.
Break-even Chart
- You will appreciate the break-even analysis is a transitional stage of CVP analysis. Many authors discuss the interchangeability of these two because the derivation of break-even analysis from CVP analysis is very subtle.
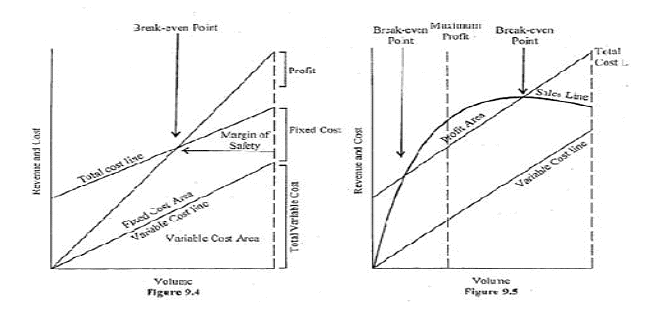
- The break-even chart also emerges from the Profit Graph, but the total cost replaces the contribution line. The new relationships which must receive attention in the wake of this major change, viz., replacement of the contribution line by the total cost line, are presented in the two graphs below:

Figure 9.4 provides an idea of a conventional break-even chart. Figure 9.5, however, depicts a situation where sales revenue may have declined as a result of lowering selling prices to liquidate a higher volume of goods, and the company moves into a situation where loss is incurred. The point of maximum profit is also shown on the graph.
Purpose of Break-even Charts
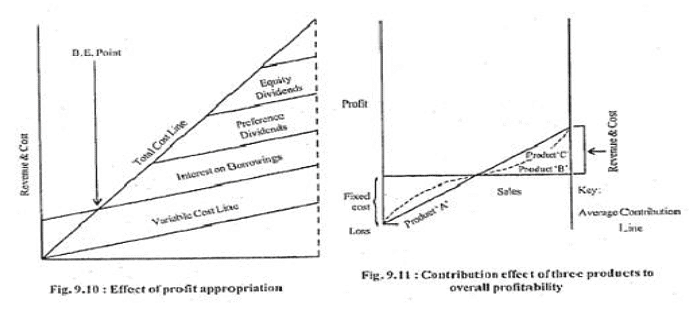
The figures presented in this sub-section provide a glimpse of the uses to which break-even analysis can be put. The objective is to offer a visual comprehension of a few illustrative situations. This will hopefully make the mathematical section more comprehensible.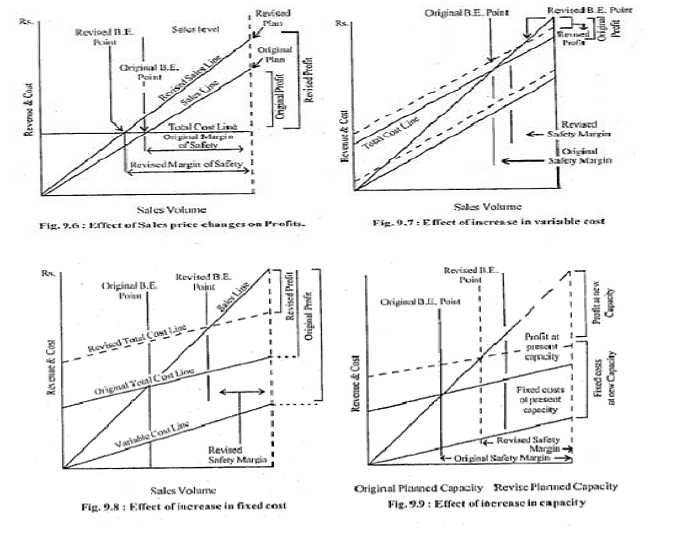
CVP and Break-even Analysis: A resume
This concluding section of the unit presents the CVP relationship and breakeven application in the form of mathematical formulations.
The following abbreviations are used:
FC = Fixed Cost C = Contribution P = Profit S = Sales
P/V ratio = profit-volume ratio
BE point = Break-even point
MS = Margin of Safety
VC = Total Variable Cost
1) FC = C- P or alternatively (P/V ratio x S)-P
2) C = FC + P or alternatively P/V ratio xS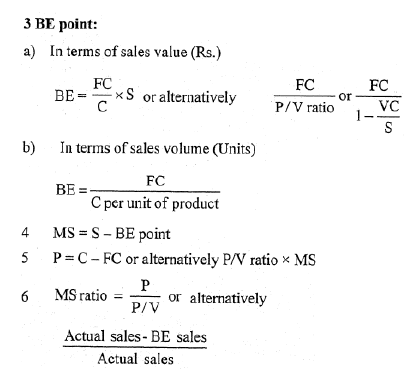
Applications of CVP Formulae
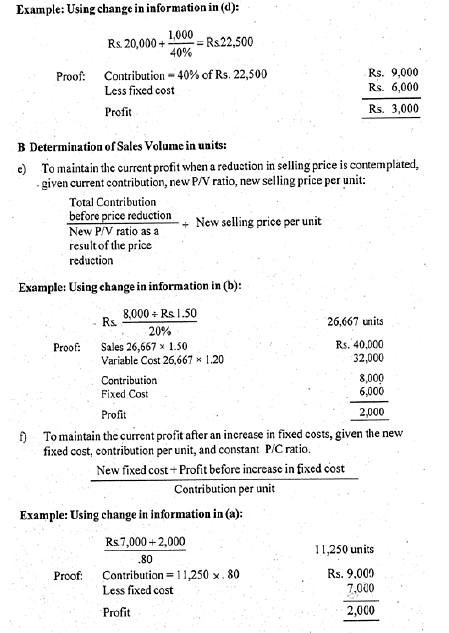
A. Determination of the level of sales (Rs.)
(a) To achieve a given profit when fixed cost and P/V ratio are known:
(b) To maintain the current profit after an increase in fixed cost when the new fixed cost and original P/V ratio are known: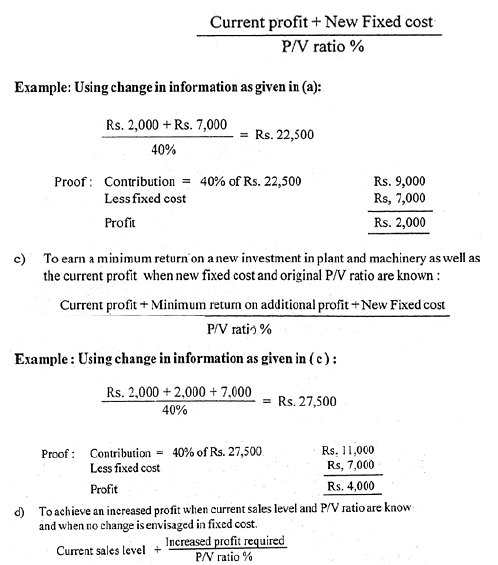
Conclusion
Cost-Volume-Profit (CVP) analysis serves as a framework to assess the impact of volume changes on short-term profits. By incorporating cost behavior as a dimension, one can observe corresponding variations in profit, break-even point, and margin of safety.
Break-even analysis is an inherent component of CVP analysis, albeit the former is considered coincidental to the latter. CVP analysis is employed as a planning tool, forming the basis for profit plans. Numerous managerial decisions rely on this crucial analytical tool, including choices related to distribution channels, external contracting, sales promotion expenditures, and pricing strategies.
The traditional break-even chart is founded on various assumptions, with key ones being the "planned range of activity," the consideration of the "short run," and the assumption of the "linearity of cost functions."
Several insightful conclusions can be drawn from CVP and break-even analysis. Notably:
(a) A company with a high proportion of fixed costs to total costs will have a high break-even point, with the potential for substantial profits once this point is surpassed.
(b) Conversely, a company with a low proportion of fixed costs to total costs possesses greater flexibility for profitable operations.
(c) An increase in sales prices reduces the break-even point and raises the margin of safety.
(d) Conversely, an increase in costs elevates the break-even point and diminishes the profit margin.
|
180 videos|153 docs
|
FAQs on Volume-Cost-Profit Relationship as a tool of Profit Planning - Commerce & Accountancy Optional Notes for UPSC
| 1. What is CVP analysis? |  |
| 2. How does CVP analysis help in profit planning? |  |
| 3. Can you provide an example of CVP analysis in action? |  |
| 4. How does CVP analysis help in decision-making? |  |
| 5. What is the difference between marginal cost and contribution margin in CVP analysis? |  |
|
180 videos|153 docs
|

|
Explore Courses for UPSC exam
|

|

