Class 3 Exam  >  Class 3 Notes  >  Mathematics for Class 3: NCERT  >  Worksheet: Smart Charts - 2

Worksheet: Smart Charts - 2 | Mathematics for Class 3: NCERT PDF Download

Q1: Krishna collected the data on chocolates that need to be donated to an orphanage from his class and represented them in tabular form.
Data of chocolates: Five star-25, Dairy milk-16, Ferrero Rocher-37, Hershey-48, Toblerone -56.

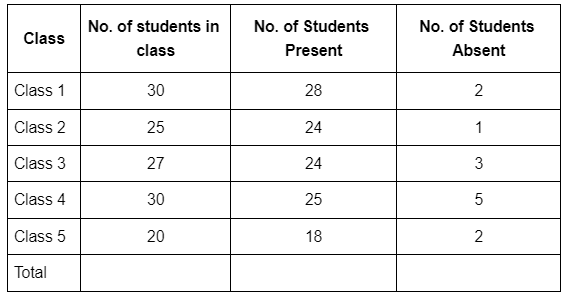
Q2: The below board shows the number of students in each class. It also shows the number of students present and absent.
Attendance Board of 21-Mar-2022
Worksheet: Smart Charts - 2 | Mathematics for Class 3: NCERT

Q3: Kanika bought 10 chocolates, 8 packets of biscuits, 3 bottles of juice, 4 packets of fruit cake and 12 toffees and represented the data using tally marks.

Q4: Doctor Ranjan suggested Krish's grandmother eat as many apples as she can because she is weak for at least for 6months. Dr Ranjan also suggested Krish note the no. of apples eaten by her grandmother every month for around 6 months to track her data.

Q5: Surya conducted a Survey on how many people consider the below fruits as their favourite fruit: Bananas, Apples, Mangoes, Grapes and Oranges. In the survey, he got the data as mango -20, apple -60, grapes-80, bananas-100 and oranges-45. Represent the above data in both vertical and horizontal bar graphs.

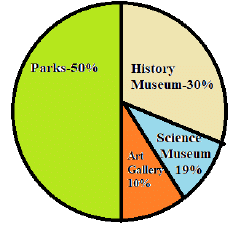
Q6: The given pie chart represents the data of students who want to visit different places. Observe the given pie charts and calculate what percentages of students want to visit museums?
Worksheet: Smart Charts - 2 | Mathematics for Class 3: NCERT


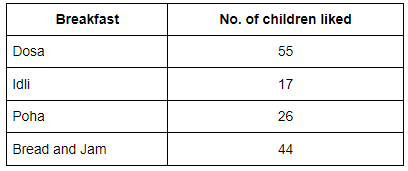
Q7: Given the following table shows the most liked breakfast for children.
Answer the following questions on its basis:
(i) Which is the most liked breakfast?
(ii) Which is the least liked breakfast?
(iii) How many children liked both dosa and Idli?
(iv) How many children liked only Bread and Jam?
Worksheet: Smart Charts - 2 | Mathematics for Class 3: NCERT

The document Worksheet: Smart Charts - 2 | Mathematics for Class 3: NCERT is a part of the Class 3 Course Mathematics for Class 3: NCERT.
All you need of Class 3 at this link: Class 3
39 videos|119 docs|58 tests

Top Courses for Class 3

FAQs on Worksheet: Smart Charts - 2 - Mathematics for Class 3: NCERT

1. What are smart charts?
Ans. Smart charts are visual representations of data that use advanced technology and data analysis techniques to provide real-time insights and help in decision-making. They can be interactive and customizable, allowing users to drill down into specific data points and view different perspectives.
2. How are smart charts different from traditional charts?
Ans. Smart charts differ from traditional charts in that they incorporate advanced features such as real-time data updates, interactive elements, and predictive analytics. Traditional charts are static and provide a snapshot of data at a specific point in time, while smart charts provide dynamic and actionable insights.
3. What are the benefits of using smart charts?
Ans. Using smart charts offers several benefits. They help in identifying trends, patterns, and correlations within data, enabling better decision-making. Smart charts also provide real-time updates, allowing users to stay informed about the latest information. Additionally, they can be customized to suit specific needs and provide insights into complex data sets.
4. How can smart charts be used in business?
Ans. Smart charts have numerous applications in business. They can be used for financial analysis, sales forecasting, market research, and performance tracking. By visualizing data in a clear and interactive manner, smart charts help businesses identify areas of improvement, make informed decisions, and communicate insights effectively.
5. Are smart charts accessible to users with limited technical skills?
Ans. Yes, smart charts can be designed to be user-friendly and accessible to users with limited technical skills. Many smart chart tools provide intuitive interfaces, drag-and-drop functionality, and pre-built templates that make it easy for non-technical users to create and interact with charts. Additionally, online resources and training materials are available to help users learn and maximize the potential of smart charts.
39 videos|119 docs|58 tests
Download as PDF
Explore Courses for Class 3 exam

Top Courses for Class 3

Signup for Free!
Signup to see your scores go up within 7 days! Learn & Practice with 1000+ FREE Notes, Videos & Tests.
10M+ students study on EduRev
Related Searches

Summary

,

Free

,

ppt

,

Important questions

,

shortcuts and tricks

,

Worksheet: Smart Charts - 2 | Mathematics for Class 3: NCERT

,

Worksheet: Smart Charts - 2 | Mathematics for Class 3: NCERT

,

mock tests for examination

,

past year papers

,

Objective type Questions

,

practice quizzes

,

video lectures

,

Sample Paper

,

Viva Questions

,

Previous Year Questions with Solutions

,

MCQs

,

Worksheet: Smart Charts - 2 | Mathematics for Class 3: NCERT

,

pdf

,

Semester Notes

,

Extra Questions

,

Exam

,

study material

;