Statistics Class 10 Worksheet Maths Chapter 13

Multiple Choice Questions
1. If x1, x2, x3,….., xn are the observations of a given data. Then the mean of the observations will be:
(a) Sum of observations/Total number of observations
(b) Total number of observations/Sum of observations
(c) Sum of observations +Total number of observations
(d) None of the above
Ans: (a)
Sol: The mean or average of observations will be equal to the ratio of sum of observations and total number of observations.
xmean=x1+x2+x3+…..+xn/n
Q2: If the mean of frequency distribution is 7.5 and ∑fi xi = 120 + 3k, ∑fi = 30, then k is equal to:
(a) 40
(b) 35
(c) 50
(d) 45
Ans: (b)
Sol: As per the given question,
Xmean = ∑fi xi /∑fi
7.5 = (120+3k)/30
225 = 120+3k
3k = 225-120
3k= 105
k=35
Q3: The mode and mean is given by 7 and 8, respectively. Then the median is:
(a) 1/13
(b) 13/3
(c) 23/3
(d) 33
Ans: (c)
Sol: Using Empirical formula,
Mode = 3Median – 2 Mean
3Median = Mode + 2Mean
Median = (Mode + 2Mean)/3
Median = [7 + 2(8)]/3 = (7 + 16)/3 = 23/3
Q4: The mean of the data: 4, 10, 5, 9, 12 is;
(a) 8
(b) 10
(c) 9
(d) 15
Ans: (a)
Sol: mean = (4 + 10 + 5 + 9 + 12)/5 = 40/5 = 8
Q5: The median of the data 13, 15, 16, 17, 19, 20 is:
(a) 30/2
(b) 31/2
(c) 33/2
(d) 35/2
Ans: (c)
Sol: For the given data, there are two middle terms, 16 and 17.
Hence, median = (16 + 17)/2 = 33/2
Q6: If the mean of first n natural numbers is 3n/5, then the value of n is:
(a) 3
(b) 4
(c) 5
(d) 6
Ans: (c)
Sol: Sum of natural numbers = n(n + 1)/2
Given, mean = 3n/5
Mean = sum of natural numbers/n
3n/5 = n(n + 1)/2n
3n/5 = (n + 1)/2
6n = 5n + 5
n = 5
Q7: If AM of a, a+3, a+6, a+9 and a+12 is 10, then a is equal to;
(a) 1
(b) 2
(c) 3
(d) 4
Ans: (d) 4
Sol: Mean of AM = 10
(a + a + 3 + a + 6 + a + 9 + a + 12)/5 = 10
5a + 30 = 50
5a = 20
a = 4
Q8: The class interval of a given observation is 10 to 15, then the class mark for this interval will be:
(a) 11.5
(b) 12.5
(c) 12
(d) 14
Ans: (b) 12.5
Sol: Class mark = (Upper limit + Lower limit)/2
= (15 + 10)/2
= 25/2
= 12.5
Q9: If the sum of frequencies is 24, then the value of x in the observation: x, 5,6,1,2, will be;
(a) 4
(b) 6
(c) 8
(d) 10
Ans: (d) 10
Sol:
Given,
∑fi = 24
∑fi = x + 5 + 6 + 1 + 2 = 14 + x
24 = 14 + x
x = 24 – 14 = 10
Q10: The abscissa of the point of intersection of the less than type and of the more than type cumulative frequency curves of a grouped data gives its
(a) mean
(b) median
(c) mode
(d) all the three above
Ans: (b)
Sol: The abscissa of the point of intersection of the less than type and of the more than type cumulative frequency curves of a grouped data gives its median.
Solve the following Questions
Q1: The class marks of a distribution are 13, 17,21, 25 and 29. Find the true class limits.
Ans: The class marks are 13, 17, 21, 25 and 29.
The class marks are uniformly spaced.
Class size = difference between two consecutive
class marks
= 17 – 13 = 4
Half of the class size = 4/2 = 2
To find the classes one has to subtract 2 from and add 2 to each of the class marks.
Hence, the classes are
11– 15
15 – 19
19 – 23
23 – 27
27 – 31
Since the classes are exclusive, the true class limits are the same as the class limits. So the lower class limits as well as the true lower class limits are 11, 15, 19, 23 and 27. The upper class limits as well as the true upper class limits are 15, 19, 23, 27 and 31.
Q2: Convert the given simple frequency series into a:
(i) Less than cumulative frequency series.
(ii) More than cumulative frequency series.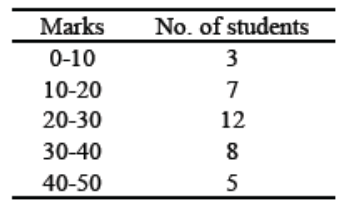 Ans:
Ans: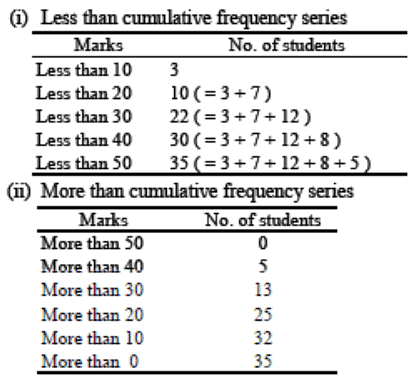
Q3: Drawn ogive for the following frequency distribution by less than method.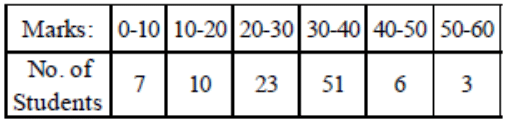 Ans: We first prepare the cumulative frequency distribution table by less than method as
given below: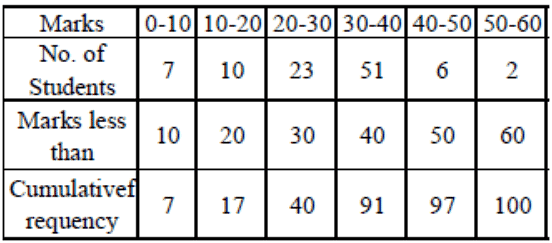 Other thanthe given class intervals, we assume a class – 10-0 before the first class interval 0-10 with zero frequency.
Now, we mark the upper class limits
(including the imagined class) along X-axis on a suitable scale and the cumulative frequencies along Y-axis on a suitable scale.
Thus, we plot the points
(0, 0), (10, 7), (20, 17), (30, 40), (40, 91), (50,97), and (60, 100)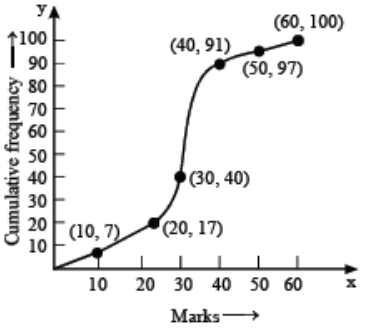 Now, we join the plotted points by a free
hand curve to obtain the required ogive.
Q4: The temperature of a patient, admitted in a hospital with typhoid fever, taken at different times of the day are given below. Draw the temperature-time graph to reprents the data: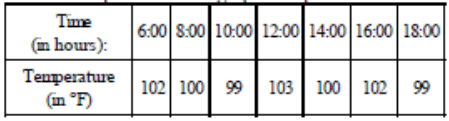 Ans: In order to draw the temperature-time graph, we represent time (in hours) on the x-axis and the temperature in ºF on the y-axis. We first plot the ordered pairs (6, 102), (8, 100), (10, 99), (12, 103), (14, 100), (16, 102) and (18, 99) as points and then join them by line segments as shown in Fig.
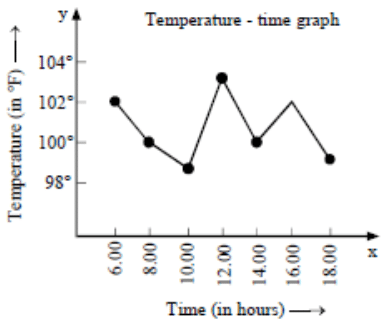
Q5: The class marks of a distribution are 82, 88, 94, 100, 106, 112 and 118. Determine the class size and the classes.
Ans: The class size is the difference between two consecutive class marks. ∴Class size = 88 – 82 = 6. Now 82 is the class mark of the first class whose width is 6. ∴ Class limits of the first class are 82 – 6/2 and 82 + 6/2
i.e. 79 and 85. Thus, the first class is 79-85.
Similarly, the other classes are 85–91, 91– 97, 97–103, 103 –109, 109 –115 and 115 –121.
Q6: Convert the following more than cumulative frequency series into simple frequency series.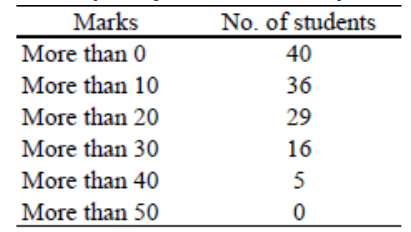 Ans:
Ans: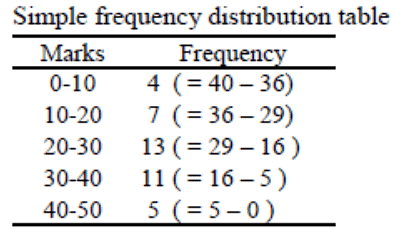
Q7: Draw a cumulative frequency curve for the following frequency distribution by less than method.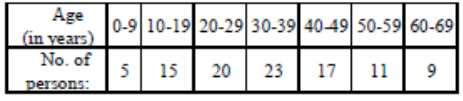 Ans: The given frequency distribution is not continuous. So, we first make it continuous and prepare the cumulative frequency distribution as under:
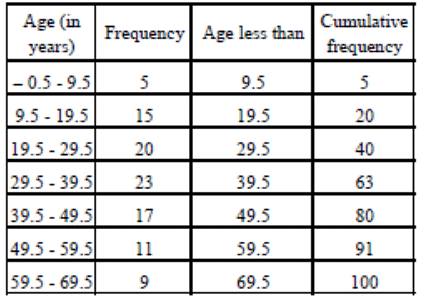 Now, we plot points (9.5, 5), (19.5, 20), (29.5,40), (39.5, 63), (49.5, 80), (59.5, 91) and (69.5, 100) and join them by a free hand smooth curve to obtain the required ogive as shown in Fig.
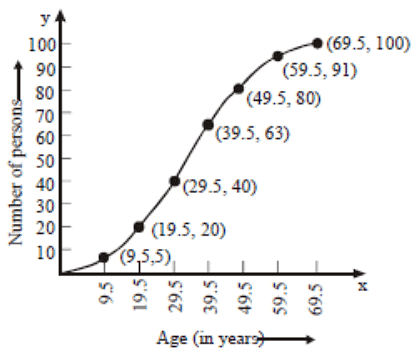
|
127 videos|584 docs|79 tests
|
FAQs on Statistics Class 10 Worksheet Maths Chapter 13
| 1. What is statistics and why is it important in data analysis? |  |
| 2. How can I calculate the mean, median, and mode from a given set of data? | |
| 3. What is the difference between correlation and causation in statistics? | |
| 4. How can I determine if a data set is normally distributed? | |
| 5. What is the difference between a sample and a population in statistics? | |


MCQs
,study material
,ppt
,Exam
,Extra Questions
,Statistics Class 10 Worksheet Maths Chapter 13
,Previous Year Questions with Solutions
,Summary
,Sample Paper
,shortcuts and tricks
,past year papers
,Important questions
,practice quizzes
,Semester Notes
,Viva Questions
,video lectures
,Statistics Class 10 Worksheet Maths Chapter 13
,Objective type Questions
,mock tests for examination
,Statistics Class 10 Worksheet Maths Chapter 13
,Free
;


Worksheet Solutions: Statistics Free PDF Download
Importance of Worksheet Solutions: Statistics
Worksheet Solutions: Statistics Notes
Worksheet Solutions: Statistics Class 10 Questions
Study Worksheet Solutions: Statistics on the App
|
© EduRev
|
Education Revolution
|


|


