Index Numbers Class 11 Economics

Index numbers are powerful statistical tools that help us measure and compare changes in various economic and social phenomena over time. Whether it’s tracking inflation through price changes, measuring shifts in industrial production, or understanding changes in the cost of living, index numbers simplify complex data into a single value that reflects overall trends. By expressing changes as percentages relative to a base period, they allow easy comparison and interpretation across time and categories.

What is an Index Number?
An index number is a statistical tool used to measure changes in the magnitude of a group of related variables. It helps in understanding the general trend of changes over time or across different situations.
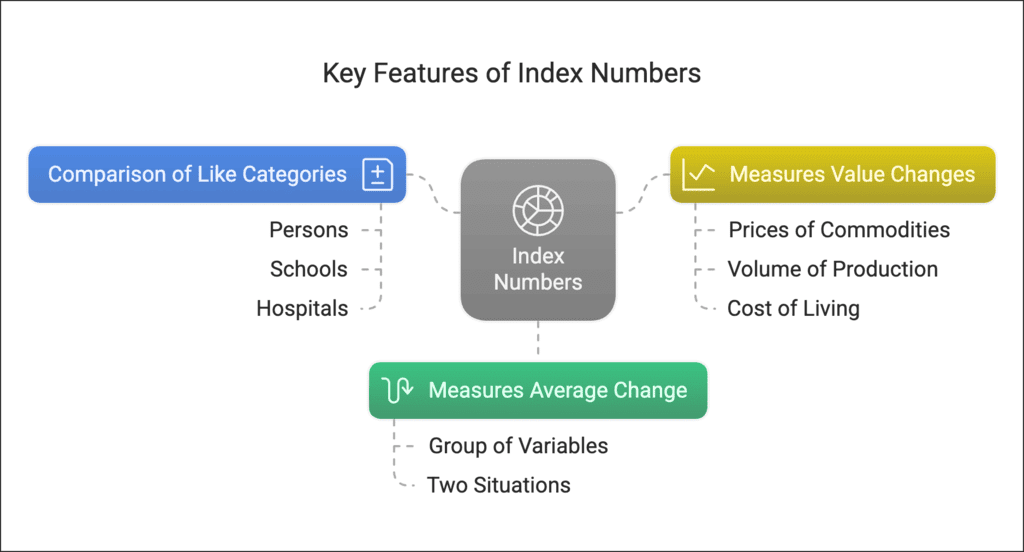
Key Features of Index Numbers:
- Measures Average Change: It shows the average change in a group of related variables between two situations.
- Comparison of Like Categories: The comparison can be made between categories such as persons, schools, hospitals, etc.
- Measures Value Changes: It helps in comparing changes in various aspects such as Prices of commodities (e.g., food items, petrol, etc.), Volume of production (e.g., industrial output, agricultural crops, etc.) and Cost of living (e.g., how much expenses have increased over time).
How Index Numbers are Expressed:
- Expressed as Percentages: Index numbers are generally shown as percentages.
- Base Period: The period with which the comparison is made is called the base period, and its value is given the index number 100.
- For example, if you want to compare prices in 2005 with those in 1990, then 1990 becomes the base period.
- An index number of 250 means the value has increased to 2.5 times the value of the base period.
Types of Index Numbers
1. Price Index Numbers:
- Measure and compare changes in the prices of goods over time.
- Example: Consumer Price Index (CPI) that tracks the price changes of common goods and services.
2. Quantity Index Numbers:
- Measure changes in the physical volume of production, construction, or employment.
- Example: Industrial Production Index that tracks the production levels of various industries.
Construction of an Index Number
Constructing an index number involves using statistical methods to compare changes over time. Here, we'll focus on price index numbers as examples.
Methods of Constructing Index Numbers:
There are two methods of constructing index numbers:
- Aggregative Method
- Method of Averaging Relatives
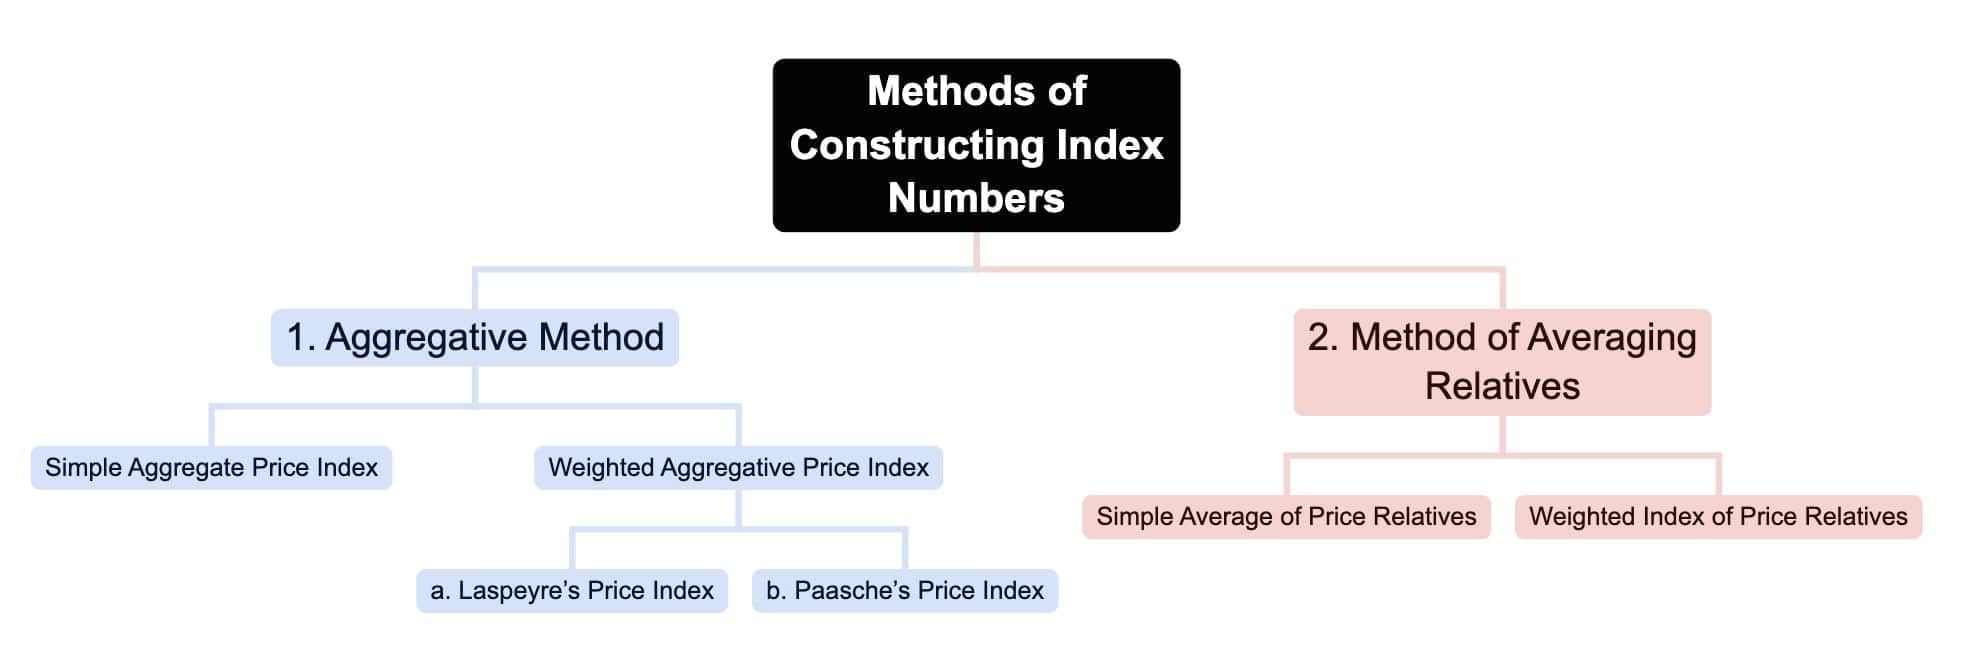
Aggregative Method
In this method, the prices of different commodities are added together for both the base period and the current period.
Simple Aggregate Price Index Formula:
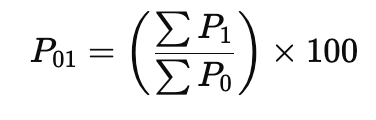
Where,
- = Price of the commodity in the current period
- = Price of the commodity in the base period
Example: Calculation of Simple Aggregative Price Index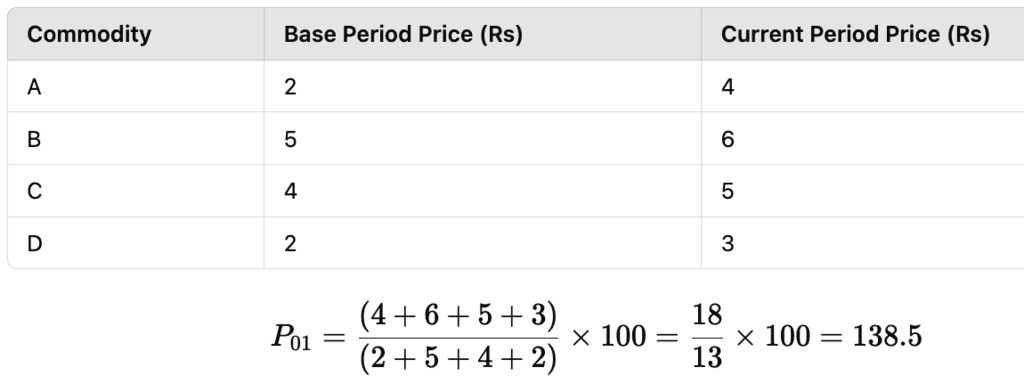
The index number is 138.5, indicating a 38.5% rise in prices.
Limitations of the Simple Aggregative Method:
- Different Units of Measurement: Prices of commodities may be measured in different units (e.g., kilograms, liters, etc.).
- No Weights Given: It treats all items as equally important, which is not realistic.
- Ignores Relative Importance: Essential items should have more weight than less important items.
Example: Rise in food prices affects people more than the same rise in the price of luxury items.
Weighted Aggregative Price Index
Unlike the simple method, this method gives different weights to different commodities based on their importance.
Formula:
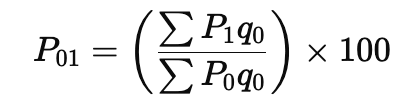
Where,
- = Current period price
- = Base period price
- = Base period quantity
There are two types of weighted aggregating price indices: Laspeyre’s Price Index and Paasche’s Price Index. Let's understand them with the help of an example.
Example: Calculation of Weighted Aggregative Price Index (Laspeyre’s Price Index)
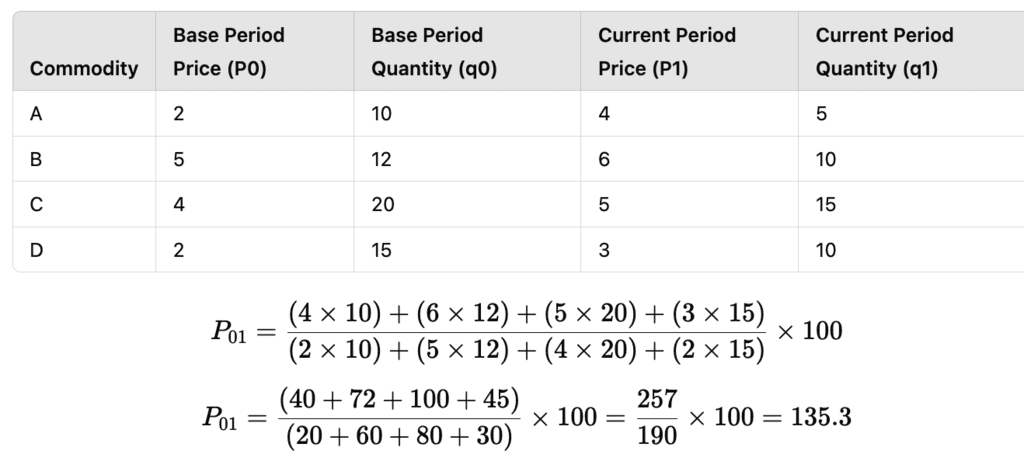
The index number is 135.3, meaning prices have increased by 35.3%.
Laspeyre’s Price Index
- Uses base period quantities (q0) as weights.
- Helps in determining the change in expenditure if the basket of goods from the base period was purchased at current prices.
Paasche’s Price Index (Using Current Period Quantities)
Instead of using the base period quantities, it uses the current period quantities as weights.
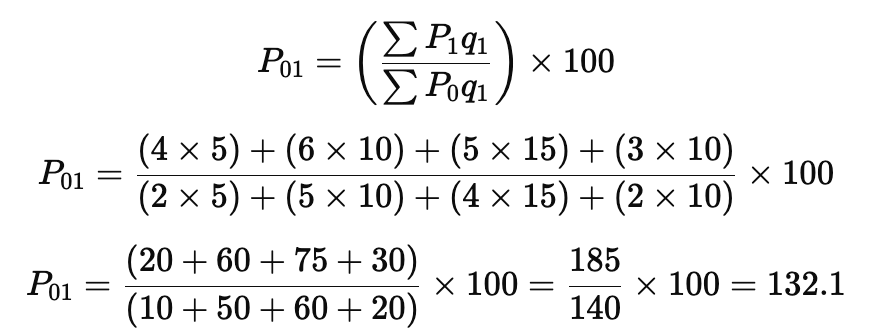
The Paasche’s index tells us:
- If the current period basket of commodities was consumed in the base period, and if we were spending Rs 100 on it, then the expenditure in the current period on the same basket would be Rs 132.1.
- In other words, to purchase the same basket of commodities that cost Rs 100 in the base period, we now need to spend Rs 132.1, indicating a price rise of 32.1%.
Comparison:
- Laspeyre’s Index (Base Quantity Weights): 135.3
- Paasche’s Index (Current Quantity Weights): 132.1
Method of Averaging Relatives
When there is only one commodity, the price index is the ratio of the price of the commodity in the current period to that in the base period, expressed in percentage terms.
However, when there are many commodities, the method of averaging relatives is used.
Formula (Simple Average of Price Relatives):
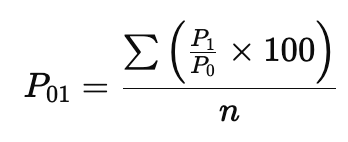
Where:
- = Price of the commodity in the current period.
- = Price of the commodity in the base period.
- = Number of commodities.
Example
Imagine we are comparing the prices of 4 different commodities over two periods: the base period (earlier) and the current period (later). We want to find out how much the prices have increased on average.
Given Data:
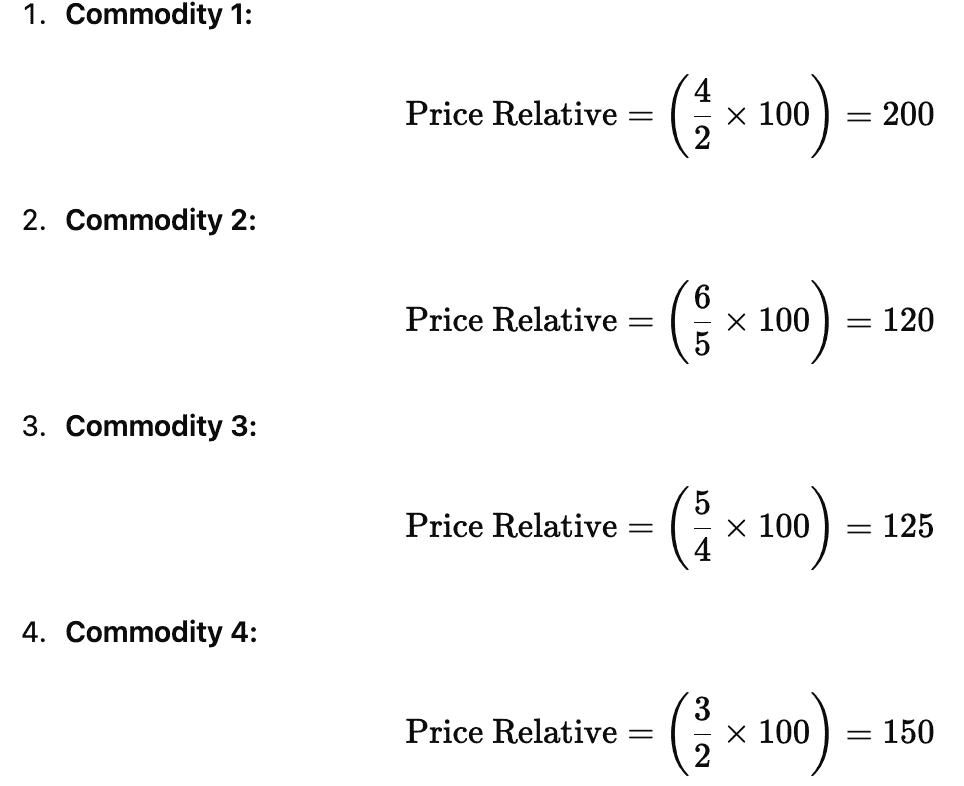
- Commodity 1: Base Price = 2, Current Price = 4.
- Commodity 2: Base Price = 5, Current Price = 6.
- Commodity 3: Base Price = 4, Current Price = 5.
- Commodity 4: Base Price = 2, Current Price = 3.
Step 1: Calculate the Price Relative for Each Commodity
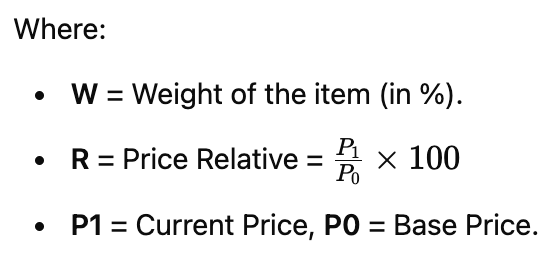
The price relative for a commodity is calculated using the formula:
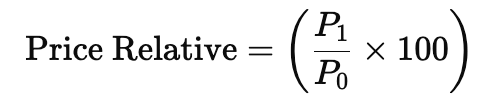
Where:
- = Current Price.
- = Base Price.
Step 2: Calculate the Average of the Price Relatives
Now, we add all the price relatives and divide by the number of commodities (which is 4 here):
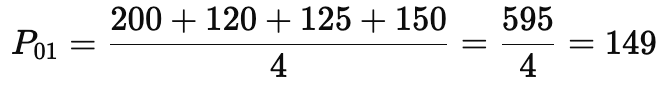
Step 3: Interpret the Result
The final value of 149 means that, on average, the prices of these commodities have increased by 49% compared to the base period.
- A value of 100 would indicate no change in prices.
- A value less than 100 would indicate a decrease in prices.
- A value greater than 100 (like 149 here) indicates an increase in prices.
Weighted Index of Price Relatives
Instead of simply averaging, this method uses weights to reflect the relative importance of items. The weights may represent the proportion of expenditure on each item out of the total expenditure.
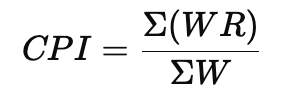
Formula (Weighted Average of Price Relatives)
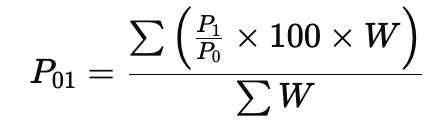
Where:
- = Weight of the commodity.
Example:
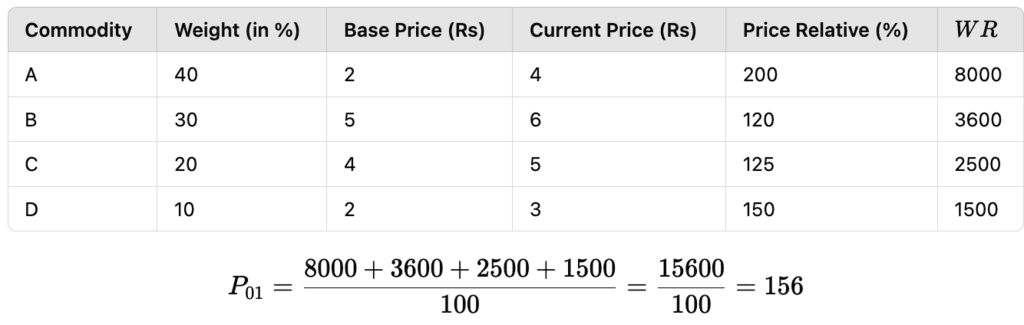
The weighted price index is 156, which means prices have risen by 56%.
Why are Weighted Index Numbers Useful?
The higher rise in the weighted index compared to the simple index shows the importance of considering the relative weights of commodities. For instance, a large increase in the price of a major commodity (like food) will impact the overall price index more significantly than an increase in the price of a less important commodity (like cloth).
Some Important Index Numbers
Consumer Price Index:
The Consumer Price Index (CPI), also known as the cost of living index, measures the average change in retail prices of goods and services over time.
It shows how much the prices have increased or decreased compared to a base year.
Understanding CPI with an Example:
If the CPI for industrial workers with a base year of 2001 = 100 is 277 in December 2014, it means:
If an industrial worker spent Rs. 100 in 2001 to buy a typical basket of commodities, they would need Rs. 277 in December 2014 to buy the same basket.
This indicates an increase of 177% in prices compared to the base year.
Example Calculation:
The formula for CPI is:
Example
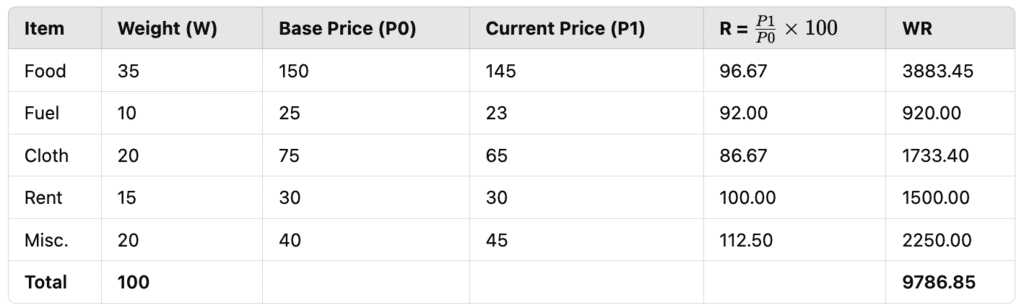
Calculation:
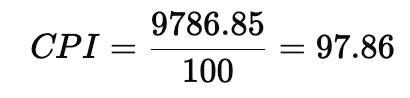
The CPI value is 97.86, which is less than 100. This means the cost of living has decreased by 2.14%.
Interpretation:
If the CPI is greater than 100, it indicates an increase in the cost of living, and wages/salaries need to be adjusted upwards by the amount exceeding 100.
If the CPI is less than 100, it indicates a decrease in the cost of living.
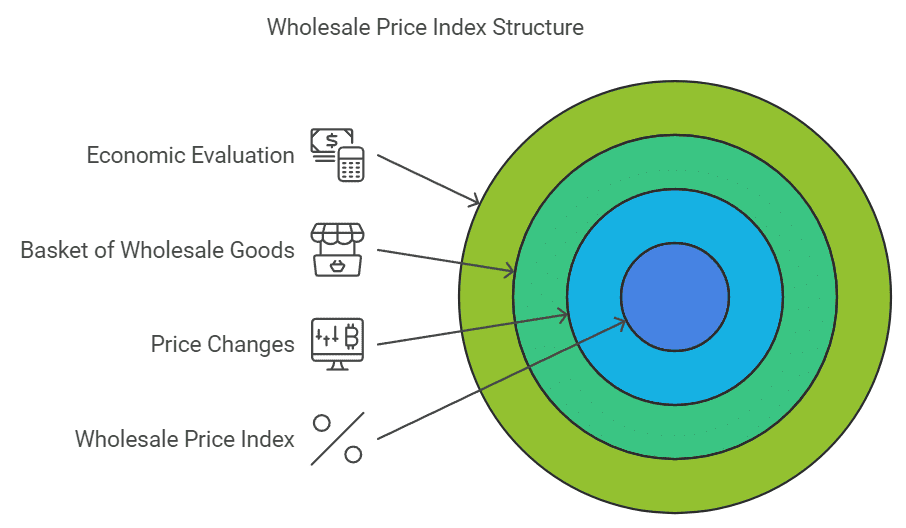
Wholesale Price Index
The Wholesale Price Index (WPI) measures the changes in the general price level of goods at the wholesale level (not retail level).
It does not include services like barber charges, repairs, etc.
Understanding WPI with Example:
If the WPI with the base year 2004-05 = 100 is 253 in October 2014, it means:
The general price level has risen by 153% during this period compared to the base year.
Current WPI Calculation Method:
Base Year: 2011-12 = 100.
WPI Value for May 2017: 112.8.
It only includes the prices of goods (not services).
Weightage of Goods in WPI:
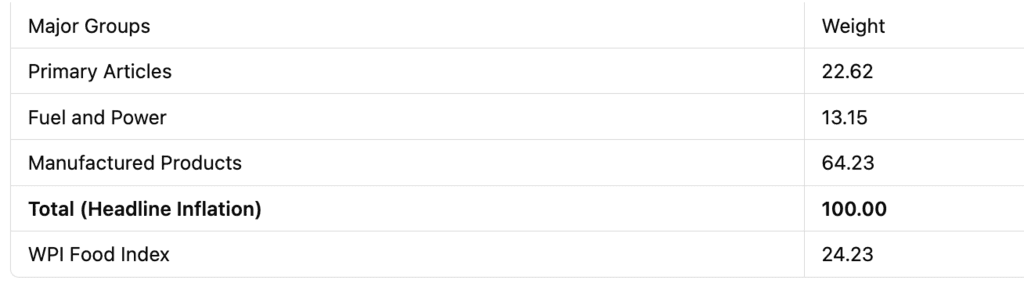
Important concepts:
Headline Inflation (All Commodities Inflation Rate):
It measures overall inflation by considering price changes of all goods included in the Wholesale Price Index (WPI). It provides a broad view of price changes across various sectors like Primary Articles, Fuel & Power, and Manufactured Products.WPI Food Index:
This index focuses on price changes of food items, including:- Food Articles (Primary Articles): Unprocessed items like fruits, vegetables, cereals, etc.
- Food Products (Manufactured Products): Processed items like packaged food, edible oils, etc.
Core Inflation:
Excludes volatile items like food and fuel to focus only on manufactured goods. This helps analyze long-term inflation trends and makes up around 55% of the total WPI weight.
Index of Industrial Production (IIP)
- The Index of Industrial Production (IIP) measures the quantities of goods produced rather than their prices.
- Its current base year is 2011-12 = 100.
- The IIP uses weights based on the value added by manufacturing in the base year, calculated using Laspeyre’s formula.
- The main sectors included in the IIP are Mining (14.4%), Manufacturing (77.6%), and Electricity (8%).
- Core industries like coal, crude oil, natural gas, refinery products, fertilizers, steel, cement, and electricity contribute 40.27% to the IIP.
- The IIP is also categorized by use-based groups such as Primary Goods, Capital Goods, Intermediate Goods, Infrastructure/Construction Goods, Consumer Durables, and Non-Durables.
Sensex
- Benchmark index of the Bombay Stock Exchange (BSE) with a base year of 1978–79.
- Includes 30 leading companies across 13 sectors.
- A rising Sensex indicates positive market performance and investor confidence.
Human Development Index
The Human Development Index (HDI) is a comprehensive measure that seeks to capture three crucial aspects of human development, namely access to education and knowledge, a reasonable standard of living, and good health and longevity. Essentially, the HDI is used to gauge the extent to which development has positively impacted the quality of life for humans.

Issues in the construction of index numbers
- Purpose of the index number.
- Selection of base year.
- Selection of items.
- Selection of the prices of items.
- Selection of the method of weighting.
- Selection of sources of data.
- Choice of an average.
- Choice of method.
Index Numbers in Economics
Index numbers are crucial in economic policy-making. They provide valuable insights into economic trends and assist policymakers in making informed decisions.
- CPI is used to calculate how much money can buy.
- CPI = (Money wage / Cost of living index) × 100.
- The wholesale price index (WPI) helps remove the influence of price changes on totals like national income and capital formation.
- The Consumer Price Index (CPI) or cost of living index numbers are important in wage talks, income policy, pricing policy, rent control, taxation, and general economic policy development.
- Uses of Industrial Production Index (IIP): The IIP provides a quantitative measure of changes in industrial production, helping to assess economic growth.
- Uses of Agricultural Production Index: It gives a quick overview of how the agricultural sector is performing over time.
- Uses of Sensex:
- The Sensex acts as a guide for investors by indicating the general mood of the stock market.
- A rising Sensex shows that investors are optimistic about the economy, making it a favourable time for investment.
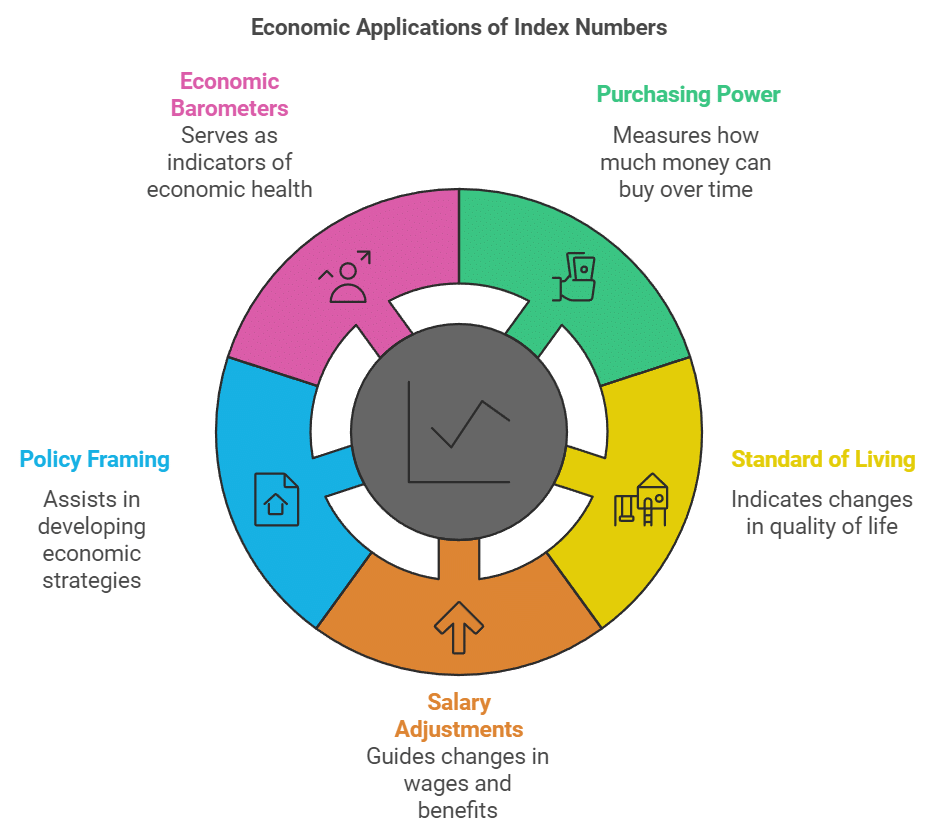
Index numbers can be used for:
- Measuring the purchasing power of money.
- Knowledge of change in the standard of living.
- Adjustment in salaries and allowances.
- Help in framing suitable policies.
- As economic barometers.
Where Can We Get These Index Numbers?
- Widely used index numbers such as WPI, CPI, Index Number of Yield of Principal Crops, Index of Industrial Production, and Index of Foreign Trade are available in the Economic Survey.
Conclusion
- Estimating index numbers helps in calculating a single measure of change for a large number of items, including price, quantity, and volume.
- It is essential to carefully interpret index numbers because choosing the right items and base period is crucial.
- Index numbers are highly important in policymaking due to their wide range of uses.
|
59 videos|222 docs|43 tests
|
FAQs on Index Numbers Class 11 Economics
| 1. What is the purpose of constructing index numbers? |  |
| 2. What are the methods used for constructing index numbers? | |
| 3. How are simple index numbers constructed? | |
| 4. What is the difference between simple and weighted index numbers? | |
| 5. What are some important index numbers used in economics? | |


study material
,Extra Questions
,Free
,Sample Paper
,ppt
,past year papers
,Exam
,Objective type Questions
,Index Numbers Class 11 Economics
,Index Numbers Class 11 Economics
,MCQs
,practice quizzes
,mock tests for examination
,Semester Notes
,video lectures
,Index Numbers Class 11 Economics
,Summary
,Previous Year Questions with Solutions
,shortcuts and tricks
,Viva Questions
,Important questions
;


Chapter Notes - Index Numbers Free PDF Download
Importance of Chapter Notes - Index Numbers
Chapter Notes - Index Numbers
Chapter Notes - Index Numbers Commerce Questions
Study Chapter Notes - Index Numbers on the App
|
© EduRev
|
Education Revolution
|


|


