Application of Phase Rule to Two-Component System | Physical Chemistry PDF Download

(C) Carbon Dioxide System
The phase Diagram of CO2 is explained below:
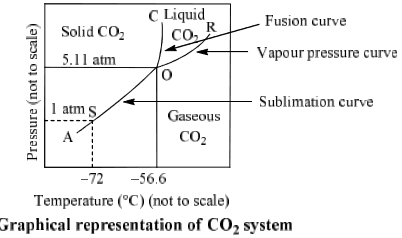
(i) Curves: Curves OA, OB and OC represent monovariant system.
(ii) Areas surrounded by curves: Areas represent bivariant system.
Table. Important features of CO2 system
Phase present in system one phase equilibrium | Position in phase diagram | Degree of freedom |
CO2(s) | Area left to curve AOC | F = C – P + 2 = 1 – 1 + 2 = 2 |
CO2(l) | Areas surrounded by curve OB and OC
| |
CO2(g) |
Two phase equilibrium
 | Area below curve AOB Curve AO | F = C – P + 2 = 1 – 2 + 2 |
 | Curve OB | = 1 |
 | Curve OC |
Three phase equilibrium
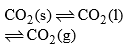 | Point O Triple point (–56.6°C and 5.11 atm) | F = C – P + 2 = 1 – 3 + 2 = 0 |
9. Binary Mixtures
For binary mixtures of two chemically independent components, C = 2 so that F = 4 − P. In addition to temperature and pressure, the other degree of freedom is the composition of each phase, often expressed as mole fraction or mass fraction of one component.
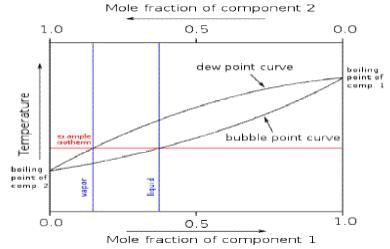
As an example, consider the system of two completely miscible liquids such as toluene and benzene, in equilibrium with their vapours. This system may be described by a boiling-point diagram which shows the composition (mole fraction) of the two phases in equilibrium as functions of temperature (at a fixed pressure).
Four thermodynamic variables which may describe the system include temperature (T), pressure (p), mole fraction of component 1 (toluene) in the liquid phase (x1L), and mole fraction of component 1 in the vapour phase (x1V). However, since two phases are present (P = 2) in equilibrium, only two of these variables can be independent (F = 2). This is because the four variables are constrained by two relations: the equality of the chemical potentials of liquid toluene and toluene vapour, and the corresponding equality for benzene.
For given T and p, there will be two phases at equilibrium when the overall composition of the system (system point) lies in between the two curves. A horizontal line (isotherm or tie line) can be drawn through any such system point, and intersects the curve for each phase at its equilibrium composition. The quantity of each phase is given by the lever rule (expressed in the variable corresponding to the x-axis, here mole fraction). For the analysis of fractional distillation, the two independent variables are instead considered to be liquidphase composition (x1L) and pressure. In that case the phase rule implies that the equilibrium temperature (boiling point) and vapour-phase composition are determined.
Liquid–vapour phase diagrams for other systems may have azeotropes (maxima or minima) in the composition curves, but the application of the phase rule is unchanged. The only difference is that the compositions of the two phases are equal exactly at the azeotropic composition.
10. Two Component System
For a two component system C = 2, the phase rule can be written as
F = C – P + 2 = 2 – P + 2
F = 4 – P
For a system having one phase, the number of degree of freedom would be three. It means three variables pressure, temperature and composition should be specified in order to describe a two component system completely. In order to represent such system graphically three axes perpendicular to each other are necessary. This requires a three dimensional figure which is very difficult to construct on a plain paper. It is therefore, customary to represent such system by any two or the three variables keeping third constant in a two component system since minimum number of degree of freedom is zero so maximum four phases can coexist together.
Solid Liquid Equilibrium Condensed System
In a two component system various possible phase equilibria are solid-solid, solid-liquid, solid-gas, liquid-gas and liquid-liquid. Here we shall restrict to only solid-liquid equilibria. Such equilibria are generally characterized by the absence of the vapour phase and are relatively unaffected by change in pressure. Such systems are generally called condensed system and are studied at one atmosphere pressure. With this restriction of constant pressure, phase rule reduces to
F = C – P + 1 …………..(2)
This is known as the reduced phase rule
For the two component system we have
F = 2 – P + 1
F = 3 – P
The variable are temperature and composition and solid-liquid equilibria are therefore represented on a temperature-composition diagram.
(A) Lead-Silver System
Lead-Silver system is a two component system. The phase diagram of this system is shown in, figure. Lead and silver are immiscible with each in liquid state and do not react with each other.
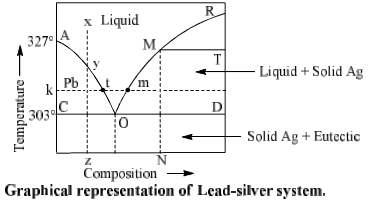
Composition of liquid state is taken on X-axis and temperature on Y-axis. Pressure is kept constant throughout the experiment. Point W is freezing point of pure lead, it means solid and liquid phase of lead are D in equilibrium at this point. Now, if silver is added in it, its freezing point decreases is obtained at solid lead and solution of silver in lead (liquid) come in equilibrium and we get curve BO. Temperature at ‘O’ is 303° C. Liquid phase disappears below this temperature.
Table. Pb-Ag system
Phase present in equilibrium one phase equilibrium | Position in phase diagram | Degree of freedom |
Sodium(l) (Ag + Pb) | Area above curve AOB | F = C – P + 1 = 2 – 1 + 1 = 2 |
Two phase equilibrium
 | Area above curve AOB | F = C – P + 1 = 2 – 2 + 1 = +1 |
 | Curve BO and area BDO | F = C – P + 1 = 2 – 2 + 1 = +1 |
 | Area below line (COD) |
Desilverisation of Lead-Pattinson’s Process: The phase diagram is used in the separation of silver from lead in Pattinson’s process for desilverisation of lead. Suppose x represents the molten argentiferous lead containing a small amount of silver (0.25%) in it. Allow it to cool. Only temperature of liquid melt fall with no change in composition till the point y on the curve AO reached. On further cooling lead starts to crystallize out and the solution become richer in silver. On further cooling lead continuous to separate out and is constantly removed by means of loads. The liquid melt continuous to be richer in silver till the point a is reached where an alloy having 2.6% of silver (from 0.25% to 2.6%) is obtained. The above process of increasing the percentage of silver in argentiferous lead is known as Pattinsion’s process.
(B) Bismuth Cadmium System (Bi-Cd system)
Bi-Cd is a bivariant system. Phase diagram of this system is shown in figure.
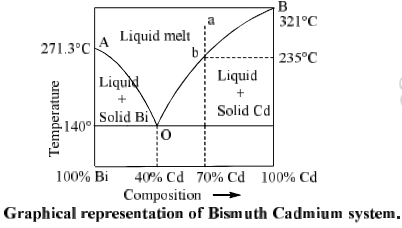
Point A is the freezing point of pure Bi (271.3°C). When Cd is added in it, freezing point of Bi decreases and solid Bi and solution of Cd in Bi come into equilibrium. On further addition of Cd follows the curve AO. Curve AO is known as freezing point curve of Bi.
Similarly curve BO is freezing point curve of Cd. On curve AO and BO, number of phases are 2, number of components are 2 so degree of freedom is 1. Therefore AO and BO represent univariant system.
Curve AO and BO meet at O. Point O is called eutectic point where three phases, i.e. solid Bi, solid Cd and melt (liquid) are in equilibrium. Here P = 3, C = 2, and F = 0 so the system is non variant at O. Temperature at a is 140°C and composition of mixture is fixed (40% Cd and 60% Bi). This composition is called eutectic mixture or eutectic composition.
Now let us consider a point ‘a’ in the phase diagram where percentage of Cd is 70% in liquid melt. When the melt is cooled point ‘a’ shifts towards ‘b’ (235°C) and solid Cd starts to separate out form liquid melt and point ‘b’ follows the curve BO. Along the curve, P = 2 and system becomes monovariant.
As the curve proceeds, more the more solid Cd separates out and liquid melt becomes richer and richer in Bi. At eutectic point 0, solid Bi also separates out. Therefore there are the phases i.e. solid Ag, solid Bi and liquid melt in equilibrium at point O. This is a non variant system. On further cooling liquid melt starts to freeze.
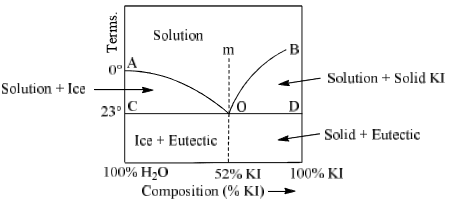
(C) Potassium Iodide-Water System (KI-H2O system)
The potassium iodide-water system is a typical example of two component system which forms a eutectic mixture. Figure shows the phase diagram of KI-H2O system.
It is almost same as that of Pb-Ag system except one difference that point B cannot be extended upto the melting point of pure KI since water can no exist in liquid state upto the m.p. of KI.

Main feature of this system are
Curve AO: Point A represents the freezing point of water at 1 atm pressure. This temperature is 0°C. When increased quantities of KI or KI is added, the freezing point of water goes on decreasing along the curve AD. Therefore AD is called freezing point curve of water. Along the curve AD, the solution of KI in H2O is in equilibrium with ice. Thus it is a two phase system and degree of freedom is calculated by condensed phase rule.
F = C – P + 1
F = 2 – 2 = 1 = 1
Thus the system is monovariant. It means the composition of the system is fixed corresponding to each temperature.
Curve BO: This is known as the solubility curve of KI in water at different temperature. The solubility of KI increases with rise of temperature and becomes maximum at the point B which is the boiling point of the saturated solution. Along the curve BO, solid KI is in equilibrium with solution. Again it is a monovariant system along BO.
Point ‘O’: It is the eutectic or cryohydric point. Curves AO and OB intersect. At this point corresponding to a definite temperature (–23°C) and fixed composition (52% KI + 48% ice). The temperature is known as cryohydric temperature and composition is called cryohydric composition. At this point ‘O’ ice, solution and solid KI are in equilibrium. This point has no degree of freedom which is also clear from the condensed phase rule.
F = C – P + 1 = 2 – 3 + 1 = 0
Area ACO:
Two phases (i) ice (solid) and (ii) solution of KI in water (liquid) are in equilibrium in this area. Thus, it is a monovariant system. Composition of liquid state can be determined by drawing a tie line at any given temperature.
Area BOD: This area also has two phases namely solid KI and solution (melt) in equilibrium. Therefore P = 2, C = a which follows F = 1. Thus, it is also a monovariant system.
Area above curve AOb: Only one phase i.e. aqueous solution of KI exists in this area. System is bivaraint in this region. Temperature and composition both have to be fixed to describe the system at any point in this area.
Area below horizontal line COD:
In this region liquid state does not exist. Solid KI and solid water (ice) are present in this area. The system is monovariant (F = 1) in this area. Cryohydric mixture is found in this area with a composition of 52% KI and 48% ice.
Let us take a point ‘m’ above the eutectic point O in the phase diagram. This region has only a solution of KI in water. When this solution is cooled slowly, point m shifts towards without any change in composition.
At ‘0’ ice and solid KI separate out simultaneously. Whole of the solution converts into cryohydric mixture below the point ‘O’.
Table. Main feature of KI-H2O system
Phase present in equilibrium One phase equilibrium | Position in phase diagram | Degree of freedom |
Solution (l) (KI in water) | Area above curve AOB | F = C – P + 1 = 2 – 1 + 1 = 2 |
Two phase equilibrium
 | Curve AO and area ACO | F = C – P + 1 = 2 – 2 + 1 = 1 |
 | Curve Bo and area BOD |
Three phase equilibrium
 | Point ‘O’ cryohydric point (–23°C) and 52% KI) | F = C – P + 1 = 2 – 3 + 1 = 0 |
Freezing Mixtures
Cooling effect takes place when a salt is added in ice. This fact can be explained by point D-KI-H2O phase diagram shown in fig. Let NaCl or KCl is added in ice at DOC at point W. We follow curve AO. Since, some salt is dissolved in H2O present with ice at DOC so there will be three phases present along the curve AO. These phases are salt (solid), Ice (solid) and solution. But these three states can be stable at only eutectic temperature which is generally lower than the freezing point of ice. Therefore more ice will melt and more salt will be dissolved in obtained water and composition of mixture will vary along the curve AO. Melting of ice and dissolution of salt are exothermic processes so required heat is taken from the system and temperature of system (ice) falls. More the amount of dissolved salt lower will be temperature of the system until it reaches to cryohydric point O. The composition of solution at this minimum temperature is called as cryohydric composition. On other hand if we take saturated solution of salt and add ice into it, we follow the curve BO until we reach point O. Thus, minimum temperature is same either we add ice into salt or salt into ice
|
90 videos|144 docs|67 tests
|
FAQs on Application of Phase Rule to Two-Component System - Physical Chemistry
| 1. What is the Phase Rule? |  |
| 2. How is the Phase Rule applied to a two-component system? | |
| 3. What are the degrees of freedom in the Phase Rule for a two-component system? | |
| 4. How can the Phase Rule be used to analyze phase equilibria in a two-component system? | |
| 5. What are some practical applications of the Phase Rule in a two-component system? | |


Application of Phase Rule to Two-Component System | Physical Chemistry
,mock tests for examination
,shortcuts and tricks
,Free
,ppt
,practice quizzes
,Extra Questions
,MCQs
,video lectures
,Previous Year Questions with Solutions
,Application of Phase Rule to Two-Component System | Physical Chemistry
,study material
,Semester Notes
,Viva Questions
,Important questions
,Exam
,Sample Paper
,Application of Phase Rule to Two-Component System | Physical Chemistry
,past year papers
,Objective type Questions
,Summary
;


Application of Phase Rule to Two-Component System Free PDF Download
Importance of Application of Phase Rule to Two-Component System
Application of Phase Rule to Two-Component System Notes
Application of Phase Rule to Two-Component System Chemistry Questions
Study Application of Phase Rule to Two-Component System on the App
|
© EduRev
|
Education Revolution
|


|


within 7 days!