Practice Questions: Data Interpretation- 1

DIRECTIONS for Questions 1 to 3: The following table gives the data about big 12 software exporters in India from 1997-98 to 1999-2000 (Revenue in Rs. crore).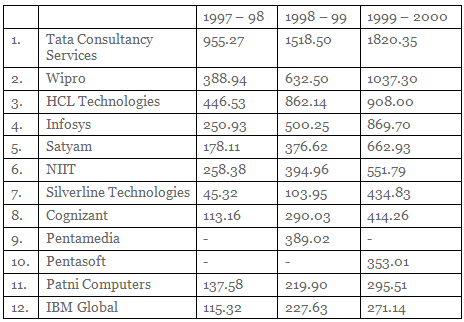
Q1: What is the lowest rate of growth of 1998-99 to 1999-2000 for any of the companies given in the chart?
(a) 0%
(b) 12.7%
(c) 19.1%
(d) 5.3%
Ans: (d)
Sol: Lowest growth has been for HCL: from 862 to 908, about 5%.
Hence option d.
Q2: Which of the following statement is true about the share of exports of Tata Consultancy Services in the total exports of the 12 companies?
(a) It has almost doubled in 1999 - 00 over 1997 - 98.
(b) It has been steadily increasing
(c) It is more or less constant.
(d) It has dropped by about 10 %.
Ans: (d)
Sol: Share in 1997-98: 33%.
In 1999-2000, the share is 1820/7618 = 23%, so it has dropped by almost 10%.
Q3: If total software exports in 2000 - 2001 were expected to be Rs 10,000 crore and the growth of Infosys is the same as it was in 1999 - 2000, what would have been Infosys' share of exports of these 12 companies in 2000 - 2001?
(a) 15%
(b) 19%
(c) 21%
(d) 23%
Ans: (a)
Sol: Growth of Infosys has been almost 74%.
Increase 869 by 74 % and we get about 1,500 which is 15% of 10,000.
Q4: Study the following graph and answer the questions that follow.
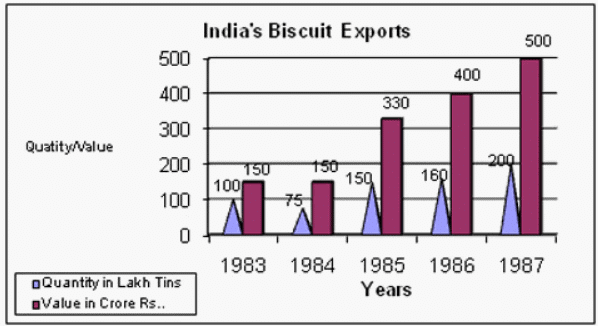
In which year was the value per tin the minimum?
(a) 1987
(b) 1984
(c) 1985
(d)1983
Ans: (d)
Sol: In 1983, value per tin is 150/100, which is the lowest for all the years.
Hence d.
Q5: Study the following graph and answer the questions that follow.
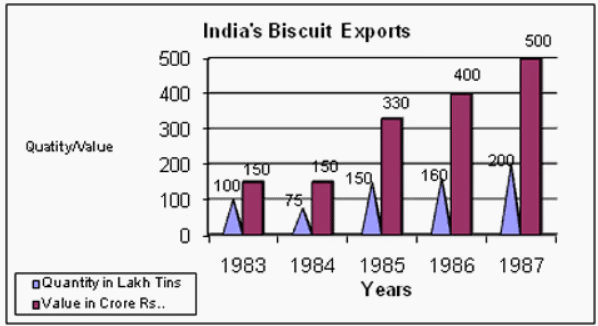 If in 1986 tins were exported at the same rate per tin as in 1985, then what would be the value of exports in 1986? (Crores of Rupees)
(a) 400
(b) 420
(c) 375
(d) 352
Ans: (d)
Sol: Value in 1985: 330/150 = 2.2.
Value in 1986: 160 x 2.2 = 352.
Hence option d.
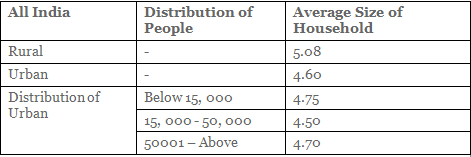
Q6: The percentage distribution of households by household size and the average sizes of household in.
All India Rural and Urban areas.
Urban areas classified as per population size are presented below.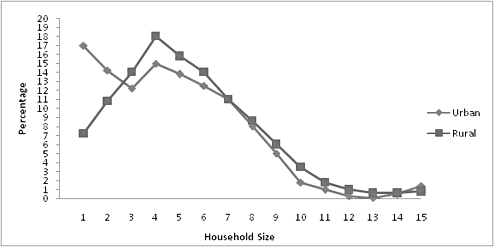
In rural areas, which one of the following sizes of the households is the highest in number?
(a) 15
(b) 2
(c) 3
(d) 4
Ans: (d)
Sol: From the graph, we see that the line for rural peaks at about 4-5.
Hence the best answer is (d).
Q7: In urban areas, among households of different sizes, what is the percentage of households of size 5 or less?
(a) 13
(b) 72
(c) 36
(d) 87
Ans: (b)
Sol: Total up the number of households ≤ 5 are 17 + 14 + 12 + 15 + 14 = 72.
Q8: In rural areas, per 100 households, there were 31 households of size:
(a) 3 or above
(b) 3, 4 and 5
(c) 3 or less
(d) 4 or less
Ans: (c)
Sol: Total up the values for rural area for the size 3 or less to get the answer.
Q9: As the urban population of towns increases, the average household size
(a) Increases
(b) Decreases
(c) remains constant
(d) Fluctuating
Ans: (d)
Sol: As population size increases, we see that household size is 4.75, 4.50, 4.70.
Hence the values are fluctuating.
Q10: Which one of the following statements is true?
(a) On average there are more persons per family in urban areas than in rural areas.
(b) In rural areas, 35 percent of the households are of size 7 and above.
(c) In urban areas, the average size of the household is the least for towns.
(d) In urban areas, there are 460 persons on average per 100 households.
Ans: (b)
Sol: Only statement (b) can be inferred from the given graphs.
FAQs on Practice Questions: Data Interpretation- 1
| 1. What is data interpretation and why is it important? |  |
| 2. What types of charts are commonly used in data interpretation? | |
| 3. How can I improve my data interpretation skills for exams? | |
| 4. What are some common mistakes to avoid in data interpretation? | |
| 5. Are there any strategies for answering data interpretation questions in exams? | |