Graphical Representation & Data Interpretation: Previous Years Questions- 1 | Data Interpretation for UGC NET PDF Download
Q1: Number of boys who appeared from City A is ______% more than that from City B. (December 2023)
(a) 8
(b) 12
(c) 15
(d) 18
Ans: (c)
Sol:
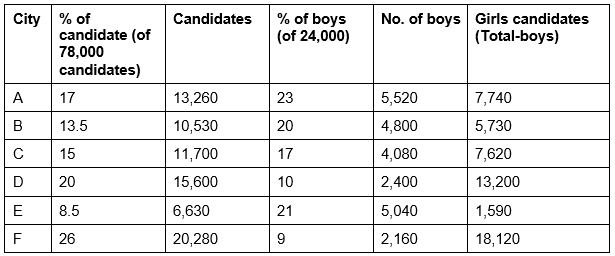 Difference between boys from city A and city B = 5,520 – 4,800 = 720
% of boys from city A more than of boys from city
Total candidates from city D = 15,600
Percentage of girls from city C of total candidates from city
Q2: Number of girls who appeared from City F is approximately ______% of the number of girls who appeared from all the six cities together. (December 2023)
(a) 31.55
(b) 33.55
(c) 32.55
(d) 34.55
Ans: (b)
Sol: Number of girls appeared in examination from city F = 18,120
Total girls = 54,000
Percentage of girls from city F of total girls –
Q3: Number of girls who appeared from City C is approximately ______% of the number of candidates who appeared from City D. (December 2023)
(a) 45
(b) 49
(c) 54
(d) 57
Ans: (b)
Sol:
Number of girls from City C = 7,620
Total candidates from City D = 15,600
Percentage of girls from City C of total candidates from City
Q4: What is the difference between the number of boys and the number of girls who appeared in the exam from City E? (December 2023)
(a) 3450
(b) 3500
(c) 3550
(d) 3650
Ans: (a)
Sol:
Girls from City E = 1,590
Boys from City E = 5,040
Difference = 5,040 – 1,590 = 3,450
Q5: What is the total number of girls who appeared from City A? (December 2023)
(a) 6420
(b) 6880
(c) 7300
(d) 7740
Ans: (d)
Sol:
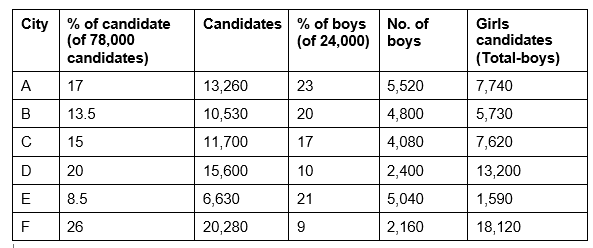
So that total number of girls who appeared from city A= 7,740
Q6: In which year the percentage (%) increase in the Net National Income over the previous year was maximum? (June 2023)
(a) 2019–20
(b) 2018–19
(c) 2017–18
(d) 2016–17
Ans: (d)
Sol: Increase percentage of net national income in
2016–17 = (136 – 122) × 100/122 = 11.47%
2017–18 = (151 – 136) × 100/136 = 11.02%
2018–19 = (167 – 151) × 100/151 = 10.59%
2019–20 = (177 – 167) × 100/167 = 5.99%
Maximum increase in % is in year 2016–17.
Q7: Assuming that the per capita Net national Income grows beyond the year 2019-20 at the average annual rate of increase (%) of the period (2015-16 to 2019-20), what will be its value (in thousand `) at the end of the year 2020-21? (June 2023)
(a) 135.68
(b) 138.35
(c) 140.17
(d) 143.34
Ans: (d)
Sol: Average annual rate of increase of per capita net national income
Increase rate: 2016–17 : (105 – 95) × 100/95 = 10.53
2017–18 : (115 – 105) × 100/105 = 9.52
2018–19 : (126 – 115) × 100/115 = 9.57
2019–20 : (132 – 126) × 100/126 = 4.76
Average rate = (10.53 + 9.52 + 9.57 + 4.76)/4 = 8.595
Per capita at the end of 2020-21 = 132 × 108.595/100 = 143.34
Q8: What is the average per capita Net National Income (in thousand rupees) per year? (June 2023)
(a) 103.25
(b) 114.6
(c) 110.3
(d) 108.6
Ans: (b)
Sol: Average per capita net national income = (95 + 105 + 115 + 126 + 132)/5 = 573/5 = 114.6
Q9: With reference to the year 2015-16, the percentage growth in the population of India by the year 2019-20 is (June 2023)
(a) ∼6.2%
(b) ∼4.4%
(c) ∼7.1%
(d) ∼3.1%
Ans: (b)
Sol: Per capita net national income = National income/ Population
Population = National income/Per capita income
2015–16 : 122/95 = 1.28
2019–20 : 177/132 = 1.34
Growth = (1.34 – 1.28) × 100/1.28 = 4.4% approx.
Q10: What is the percentage increase (%) in per capita Net National Income during 5 years (i.e 2015-16 to 2019-20)? (June 2023)
(a) ∼38.94%
(b) ∼48.24%
(c) ∼30.61%
(d) ∼42.40%
Ans: (a)
Sol: Percentage increase in Per capita net national income during given 5 years (132 – 95) × 100/95 = 38.94%
Q11: The difference between the number of male and female athletes from country C was the second highest in the year ______. (March 2023)
(a) 2016
(b) 2017
(c) 2019
(d) 2021
Ans: (b)
Sol:
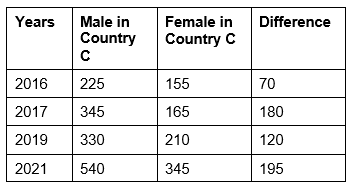
Highest difference in 2021.
Second highest is in 2017.
Q12: The average number of female athletes who participated from Country B over the years together was ______. (March 2023)
(a) 300
(b) 275
(c) 310
(d) 280
Ans: (a)
Sol: Average of female athletes from Country B = Sum of female participants/no. of years
= (210 + 310 + 240 + 420 + 260 + 360)/6 = 1,800/6 = 300
Q13: The approximate percentage decrease in the number of male athletes who participated from Country C in the year 2018 as compared to the previous year was ______. (March 2023)
(a) 21%
(b) 25%
(c) 30%
(d) 35%
Ans: (c)
Sol: Male participants from Country C in 2018 = 240
Male participants from Country C in 2017 (Previous year) = 345
Decrease = 105
Decrease percentage = (105 × 100)/345 = 30.43% or 30% approximate.
Q14: The number of female athletes who participated from Country E in the year 2020 was ______% of the total number of athletes who participated from Country B in the year 2019. (March 2023)
(a) 60
(b) 56
(c) 50
(d) 46
Ans: (d)
Sol: Female participants from Country E in 2020 = 460
Total participants from Country B in 2019 = 570 + 420 = 990
Percentage = 460 × 100/990 = 46.46% or 46% Approximately.
Q15: In the year 2017, the total number of athletes who participated in the event was the second highest from country ______. (March 2023)
(a) A
(b) B
(c) D
(d) E
Ans: (b)
Sol: Athletes participated in 2017 from country,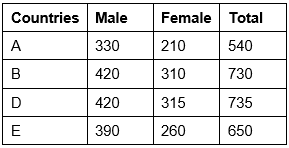 Highest = Country D
Second highest = Country B
Q16: What was the approximate percentage increase in the sales of 55AH batteries in 2021 compared to that in 2015? (September 2022)
(a) 28%
(b) 31%
(c) 33%
(d) 34%
Ans: (d)
Sol: Sale of 55AH batteries in, 2015 = 108
2021 = 145
Change = 37
Change in per cent = 37 × 100/108
= 34.26% or 34% approximately.
Q17: The total sales of all the seven years is maximum for which type of battery? (September 2022)
(a) 4AH
(b) 7AH
(c) 32AH
(d) 35AH
Ans: (c)
Sol: Sale of batteries of all seven years:
4AH = 75 + 90 + 96 + 105 + 90 + 105 + 115 = 676
7AH = 144 + 126 + 114 + 90 + 75 + 60 + 85 = 694
32AH = 114 + 102 + 75 + 150 + 135 + 165 + 160 = 901
34AH = 102 + 84 + 105 + 90 + 75 + 45 + 100 = 601
55AH = 108 + 126 + 135 + 75 + 90 + 120 + 145 = 799
Highest sales is of 32AH battery.
Q18: What is the difference in the number of 35AH batteries sold in 2016 and 2020? (September 2022)
(a) 24,000
(b) 28,000
(c) 35,000
(d) 39,000
Ans: (d)
Sol: Sale of 35AH battery,
In 2016 = 84,000
In 2020 = 45,000
Difference = 84,000 - 45,000 = 39,000
Q19: The percentage of 4AH batteries sold in a given year to the total number of batteries sold in that same year maximum in the year. (September 2022)
(a) 2017
(b) 2018
(c) 2019
(d) 2020
Ans: (d)
Sol:
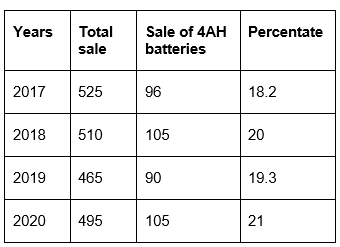 Highest per cent of sale of 4AH batteries of total sale is in 2020 among the given options.
Q20: In case of which type of battery there was a continuous decrease in sales from 2015 to 2020? (September 2022)
(a) 4AH
(b) 7AH
(c) 32AH
(d) 35AH
Ans: (b)
Sol: By observing the table, the type of battery for which there was a continuous decrease in sales from 2015 to 2020 is 7AH batteries.
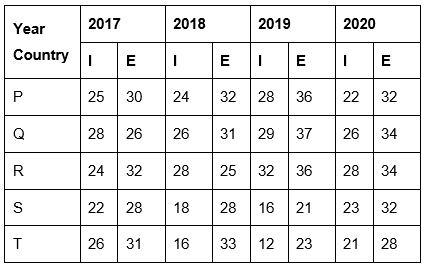
Direction for Questions (21 to 25): Study the table carefully and answer the questions that follow: In the following table, total Exports and Imports of 5 countries over 4 years (in ` crore) is given. Study the table carefully and answer the given questions. (I-import, E-export)
Q21: Which year has the maximum export? (November 2021)
(a) 2017
(b) 2018
(c) 2019
(d) 2020
Ans: (d)
Sol: Export of 2017 = 30 + 26 + 32 + 28 + 31 = 147
Export of 2018 = 32 + 31 + 25 + 28 + 33 = 149
Export of 2019 = 36 + 37 + 36 + 21 + 23 = 153
Export of 2020 = 32 + 34 + 34 + 32 + 28 = 160 (maximum)
Q22: Which year has the minimum average import? (November 2021)
(a) 2017
(b) 2018
(c) 2019
(d) 2020
Ans: (b)
Sol: Average imports of:
2017; (25 + 28 + 24 + 22 + 26)/5 = 125/5 = 25
2018; (24 + 26 + 28 + 18 + 16)/5 = 112/5 = 22.4 (Minimum)
2019; (28 + 29 + 32 + 16 + 12)/5 = 117/5 = 23.4
2020; (22 + 26 + 28 + 23 + 21)/5 = 120/5 = 40
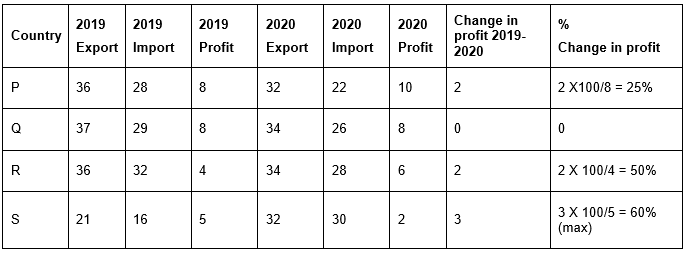
Q23: Which country has the maximum percentage of profit increase from 2019 to 2020? (Profit = Export – Import) (November 2021)
(a) P
(b) Q
(c) R
(d) S
Ans: (d)
Sol:
Q24: Find out the ratio of export done by country S and T during 2017-2020. (November 2021)
(a) 109/115
(b) 111/115
(c) 108/117
(d) 107/117
Ans: (a)
Sol: Export done by country S = 28 + 28 + 21 + 32 = 109
Exports done by country T = 31 + 33 + 23 + 28 = 115
Ratio = 109/115 or 109:115
Q25: Find out the difference between the average export and average import for the country P. (November 2021)
(a) 7.25
(b) 7.75
(c) 8.25
(d) 8.50
Ans: (b)
Sol: Average export of country P = 30 + 32 + 36 + 32/4 = 130/4 = 32.5
Average import of country P = 25 + 24 + 28 + 22/4 = 99/4 = 24.75
Difference of average import and average export = 32.5 – 24.75 = 7.75
Q26: The ratio of the number of companies having more production than demand to that of companies having more demand than production is (November 2020)
(a) 3:2
(b) 1:4
(c) 1:1
(d) 2:3
Ans: (d)
Sol: The number of companies having more production is 2. The number of companies having more demand is 3. So, the ratio is 2:3.
Q27: Which company has a minimum demand to production ratio? (November 2020)
(a) B
(b) C
(c) D
(d) E
Ans: (a)
Sol: Ratios of all the companies are:
A - 2:1 = 36/18
B - 1:3 = 6/18
C - 5:2 = 45/18
D - 4:9 = 8/18
E - 3:2 = 27/18
Hence, option (a) is correct.
Q28: The difference between average demand and average production of computers of all companies combined together is (November 2020)
(a) 950
(b) 190
(c) 180
(d) 850
Ans: (b)
Sol: Total demand is 5,800
Average demand is 1,160
Total production is 4,850
Average production is 970
Difference between average demand and average production is 190.
Q29: The demand for computers is less than the production of computers in how many companies? (November 2020)
(a) 4
(b) 3
(c) 1
(d) 2
Ans: (d)
Sol: The demand of computers is less than the production of computers in Companies B and D. Hence, the answer is 2.
Q30: The demand of computers of Company D is more than that of the demand of the computers of Company B by (November 2020)
(a) 1.5 times
(b) 2 times
(c) 2.5 times
(d) 3 times
Ans: (b)
Sol: The demand for computers of Company D is 600. The demand for computers of Company B is 300. The demand in D is more than that of Company B by 300. 300 × 2 = 600, Hence 2 times.
Q31: What was the profit of all the countries together in the year 2012 if the total imports of all the countries together was rupees 385 crore? (December 2019)
(a) Rupees 510 crores
(b) Rupees 280 crore
(c) Rupees 160 crore
(d) Rupees 125 crore
Ans: (d)
Sol: Import of all countries together in 2012 = 385 cr
Export of all countries together in 2012 = 510 cr
Total profit = 125 cr
Q32: If the ratio of export to import in country F and country D are 4:1 and 1:2 respectively in the year 2008, then what is the total import of country F and D together in that particular year? (in crores of rupees) (December 2019)
(a) 44
(b) 65
(c) 92
(d) 96
Ans: (d)
Sol: Ratio of export of F in 2008 = 4:1
Export of F in 2008 = 24 cr
Let import be A, then 24:A = 4:1
Import of F in 2008 = 24 × 1/4 = 6
Ratio of export of D in 2008 = 1:2
Export of D in 2008 = 45 cr
Let Import be B, then 45:B = 1:2
Import of D in 2008 = 45 × 2/1 = 90
Total import of F and D = 96 cr
Q33: If the export of country A in the year 2013 is 20% more than the total export of country B in 2011 and the export of country E in 2010 together, then what was the profit of A in the year 2013 if its import was ` 92 crore for that year? (in crores of rupees) (December 2019)
(a) 10
(b) 22
(c) 34
(d) 46
Ans: (c)
Sol: Export of country B in 2011 = 50 cr
Export of country E in 2010 = 55 cr
Total E and B = 105 cr
Export of Country A in 2013 = 105 + 20/100 × 105 = 105 + 21 = 126 cr
Import of Country A in 2013 = 92 cr
Profit = 126 – 92 = 34 cr
Q34: By what per cent is the average export of country E over all the given years more than the average export of country C over all the years? (December 2019)
(a) 13 7/11%
(b) 14 7/11%
(c) 13 5/7%
(d) 14 5/7%
Ans: (a)
Sol: Average Export of E = 375/5 = 75
Average Export of C = 330/5 = 66
Avg export of E is more than Avg export of C by = 75 – 66 = 9
Percentage of difference = 66 × A/100 = 9

Q35: What is the percentage increase in the export of all the countries together from the year 2009 to 2011? (December 2019)
(a) 
(b) 
(c) 
(d) 
Ans: (b)
Sol: Export of all countries in 2009 = 270
Export of all countries in 2011 = 375
Difference = 105
Percentage increase = 270 × A/100 = 105
Direction for Questions (36 to 40): Study the table carefully
and answer the questions that follow:
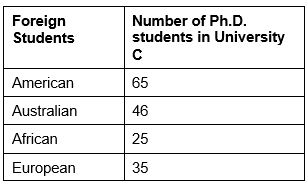
Consider the following two tables (I and II) in which table 1 shows the percentage of students who joined and successfully completed the Ph.D. programme from the Universities A to G and table II shows the number of foreign Ph.D. students enrolled in the University C. These percentages have been rounded to the nearest whole number. There are a total of 855 Ph.D. students in the University C and a total of 5700 students successfully completed the Ph.D. programme from all the seven Universities together.
In accordance with the tables I and II, answer the questions that follow.
I. Students University-wise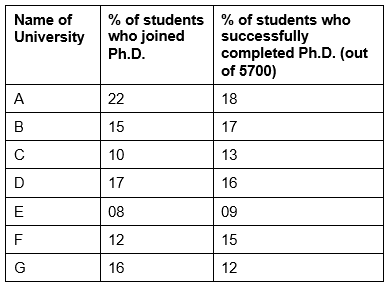
II. Foreign Ph.D. Students in University
Q36: In case, there are 21 African students in University E, then approximately, what is their percentage in that University? (December 2018)
(a) 3%
(b) 5%
(c) 4%
(d) 2%
Ans: (a)
Sol: Total students in university C (10% of total) = 855
Total students who joined Ph.D. in all universities = 855/10 × 100 = 8,550
Total students in E = 8,550 × 8/100 = 684
Percentage of African students = 21/684 × 100 = 3%
Q37: The number of students who completed the Ph.D. programme from Universities A and D together exceeds the number of students who joined the Universities C and E together, by: (December 2018)
(a) 399
(b) 304
(c) 278
(d) 369
Ans: (a)
Sol: Total students who joined successfully completed = 5,700
Students completed from University A = 5,700 × 18/100 = 1,026
Students completed from University D = 5,700 × 16/100 = 912
Students joined University E = 684
Students joined University C = 855
Difference = 1,938 – 1,539 = 399
Q38: What percentage of students in University C is that of foreign students? (December 2018)
(a) 30%
(b) 15%
(c) 20%
(d) 25%
Ans: (c)
Sol: Total students in university C = 855
Total foreign students in university C = 171
Percentage of foreign students = 171/855 × 100 = 20%
Q39: Which University has the highest percentage of students who successfully completed the Ph.D. programme out of the students who joined that University? (December 2018)
(a) C
(b) F
(c) E
(d) B
Ans: (a)
Sol: Total students who joined Ph.D. in all universities = 8,550
Total students who joined successfully completed = 5,700
Total students joined University C = 855
Total students joined University E = 684
Total students joined University F = 8,550 × 12/100 = 1,026
Total students joined University B = 8,550 × 15/100 = 1,283
Students who completed from C = 5,700 × 13/100 = 741
Students who completed from E = 5,700 × 9/100 = 513
Students who completed from F = 5,700 × 15/100 = 855
Students who completed from B = 5,700 × 17/100 = 969
Percentage of C = 741/855 × 100 = 86.6%
Percentage of E = 513/684 × 100 = 75%
Percentage of F = 855/1,026 × 100 = 83.3%
Percentage of B = 969/1,283 × 100 = 75.5%
Q40: What is the ratio of students who successfully completed the Ph.D. programme to the students who joined University G? (December 2018)
(a) 6:11
(b) 9:17
(c) 1:2
(d) 3:4
Ans: (c)
Sol: Total students who joined Ph.D. in all universities = 8,550
Total students who joined successfully completed = 5,700
Total students joined university G = 8,550 × 16/100 = 1,368
Students who completed from G = 5,700 × 12/100 = 684
Ratio = 684:1,368 = 1:2
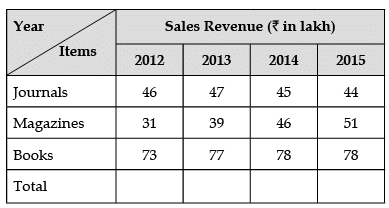
Direction for Questions (41 to 43): Study the table carefully and answer the questions that follow: The table below embodies data on the sales revenue (₹ in lakh) generated by a publishing house during the years 2012-15 while selling books, magazines and journals as three categories of items. Answer the questions based on the data contained in the table.
Q41: In 2015, approximately what per cent of total revenue came from books? (January 2017)
(a) 45%
(b) 55%
(c) 35%
(d) 25%
Ans: (a)
Sol: Total sales in 2015 = 173 lacs
Sales of Books in 2015 = 78 lacs
Percentage of sales revenue from books = 78/173 × 100 = 45%
Q42: The number of years in which there was an increase in revenue from at least two categories of items, is (January 2017)
(a) 0
(b) 1
(c) 2
(d) 3
Ans: (c)
Sol: Sales of Journal increased in the year 2012–2013
Sales of Magazines increased in the year 2012–2013, 2013–2014 and 2014–2015.
Sales of books increased in the year 2012–2013 and 2013–2014.
Q43: If the year 2016 were to show the same growth in terms of total sales revenue as the year 2015 over the year 2014, then the revenue in the year 2016 must be approximately: (January 2017)
(a) ₹ 194 lakh
(b) ₹ 187 lakh
(c) ₹ 172 lakh
(d) ₹ 177 lakh
Ans: (d)
Sol: Total revenue in 2014 = 169 lacs
Total revenue in 2015 = 173 lacs
Growth rate in 2014–2015 = 4 lacs
If growth rate is same in 2015-2016 also, then it will be = 173 + 4 = 177 lacs
Direction for Questions (44 to 46): Study the table carefully and answer the questions that follow:
A University professor maintains data on MCA students tabulated by performance and gender of the students. The data is kept on a computer hard disk, but accidently some of it is lost because of a computer virus. Only the following could be recovered:
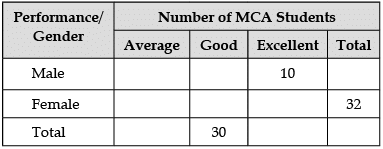 Panic buttons were pressed but to no avail. An expert committee was formed, which decided that the following facts were self evident:
(a) Half the students were either excellent or good.
(b) 40% of the students were females.
(c) One-third of the male students were average.
Q44: How many female students are excellent? (January 2017)
(a) 0
(b) 8
(c) 16
(d) 32
Ans: (a)
Sol: If 40% students are female, which is = 32
Total students = 80
Total male students = 48
Since half of students are good or excellent, it is = 40
If 30 students are good, then 10 students are excellent.
Since 10 male students are excellent, 0 female students are excellent.
Q45: What proportion of female students are good? (January 2017)
(a) 0
(b) 0.25
(c) 0.50
(d) 0.75
Ans: (b)
Sol: Average male students (1/3rd of total) = 16
Good male students = 22
Good Female students = 8
Proportion of Good female students = 8/32 = 0.25
Q46: Approximately, what proportion of good students are male? (January 2017)
(a) 0
(b) 0.73
(c) 0.43
(d) 0.27
Ans: (b)
Sol: Total good students = 30
Good male students = 22
Proportion = 22/30 = 0.73
Direction for Questions (47 to 49): Study the table carefully and answer the questions that follow:
The following table shows the percentage profit (%) earned by two companies A and B during the years 2011–2015. Answer the questions based on the data contained in the table.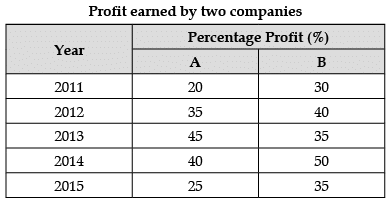

Q47: If the total expenditure of the two companies was ₹ 9 lakh in the year 2012 and the expenditure of A and B were in the ratio 2:1, then what was the income of the company A in that year? (June 2016)
(b) ₹ 8.1 lakh
(c) ₹ 7.2 lakh
(d) ₹ 6.0 lakh
Ans: (b)
Sol: Expenditure for A and B in 2012 = 9 lakhs
Ratio A:B for 2012 = 2:1
Expenditure for A = 9 × 2/3 = 6 lakhs
Profit of A= 6 × 35/100 = 2,10,000
Income = 6,00,000 + 21,000 = 8,10,000
Q48: What is the average percentage profit earned by the company B? (June 2016)
(a) 35%
(b) 42%
(c) 38%
(d) 40%
Ans: (c)
Sol: Average percentage of profit of firm B = 30 + 40 + 35 + 50 + 35/5 = 38%
Q49: In which year, the percentage profit earned by the company B is less than that of company A? (June 2016)
(a) 2012
(b) 2013
(c) 2014
(d) 2015
Ans: (b)
Sol: Profit earned by Company A in 2013 = 45
Profit earned by Company B in 2013 = 35
Direction for Questions (50 to 52): Study the table carefully and answer the questions that follow: The following table shows the number of people in different age groups who responded to a survey about their favourite style of music. Use this information to answer the questions that follow to the nearest whole percentage.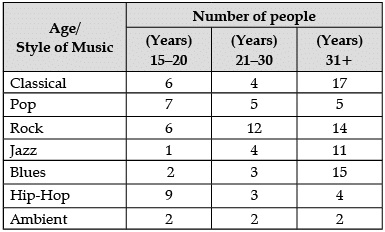
Q50:Approximately what percentage of the total sample were aged 21-30? (June 2016)
(a) 31%
(b) 23%
(c) 25%
(d) 14%
Ans: (c)
Sol: Total sample aged 15–20 = 33
Total sample aged 21–30 = 33
Total sample aged 31 and above = 68
Total population = 33 + 33 + 68 = 134
% of sample aged 21–30 = 33/134 × 100 = 25%
|
17 videos|20 docs|18 tests
|
FAQs on Graphical Representation & Data Interpretation: Previous Years Questions- 1 - Data Interpretation for UGC NET
| 1. What are some common types of graphical representations used in data interpretation? |  |
| 2. How can graphical representations help in understanding complex data sets? |  |
| 3. What is the importance of data interpretation in research and analysis? |  |
| 4. How can one effectively present data using graphical representations? |  |
| 5. What are some common mistakes to avoid when interpreting data through graphical representations? |  |


