UPSC Mains Answer PYQ 2023: Economics Optional Paper 1 | Economics Optional for UPSC PDF Download
Important Note: Answers are written such that they can be produced in the exam like situation in the given time and word limit.
Q1(a): Examine the role of price elasticity of demand in determining the price set by a discriminating monopolist.
Ans: Discriminating monopolist charges different prices for the different units of a commodity.
A discriminating monopolist aims for maximum profits by adjusting supply based on varying demand elasticities in different markets, making price discrimination profitable.
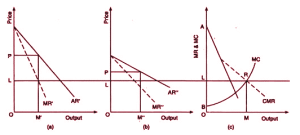
Figure (a) and (b) display the average and marginal revenue for sub-markets A (less elastic) and B (more elastic) with different demand elasticities. In (c), profit-maximizing output is determined.
In markets with more elastic demand, a monopolist risks losing customers because they are more sensitive to price changes. To address this, the monopolist implements a pricing strategy that sets higher prices in markets with less elastic demand, while charging lower prices in markets with more elastic demand.
This strategy is designed to take advantage of the higher willingness of consumers in less elastic markets to pay more, while also reducing the chance of losing customers in more elastic markets where price sensitivity is greater.
Thus, the price elasticity of demand plays an important role in determining the price set by the discrimination monolpolist.
Q1(b): Explain the backward bending supply curve of labour as a choice between income and leisure.
Ans:
Backward sloping labor supply curve
In a backward-sloping labor supply curve, there is initially a direct relationship between labor supply and wages. However, beyond a certain point, higher wages result in a decrease in labor supply.
Backward sloping labor supply curve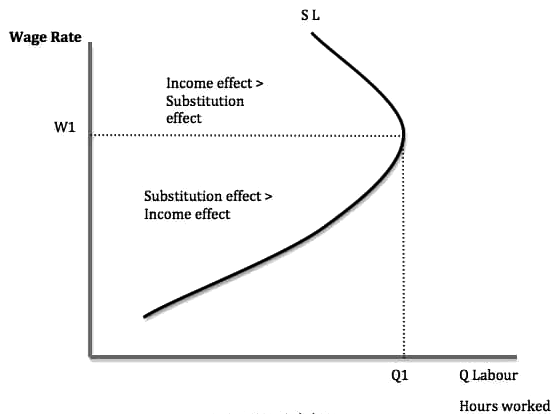
There are two effects determining supply of labor.
- Substitution Effect – Higher wage makes work more attractive than leisure. It increases work hours with rising wages.
- Income Effect – Worker can get enough income by working less. It decreases work hours with rising wages
When the substitution effect outweighs the income effect, the labor supply curve slopes upward, indicating a positive relationship between wages and the amount of labor supplied. However, once wages reach a sufficiently high level, the income effect begins to dominate the substitution effect. Beyond this point, the amount of labor supplied decreases as wages increase.
Q1(c): Explain the major differences between classical and Keynesian macroeconomics.
Ans: Classical and Keynesian macroeconomics offer distinct viewpoints on how economies operate and how economic policies should be formulated. Major differences between them are as follow.
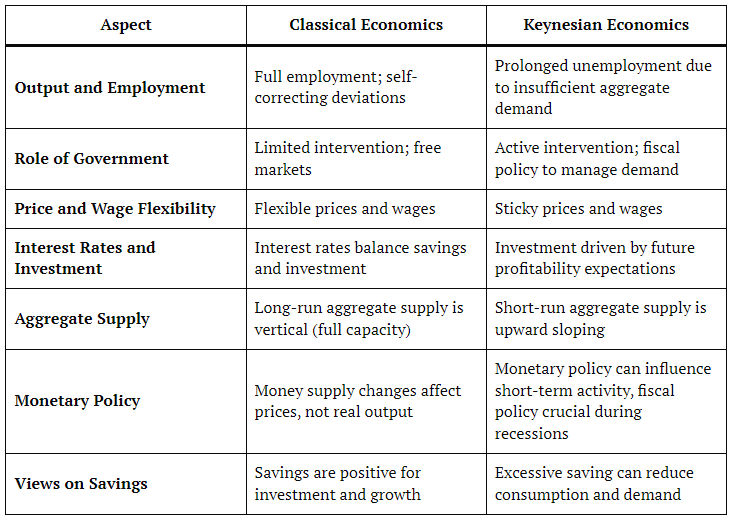
Q1(d): What is meant by internal rate of return in the theory of investment ? What is its importance in deciding whether to accept investment project ?
Ans: IRR is a discount rate that makes the net present value (NPV) of all cash flows equal to zero in a discounted cash flow analysis.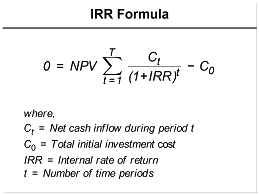
Importance of IRR
- Comparison with Required Rate of Return: A project is considered acceptable if its IRR surpasses the company’s required rate of return or cost of capital.
- Investment Ranking: Projects can be ranked by IRR, with those having higher IRRs being preferred, assuming similar risk levels.
- Financial Viability: An IRR greater than the cost of capital suggests the project creates value for shareholders.
- Break-Even Analysis: The IRR provides a break-even point for the cost of capital, indicating the project's safety margin.
- Decision Rule:
- Accept: If IRR > Required Rate of Return
- Reject: If IRR < Required Rate of Return
Example: For an investment with cash flows: Initial -$100,000, Year 1 $30,000, Year 2 $40,000, Year 3 $50,000, an IRR of 15% (compared to a 10% required return) indicates project acceptance.
Q1(e): Explain why it is considered difficult for open market operations to affect both the availability and cost of credit at the same time.
Ans: Open market operations (OMO) refer to the central bank's (RBI/FED) practice of buying and selling securities in the open market. This tool is used to regulate the money supply and influence interest rates.
However, affecting both the availability and the cost of credit simultaneously can be challenging due to several factors like
- Transmission Mechanism: The process through which OMOs influence the broader economy is complex and involves multiple steps and channels. Thus, it may delay the process
- Variable Lag Effects: The impact of open market operations (OMOs) on the availability and cost of credit can vary over time. While changes in the money supply may quickly influence short-term interest rates, their effects on lending volumes and overall economic activity may take longer to manifest.
- Overdependence of banks on deposits: In the Indian banking context, the banking sector's heavy reliance on consumer deposits can influence the effectiveness of OMOs.
- Liquidity Trap: In a liquidity trap, excess reserves hoarded by banks mean injecting more liquidity doesn’t decrease borrowing costs or increase lending activity.
These dynamics highlight the challenges central banks face in using OMOs to precisely affect both the availability and cost of credit at the same time.
Q2(a): Explain the Cournot model of duopoly using reaction functions and interpret it as a Nash equilibrium.
Ans: Cournot’s model is duopoly model.
Assumptions
- Two firms with identical cost and identical product.
- Each firm acts on the assumption that its competitor will not change its output irrespective of its decisions.
- For simplification assume cost is 0.
Model
In the Cournot model, each firm decides its optimal output level by considering the expected output of the other firm. These decisions are expressed through reaction functions.
Firm 1’s Reaction Function:
𝑞 1 = 𝑅 1 ( 𝑞 2 )
Firm 2’s Reaction Function:
q 2 =R 2 (q 1 )
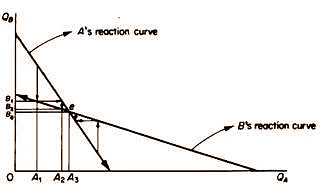
Cournot’s equilibrium is found at the intersection of the two firms’ reaction curves. Consider Firm A producing a quantity A1 lower than the equilibrium quantity Ae. Firm B reacts by producing B1, assuming Firm A will keep producing A1. Then, Firm A responds by increasing its output to A2, assuming Firm B stays at B1. Firm B then reduces its quantity to B2B.
This action-reaction cycle persists because the firms naively fail to learn from their rival's past reactions. This iterative adjustment process continues until it eventually reaches the equilibrium point e.
Nash Equlibrium Interpretation of Cournot Model
A Nash equilibrium occurs when no player can benefit by altering their own strategy while keeping the strategies of others unchanged. In the Cournot model, this equilibrium is achieved when each firm's output decision is optimal given the output of the other firm. At this point, neither firm can increase its profit by unilaterally adjusting its output. The equilibrium is represented by the intersection of the reaction functions.
Q2(b): “Perfect competition is incompatible with increasing returns to scale.” Examine the statement.
Ans: In perfect competition, firms operate as price takers, meaning they have no influence over the market price and produce where marginal cost equals marginal revenue. In the long run, each firm produces at the lowest possible average cost. It is assumed that there are decreasing returns to scale and rising costs, which results in an upward-sloping marginal cost curve. This upward slope ensures that no single firm can dominate the entire market.
Increasing Returns to Scale and Perfect Competition
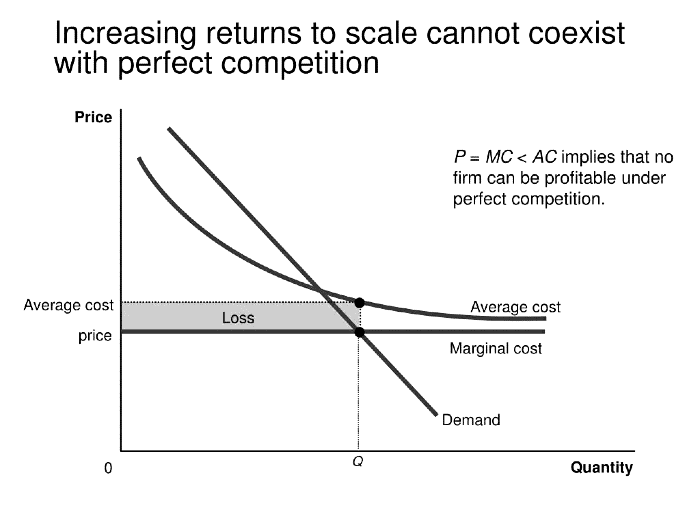
If a firm is experiencing increasing returns to scale, its average costs decrease. However, in perfect competition, firms are already assumed to be operating at their lowest possible average cost. If increasing returns to scale were present, a firm could produce at even lower costs as it expands. This would disrupt the conditions of perfect competition, as some firms would have lower costs than others, gaining a competitive advantage and potentially influencing prices. If a single firm continued to expand, it could dominate the entire market. Therefore, increasing returns to scale are not compatible with the characteristics of perfect competition.
Q2(c): Describe a model of oligopoly that explains price stickiness.
Ans: In Kinked demand curve price elasticity of demand is different at different region. It is seen in the oligopoly market. This model was given by Sweezy.
Assumptions
- Oligopoly market.
- Rival firms will respond to decrease in price but not to increase in prices.
- Products are substitute.
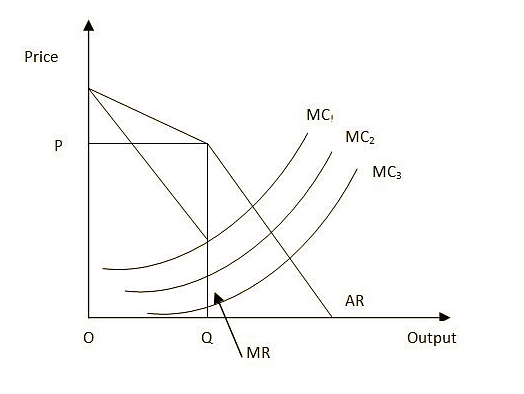
Assume the market is in equilibrium at price p* and quantity q*. If a single firm decides to raise its prices, other firms may not follow suit, causing the firm to lose market share. As a result, the demand curve becomes more elastic above price p*.
If single firm decreases price, other firms will also follow it to prevent the loss of market share. Hence demand curve is inelastic below price p*.
Thus under the kinked demand curve for range of marginal cost, firms has no incentives to change prices. Kinked demand curve is not model of price determination. Kinked demand curve just explains price stickiness. However, it fails to explain to determine exact price and quantiy.
Q3(a): “Under rational expectation hypothesis, systematic monetary policy is ineffective.” Explain the above statement using a suitable model.
Ans: Rational expectation hypothesis was proposed by Lucas.
Assumptions
- People form rational expectation on the basis of all available information
- People are able to judge impact of systematic policies
Model
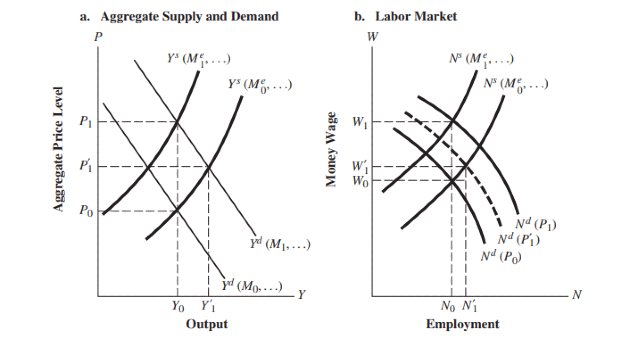
Lucas said that economic agent will form expectation on the basis of all available information.
Suppose the initial equilibrium is at price level P0, output Y0, and employment N0. If there is a systematic increase in the money supply, it will boost demand and drive prices up from P0 to P1'. This rise in the price level will increase the value of the marginal product of labor, shifting labor demand outward and leading to higher employment. However, because the increase in the money supply is systematic and anticipated, economic agents will adjust their behavior accordingly. This adjustment results in a shift in labor supply, which causes output to decrease. Consequently, despite the systematic increase in the money supply, output and employment will remain the same at the higher price level. Therefore, systematic monetary policy will be ineffective and should be avoided.
Q3(b): In the IS-LM framework, the effectiveness of monetary and fiscal policies depend on the interest elasticity of investment. Explain.
Ans:
The IS curve illustrates the relationship between income and interest rates when the goods market is in equilibrium, while the LM curve shows the relationship between income and interest rates when the money market is in equilibrium. The equilibrium is found at the point where the IS and LM curves intersect.
Interest elasticity of investment and effectiveness of monetary and fiscal policies
The interest elasticity of investment refers to the responsiveness of investment to changes in interest rates. A greater interest elasticity of investment results in a flatter IS curve.
Effectiveness of Monetary Policy
Increasing the money supply shifts the LM curve from LM0 to LM1. This expansionary monetary policy lowers interest rates, which in turn stimulates investment.
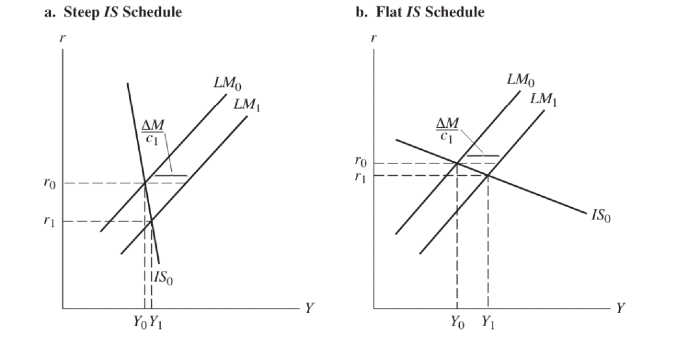
Given that investment is relatively inelastic to interest rate changes, this policy has a minor impact on output when the IS schedule is steep (part a). A decrease in interest rates does not substantially increase investment, resulting in only a modest rise in output.
Conversely, when investment is highly responsive to changes in interest rates (i.e., it is relatively elastic), the policy has a more pronounced effect when the IS curve is relatively flat (as shown in part b). A reduction in interest rates leads to a substantial increase in investment, which significantly boosts output.
Hence, monetary policy is effective when investment is interest elastic.
Effectiveness of Fiscal Policy
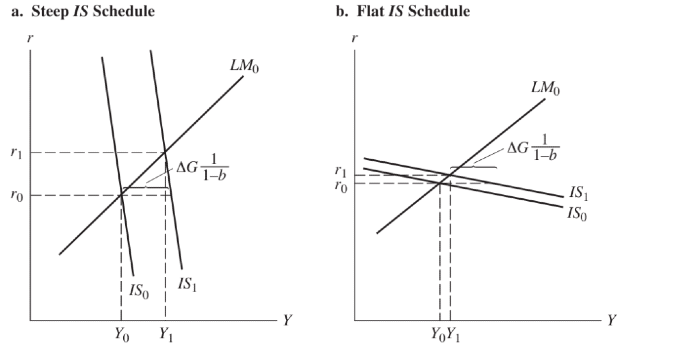 In each segment of the figure, an upward shift in government spending moves the IS schedule from IS0 to IS1. Rise in government spending also increases interest rate and thus reduction in investment.
In part a, the IS curve is steep, indicating that investment is not very responsive to interest rate changes. Consequently, a rise in interest rates has little effect on investment, leading to a significant increase in income from expansionary fiscal policy.
In contrast, part b features a relatively flat IS curve, where investment is more sensitive to interest rate changes. Here, a rise in interest rates significantly affects investment, making the impact of the fiscal policy considerably weaker.
Hence fiscal policy is effective when investment is interest inelastic.
Q3(c): How important is speculative demand for money in achieving unemployment equilibrium in the Keynesian model ? Discuss.
Ans: At low interest rates, there is a potential for interest rates to rise, leading to an anticipated capital loss on bonds. This expected loss may outweigh the interest income from bonds, making money a more attractive asset compared to bonds, which is known as speculative demand for money.
In his analysis, Modigliani demonstrated that wage rigidity alone is sufficient to explain the occurrence of involuntary unemployment.
Lets say there is no speculative demand. In this case Money demand will become interest inelastic.
MS = Md = KPY
Thus change in money supply will result into change in price level. That means prices are flexible.
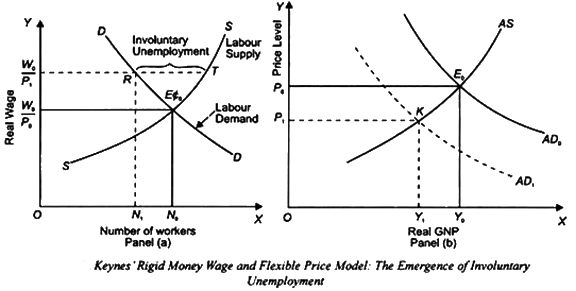 Suppose there is a shock that reduces aggregate demand. With flexible wages, adjustments in prices and wages would ensure that employment and output remain unchanged. However, with rigid wages, real wages will increase due to changes in the price level. As illustrated in the figure above, this results in involuntary unemployment (RT). The labor market will not be in equilibrium, leading to employment and output being lower than their natural levels. Thus, even in the absence of speculative demand for money, wage rigidity can still lead to involuntary unemployment.
Reasons for wage rigidity
- Money illusion on part of workers
- Presence of contracts
- Pressure from labor unions
- Minimum wages law.
Q4(a): Explain the concept of “sterilization” in the context of monetary approach to balance of payments.
Ans: Sterilization is a key concept in the monetary approach to balance of payments. It involves central banks taking specific actions to offset the effects of their interventions in the foreign exchange market on the domestic money supply. Essentially, sterilization consists of deliberate measures by central banks to neutralize the impact of their foreign exchange transactions on the domestic money supply.
Mechanism of Sterilization:
- Foreign Exchange Intervention: Central banks intervene in the foreign exchange market by buying or selling domestic currency to influence exchange rates.
- Impact on Domestic Money Supply: These interventions alter the domestic money supply. For instance, purchasing foreign currency injects domestic currency into circulation, increasing the money supply.
- Sterilization Operations: To counteract this effect, central banks perform compensatory transactions in the domestic money market. For example, they might sell government securities to absorb surplus liquidity and stabilize domestic monetary conditions.
Objectives of Sterilization:
- Maintaining Domestic Monetary Stability: Sterilization aims to preserve domestic monetary stability, including interest rates and inflation, while pursuing exchange rate objectives.
- Preventing Economic Disruptions: By controlling the money supply, sterilization helps avoid economic disruptions that might result from changes in the money market.
Effectiveness and Challenges:
- Effectiveness: Sterilization enables central banks to pursue exchange rate goals without jeopardizing domestic policy objectives.
- Challenges: Factors like capital flows and investor sentiment can make sterilization efforts more complex. Additionally, there are costs involved, such as transaction expenses and potential gains or losses from fluctuations in interest rates.
Sterilization is a critical tool for central banks in the monetary approach to balance of payments, allowing them to manage domestic monetary conditions while influencing exchange rates through interventions in the foreign exchange market.
Q4(b): Tax burden is distributed between buyers and sellers in the ratio of elasticities of demand and supply. Explain.
Ans: The tax burden is shared between buyers and sellers according to the ratio of the elasticities of demand and supply.
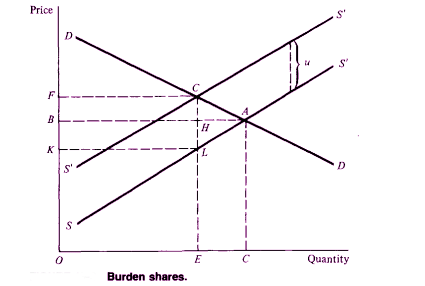
The overall tax burden is shown as KFGL. This burden is distributed between buyers and sellers, with buyers bearing BFGH and sellers shouldering KBHL.
The elasticity of demand (ed) measures the percentage change in quantity demanded relative to the percentage change in price.
The elasticity of supply (es) measures the percentage change in quantity supplied relative to the percentage change in price.
From the above figure:
ed = Q1Q0 / FB
es = Q1Q0 / BK
Thus, es / ed = FB / BK
The tax burden borne by buyers relative to that borne by sellers can be expressed as BFGH / KBHL = FB * BH / BH * BK = FB / BK.
These equations illustrate how the tax burden is distributed between buyers and sellers in proportion to the elasticities of demand and supply.
Q4(c): Discuss Friedman’s restatement of Quantity Theory of Money. Under what conditions, it reduces to classical Quantity Theory of Money ? Explain.
Ans: Friedman recognized the role of money not only for transactions but also for asset holding. He suggested that total wealth can be held in various forms, and the composition of this wealth is influenced by the returns on these assets.
On the basis of above assumption Friedman’s money demand function can be written as
Md = F(P, Y, rb, re, rd)
where P = price level
Y = real income
rb = nominal interest rate on bonds
re = nominal return on equities
rd = nominal return on durable goods
It can be restate as Cambridge equation
Md = K( rb, re, rd)PY
In Equilibrium Money supply is equal to money demand thus
Ms = Md = K( rb, re, rd)PY
An external increase in the money supply will either result in an increase in PY or lead to decreases in rb, re, and rd. According to Friedman, the money demand function is stable, so most of the impact of a change in the money supply manifests as a change in PY.
Conditions Under Which It Reduces to the Classical Theory
Friedman’s restatement of the Quantity Theory of Money simplifies to the classical version under specific conditions:
Constant Velocity of Money: If the velocity of money (the rate at which money circulates in the economy) is constant, then any change in the money supply ( M ) directly impacts nominal GDP (PY). Velocity (V) is defined as V = PY/M
A stable ( V ) means the relationship between money supply and nominal GDP is direct.
Stable Money Demand: If money demand depends only on income and prices, expressed as Md=kPY where k is constant, then changes in the money supply result in proportional changes in the price level P, assuming that output Y is at full employment.
Short-Run Neutrality: When the economy is at or close to full employment in the short term, alterations in the money supply primarily impact the price level rather than output. This supports the classical perspective that money is neutral concerning real variables over the long term.
These conditions highlight a direct and proportional relationship between the money supply and price levels, similar to the classical Quantity Theory of Money.
Q5(a): Factor intensity reversal is incompatible with Heckscher-Ohlin model. Examine this statement.
Ans: The Heckscher-Ohlin (HO) model suggests that a country will export goods that require the intensive use of its relatively abundant factor and will import goods that require the intensive use of its relatively scarce factor.
Factor intensity reversal
Factor-intensity reversal refers to the situation where a given commodity is the L-intensive commodity in the L-abundant nation and the K-intensive commodity in the K-abundant nation.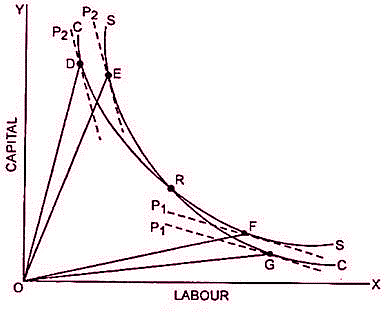
At point D commodity X is labor intensive and at point G it is capital intensive. In such case HO theorem brakes as both the countries will try to export same commodity.
Leontief paradox and factor intensity reversal
The USA is a capital-abundant country, so Leontief expected it to export capital-intensive goods and import labor-intensive ones. However, the USA was actually exporting labor-intensive goods, which contradicts the HO theorem. This suggests that a factor intensity reversal might have occurred.
Q5(b): Why depreciation of a currency is inflationary ? Explain.
Ans:
Currency depreciation is inflationary for several reasons:
- Imported Inflation: When the currency depreciates, the cost of imported goods and services increases, leading to higher prices for everyday items and directly contributing to inflation.
- The J-Curve theory posits that immediately following a depreciation, the trade balance may deteriorate before improving. This occurs because prices of imports rise quickly, but export volumes and prices take longer to adjust.
- Cost-Push Inflation: Domestic producers who depend on imported materials experience higher production costs, which are typically passed on to consumers as increased prices.
- Wage-Price Spiral: Higher living costs caused by expensive imports can lead to wage demands. If businesses agree to these demands, they might raise prices to offset the higher wage expenses, resulting in a cycle of increasing wages and prices.
- Inflation Expectations: If people expect ongoing inflation due to currency depreciation, they might increase spending now, further driving up prices.
Thus, depreciation leads to higher import costs, increased production expenses, wage hikes, and inflation expectations, all contributing to overall inflation.
Q5(c): Can Kuznet’s hypothesis of an inverted U-curve be extended to analyse environmental degradation ? Explain.
Ans: Kuznets' inverted U hypothesis examined how economic growth impacts income distribution. According to Kuznets, as income rises, inequality first increases and then decreases. This concept can also be applied to environmental degradation, where it initially worsens with growth but eventually improves.
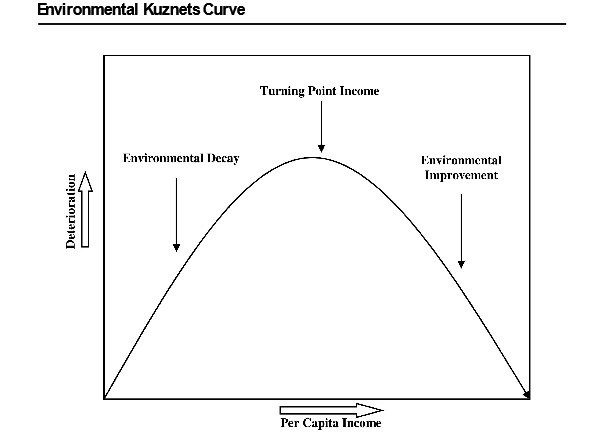
Causes for increase in environmental degradation
In the first part, industrial income rises and agricultural income falls. It increases environmental degradation by industries. Also in the initial stages income is low to adapt clean energy technologies. Thus there is dependence on polluting energy sources. Hence environmental degradation increases with income
Causes for decreased inequalities
During this period, the service sector begins to replace the manufacturing sector. The service sector is less polluting compared to industries. Additionally, as income rises, investment in clean technology grows, which contributes to reducing environmental degradation.
Thus with increased income environmental degradation first increases and then reduces.
Q5(d): Explain how modified HDI is an improved measure of development over HDI.
Ans: The Human Development Index (HDI) is a composite measure used to rank countries by their level of human development. It combines three essential dimensions: health (life expectancy at birth), education (average years of schooling and expected years of schooling), and standard of living (gross national income per capita).
Inequality Adjustment
The Modified Human Development Index (MHDI) addresses the limitations of the traditional Human Development Index (HDI) by including adjustments for inequality. This provides a more accurate representation of human development by reflecting disparities within a country.
Environmental Sustainability
In contrast to the HDI, the MHDI includes metrics for environmental sustainability, such as carbon footprint and renewable energy use. This approach ensures that development is sustainable and takes into account long-term ecological effects.
Gender Inequality
The MHDI includes measures of gender inequality, capturing disparities in health, education, and economic status between men and women. This provides a more comprehensive view of societal progress.
Quality of Life Indicators
The MHDI enhances the assessment of quality of life by including indicators like life satisfaction, mental health, and housing quality, which are not covered by the traditional HDI.
Cultural & Societal Factors
The MHDI takes into account cultural and societal aspects, providing a comprehensive perspective on development. It includes metrics for social cohesion and community involvement, offering a more detailed understanding of human well-being.
These enhancements make the MHDI a more comprehensive and equitable measure of human progress compared to the traditional HDI, better reflecting the complexities and multifaceted nature of development.
Q5(e): How renewable energy use can help attain environmental sustainability ? Explain.
Ans:
Renewable energy, often referred to as clean energy, comes from natural sources or processes that are constantly replenished. For example : wind energy, solar energy, etc. It is going to play important role in future economics.
- Greenhouse Gas Reduction: Renewable energy combats climate change by lowering greenhouse gas emissions, thereby improving environmental sustainability.
- Resource Conservation: In contrast to limited fossil fuels, renewable resources are plentiful and sustainable, helping to conserve natural resources for future generations.
- Economic Efficiency: Investments in renewables drive technological innovation, enhancing economic competitiveness and efficiency.
- Energy Security: Decreased reliance on imported fossil fuels enhances energy security and reduces geopolitical risks.
- Positive Externalities: Transitioning to renewables addresses negative externalities of fossil fuels, such as pollution and health costs.
- Long-Term Sustainability: Renewable energy supports a sustainable economic framework by aligning economic growth with environmental preservation.
Thus it can be said that renewable energy sources could help us to attain environmental sustainability.
Q6(a): Consider the market for good X for Country 1 and Country 2. The supply and demand functions for Country 1 are given as P = Q + 70 and P = 170 – Q, while that of Country 2 are given as P = 10 + Q and P = 110 — Q. Assume that there are two countries in the world and trade is balanced. Free trade price is stabilized in between autarky prices of both the countries. Based on the above information, answer the following questions :
(i) From the free trade price and zero transportation cost, if the importing country imposes an import quota of 50 units, determine the quantity of good X produced and consumed. Calculate the consumer and producer surplus and protection cost due to import quota.
(ii) From the free trade price, assume that the importing country is small and consider an import tariff of Rs. 10 per unit on good X. Calculate the impact on consumer surplus, producer surplus and government revenue. Does this policy increase national welfare ?
Ans:
Country 1
Supply : P = Q1 + 70 & Demand: P = 170 – Q1
Country 2
Supply : P = 10 + Q2 & Demand: P = 110 – Q2
Equilibrium without trade
Demand = supply
Hence,
P1 = 120 & P2 = 60
Good is cheaper in country 2. So country 2 will export to country 1.
Equilibrium in Free Trade
QD1 – QS1 = QS2-QD2 = Imported Quantity = Exported Quantity
240-2P = 2P – 120
P = 90 & QD1-QS1 = 60
QS1 = 20, QD1 = 80
QS2 = 80, QD2 = 20
(I) Import Quota
Hence QS1 + 50 = QD1
P-70 + 50 = 170 – P
P = 95
QS1 = 25
QD1 = 75
We have assumed that there is no quota rent so in the following region protection cost is total deadweight loss.
Producer Surplus
Producer surplus is non shaded area (Gain) = 205 (Area of rectangle) + 55/2 (Area of triangle) = 112.5
Consumer Surplus
Consumer Surplus (loss) is shaded area + non shaded area = -(575 (Area rectangle) + 55/2 (Area of traingle) = – 387.5
Protection Cost/DeadweightLoss
Consumer Surplus (Loss) + Producer Surplus (Gain) = -387.5 + 112.5 = -275
(I) Import Tariff
Producer Surplus (Gain) = A = 1020 (Rectangle) + (1010)/2 (Triangle) = 250
Government Revenue (Gain) = C = 40*10 = 400
Consumer Surplus (Loss) = A + B + C + D = -(250 + 400 + (1010)/2 + (1010)/2) = -750
Dead weight loss = Consumer Surplus (Loss) – Government Revenue (Gain) – Producer Surplus (Gain) = B + D = -100
With an import tariff, the deadweight loss is lower than with an import quota. Consequently, the import tariff improves national welfare more than the import quota. However, both policies result in a reduction of national welfare compared to free trade.
Q6(b): “A continuous process of innovation and invention would give rise to trade even between countries with similar factor endowments and tastes.” Examine the statement.
Ans: Posner argues that technological change is an ongoing process. He suggests that even if countries have similar factor proportions and preferences, the continuous advancements in inventions and innovations can still lead to trade. This concept can be illustrated using the product life cycle model.
Product Life Cycle Model
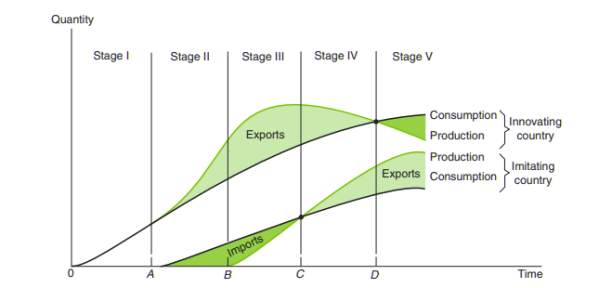
Stages of product life cycle model
- In stage I (time OA), the product is produced and consumed only in the innovating country.
- In stage II (AB), production is perfected in the innovating country and increases rapidly to accommodate rising demand at home and abroad.
- In stage III (BC), the product becomes standardized and the imitating country starts producing the product for domestic consumption.
- In stage IV (CD), the imitating country starts underselling the innovating country in third markets, and in stage V (past point D) in the latter’s market as well.
New technologies and compression of life cycle
The new technologies of the Fourth Industrial Revolution are merging the physical, digital, and biological aspects of global production systems. This revolution has brought about agile development, which significantly shortens development times. Additionally, the speed of consumption and delivery has greatly increased.
Thus due to reduction in production and delivery of new product in new technologies has led to compression of life cycle.
Q6(c): Examine the significance of external economies and product variety in the context of international trade theory.
Ans: External economies and product variety are crucial concepts in international trade theory, particularly within the frameworks of New Trade Theory (NTT) and New Economic Geography (NEG). Let's explore their importance within these theories:
New Trade Theory (NTT):
- In NTT, external economies and product variety contribute to the explanation of trade patterns and the gains from trade.
- External economies, such as knowledge spillovers and specialized labor markets, lead to the clustering of industries in specific locations. This clustering creates agglomeration effects, where firms benefit from sharing common inputs, infrastructure, and information.
- Clustering boosts productivity and lowers costs, enhancing the competitiveness of industries in global markets. This effect is explained by economies of scale and increasing returns to scale, which are key elements of NTT.
- Product variety is essential in NTT because it influences consumer preferences and buying habits. Companies differentiate their products to gain market share, resulting in trade driven by product differentiation rather than by comparative advantages in factor endowments.
- NTT suggests that countries with a wide range of products and industries benefiting from external economies will trade to leverage their comparative advantages in product differentiation and economies of scale
New Economic Geography (NEG):
- In NEG, external economies play a vital role in explaining the spatial distribution of economic activity and the formation of regional disparities.
- Agglomeration effects, fueled by external economies, result in the clustering of economic activities in specific regions or cities. These areas become more productive and draw additional investment and economic activity, thereby strengthening the agglomeration process.
- Product variety contributes to the attractiveness of agglomerated regions by providing diverse consumer choices and stimulating demand. Regions with a wide range of products and services become more attractive to both consumers and firms.
- NEG forecasts that trade and migration patterns are shaped by agglomeration forces, as businesses and individuals aim to settle in areas with external economies and a wide range of product options.
This highlight the importance of agglomeration effects, innovation, and consumer preferences in shaping global trade dynamics and the spatial distribution of economic activity.
Q7(a): Human capital and components of research and development are determining factors of economic growth. Explain using appropriate endogenous growth model.
Ans: Human capital refers to the skills, education, abilities, and attributes of the workforce that impact their productivity. The integration of R&D and human capital can be demonstrated using the following growth equation.
Y = AK
Where A is a positive constant representing the level of technology.
Here, K is broadly defined to include both physical and human capital, assuming away diminishing returns to capital in the AK production function.
Output per capita is y = Y/L = A*(K/L) = Ak
where k is per capita capital K/L
Now Δk = I = Saving (S) – Depreciation (D)
We know that S = sY & D = dK
∆K = I = sY – dK
We can rewrite this as
sY = K(∆K/K) + dK
At steady state, ∆K/K = ∆Y/Y = n
Thus sY = (n+d)K
but Y/K = A
Hence sA = (n + d)
In the AK model, an increase in capital leads to a proportional rise in income.
If sA > n + d, capital continues to grow indefinitely. Consequently, technological progress, driven by investments in human capital and R&D, counteracts the diminishing returns to physical capital.
Empirical evidence also supports this theory. ASEAN, South Korea, and Japan’s experiences suggest that investment in R&D and human capital ensures sustainable development in the long run.
Q7(b): Explain the concept of steady-state in the context of Solow model.
Ans: In the Solow model, the steady-state is a condition of balanced growth where essential economic variables, including output per capita (income), capital per capita, and consumption per capita, increase at constant rates over time. At this point, the economy achieves a stable equilibrium where the growth rate of output matches the growth rates of the labor force and technological progress.
Solow Growth Model & Steady State
The production takes place according to the linear homogeneous production function of the first degree of the form
Y = A*F (K, L)
Where Y = Output, K = Capital Stock, L = Supply of labor force, and A = Technology
In per capita terms, it can be expressed as
y = A*F(k)
where y is per capita income and k is per capita capital
Δk = I = S – D
where I is investment, S is saving, and D is depreciation
Now S = sY where s is MPS
D = dk
Δk*k/k = sy – dk
Now in steady state Δk/k = Δy/y = ΔL/L = n
thus
sy = (n+d)k
Thus, steady state requires investment growth (n+d)k
If planned saving (sy) > required saving (n+d)k then it will increase capital per worker hence economy will grow at higher rate than steady rate. This higher growth rate will taper off as diminishing returns operate thus steady state will reach.
With a constant saving rate, the growth rate will not rise in the long run. Therefore, technological growth becomes crucial for boosting per capita income. As technology advances, it increases A, which shifts the production function upward and leads to higher per capita income.
Q7(c): What is the golden rule of capital accumulation ? Explain it using a growth model.
Ans: The Solow model indicates that an increase in the saving rate raises capital per capita, which in turn leads to higher per capita income. However, a higher saving rate is not always beneficial, as the goal is to enhance consumption and improve living standards for people.
Golden Rule of Capital Accumulation
The per capita capital that maximizes consumption is called as golden rule level of capital. For it, we have to find out steady state saving which maximizes consumption per worker.
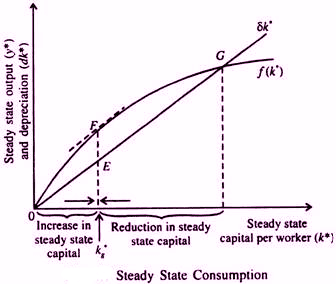
y = c + i
Consumption is maximized when dc/dk = 0
thus
dy/dk = di/dk
in equilibrium i = (n+d)k
Hence dy = n+d
In order to reach the Golden Rule steady state, the economy needs to have an ideal saving rate, which should not be too high or too low. Any change in the saving rate will alter the saving curve, leading the economy to transition to a new steady state with lower consumption levels compared to the original steady state.
Q8(a): How important is rent from extraction of renewable and non-renewable resources to distinguish between Net Domestic Product (NDP) and Environmentally adjusted Domestic Product (EDP). Will the distinction be valid if we have an economy with only renewable resources and the economy reaches the point of maximum sustainable yield ?
Ans: Resource extraction rent is an important factor in distinguishing between Net Domestic Product (NDP) and Environmentally Adjusted Domestic Product (EDP). NDP represents the net output after accounting for capital depreciation and includes income from resource extraction. On the other hand, EDP adjusts for environmental costs, providing a more accurate reflection of the true economic value.
Impact on the Distinction:
- Non-Renewable Resources: Rent from non-renewables like oil or minerals directly reflects their depletion. Higher rent in NDP indicates a larger resource extraction, leading to a significant difference between NDP and EDP.
- Renewable Resources: For sustainably managed renewables like wind or properly managed forestry, the rent might be lower as the resource is not being depleted. However, even with renewables, there could be environmental impacts (habitat loss from wind farms, for example).
Economy With Only Renewable Resources
In an economy that depends entirely on renewable resources and operates at the maximum sustainable yield (MSY), the difference between Net Domestic Product (NDP) and Environmental Domestic Product (EDP) becomes less significant but remains relevant. Although renewable resources can regenerate over time, their extraction and use still incur environmental costs such as habitat destruction, biodiversity loss, and ecosystem disruption. These costs need to be considered in EDP calculations.
Furthermore, reaching the point of MSY indicates that the economy is extracting renewable resources at a rate that allows them to be replenished over time without compromising the ecosystem’s ability to support future generations. However, this doesn’t eliminate the need to account for the environmental impacts of resource extraction, as there may still be trade-offs and externalities associated with resource use.
Q8(b): “Balanced and unbalanced growth strategies are not substitute but complementary to each other” Discuss.
Ans: According to balanced growth strategy there should be simultaneous development of different sectors of the economy so that all sectors grow in unison. According to it rise of demand for one good raises demand for other goods.
On other hand unbalanced growth suggest deliberate unbalancing of the economy. Rather than investing in all sector there should be investment in selected sectors.
Both the theories are complementary in nature in the sense that unbalanced growth is mean to achieve balanced growth.
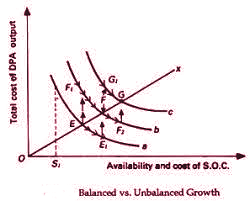
The first development sequence is EF1FG1, while the second sequence is EE1F2G. The first sequence represents development through addressing shortages, whereas the second sequence involves development through utilizing excess capacity. However, the end path OX represents a balanced growth path.
Thus balanced and unbalanced growth strategies are not substitutes but complementary to each other.
Q8(c): “Income inequality is not a cause of concern as long as per capita income is rising.” Critically examine this statement.
Ans:
Relation between Income inequality and growth of per capita income is one of the most debated and research topic in India.
Arguments in the favor of above statement
- The Kuznets curve hypothesis, introduced by Kuznets, posits that inequality may increase during the early stages of economic development but eventually stabilize or decrease. According to this hypothesis, rising per capita income, despite initial inequality, could result in a more equitable distribution over time. However, the accuracy of this hypothesis is subject to debate.
- Bhagwati prioritizes growth over distribution, advocating for liberalization, privatization, and foreign trade to reduce poverty and inequality through increased employment, government revenue, and targeted social welfare spending
- Income inequality can act as a catalyst for innovation and entrepreneurship. The potential for higher earnings may encourage individuals to invest in education, skill enhancement, and creative ventures, which in turn drives economic advancement.
- Inequality can reflect differences in productivity and effort among individuals. In a meritocratic society, those who contribute more to the economy may rightfully earn higher incomes, leading to a more efficient allocation of resources.
- Becker argues that inequality can be a result of individual choices and investments in human capital (education, skills). He suggests focusing on policies that enhance human capital formation to promote economic mobility.
- Some believe that economic growth at the top will eventually benefit those at the bottom as wealth is reinvested or spent, leading to job creation and opportunities. However, this idea is often debated and is not always reliable.
Arguments against the of above statement
- An increase in per capita income doesn’t ensure that everyone benefits equally. The benefits may be concentrated at the top, with a significant portion of the population continuing to struggle despite overall average gains.
- High levels of inequality can foster resentment and social unrest. Those who feel excluded may become disillusioned with the economic and political systems, potentially leading to instability. For example, this is seen in the Left Wing Extremism in India.
- Krugman highlights the social and political consequences of inequality. He argues that high inequality can lead to social unrest and political instability, ultimately harming the economy.
- Sen have argued against the above statement. He preferred distribution first. Sen emphasizes building capability through education and health investment, contrasting Bhagwati’s growth-first approach. He advocates for immediate state investment in education and health for inclusive growth, while acknowledging infrastructure’s importance.
- Severe income inequality can restrict opportunities for individuals born into poverty. Limited access to education, healthcare, or financial resources can make it more challenging for them to advance economically.
- Nobel laureate Stiglitz argues that extreme inequality impedes economic growth. He notes that when a substantial portion of income is concentrated among the wealthy, who save a larger percentage of their income compared to those with lower earnings, overall investment is reduced. Furthermore, the lack of opportunities for the lower and middle classes can weaken consumer demand, further obstructing economic growth.
|
66 videos|237 docs|73 tests
|
FAQs on UPSC Mains Answer PYQ 2023: Economics Optional Paper 1 - Economics Optional for UPSC
| 1. What are the key concepts in Economics Optional Paper 1 for UPSC Mains exam? |  |
| 2. How can I prepare effectively for Economics Optional Paper 1 for UPSC Mains exam? |  |
| 3. What are some common mistakes to avoid while answering questions in Economics Optional Paper 1 for UPSC Mains exam? |  |
| 4. How can I improve my writing skills for answering questions in Economics Optional Paper 1 for UPSC Mains exam? |  |
| 5. What are the career opportunities available for candidates with a background in Economics after clearing the UPSC exam? |  |


