


All Exams >
Civil Engineering (CE) >
6 Months Preparation for GATE Civil Engg >
All Questions
All questions of Flood Estimation & Flood Routing for Civil Engineering (CE) Exam
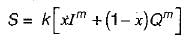
The Muskingum method of flood routing assumes the storage S is related to inflow rate I and outflow rate Q of a reach as S =- a)K[x l - (1 - x)Q]
- b)K[x Q + (1 - x) I]
- c)K[xI + (1 - x)Q]
- d)Kx [l - (1 - x)Q]
Correct answer is option 'C'. Can you explain this answer?
The Muskingum method of flood routing assumes the storage S is related to inflow rate I and outflow rate Q of a reach as S =
a)
K[x l - (1 - x)Q]
b)
K[x Q + (1 - x) I]
c)
K[xI + (1 - x)Q]
d)
Kx [l - (1 - x)Q]

|
Jithin Choudhury answered |
For a given channel reach by selecting a routing interval Δt and using the Muskingum equation, the change in storage is,
S2 - S1 = k(xI2 - I1) + 1 - x(Q2 - Q1)
Where suffixes 1 and 2 refer to the conditions before and after the time interval Δt.
Where suffixes 1 and 2 refer to the conditions before and after the time interval Δt.

In case of channel routing, the storage is a function of
- a)inflow discharge only
- b)both a and c
- c)outflow discharge only
- d)none of the above
Correct answer is option 'B'. Can you explain this answer?
In case of channel routing, the storage is a function of
a)
inflow discharge only
b)
both a and c
c)
outflow discharge only
d)
none of the above
|
|
Sanvi Kapoor answered |
Channel routing (Storage is a function of both Inflow & Outflow, here we use Muskingam Method)
The storm frequency for a peripheral commercial area is ____- a)Once a year
- b)Twice a year
- c)Once in 2 years
- d)Once in a month
Correct answer is option 'C'. Can you explain this answer?
The storm frequency for a peripheral commercial area is ____
a)
Once a year
b)
Twice a year
c)
Once in 2 years
d)
Once in a month
|
|
Jay Menon answered |
The storm frequency for a peripheral commercial area is once in 2 years (option C).
Explanation:
The storm frequency refers to the average number of storms that occur within a specific period in a particular area. It is an important parameter to consider when designing structures and infrastructure to withstand the forces imposed by storms. In this case, we are considering a peripheral commercial area, which typically includes buildings and other structures for commercial purposes.
The given options for storm frequency range from once a year to once in a month. Let's analyze each option to determine the most appropriate frequency for a peripheral commercial area.
a) Once a year: This frequency implies that a storm occurs in the area once every year. While storms can cause damage and disruption, a peripheral commercial area may be able to handle such infrequent events with proper design and maintenance. However, this frequency may still pose a significant risk, especially if the storms are severe.
b) Twice a year: This frequency suggests that storms occur in the area twice every year. This frequency increases the risk and potential damage caused by storms. It may be challenging for a peripheral commercial area to withstand frequent storms, especially if they are intense. Therefore, this option is less likely to be the correct answer.
c) Once in 2 years: This frequency implies that a storm occurs in the area once every two years. This option strikes a balance between the infrequency of storms and the need for resilience in a peripheral commercial area. With a storm frequency of once in 2 years, the area has more time to recover and prepare for the next event. This frequency is a reasonable assumption for designing structures and infrastructure in a peripheral commercial area.
d) Once in a month: This frequency suggests that a storm occurs in the area once every month. This option represents a very high storm frequency, which would pose significant challenges for a peripheral commercial area. Monthly storms could cause frequent damage, disruption, and financial losses. Therefore, this option is less likely to be the correct answer.
Considering the options given, once in 2 years (option C) is the most appropriate storm frequency for a peripheral commercial area. It strikes a balance between infrequency and the need for resilience, allowing the area to recover and prepare adequately for storms.
Shorter the duration of rainfall ____ will be the rainfall intensity.- a)Lesser
- b)Constant
- c)Slightly lesser
- d)Greater
Correct answer is option 'D'. Can you explain this answer?
Shorter the duration of rainfall ____ will be the rainfall intensity.
a)
Lesser
b)
Constant
c)
Slightly lesser
d)
Greater

|
Sharmila Gupta answered |
Explanation:
The intensity of rainfall refers to the amount of rainfall that occurs in a specific time period. It is typically measured in millimeters per hour. The intensity of rainfall is influenced by various factors, including the duration of rainfall.
DURATION OF RAINFALL:
The duration of rainfall refers to the length of time that rainfall occurs. It can vary from a few minutes to several hours or even days. The duration of rainfall is an important factor in determining the intensity of rainfall.
RELATION BETWEEN DURATION AND INTENSITY:
The relationship between the duration of rainfall and the intensity of rainfall can be understood as follows:
1. Shorter Duration: When the duration of rainfall is shorter, it means that the rainfall occurs over a shorter period of time. In this case, the same amount of rainfall is concentrated in a shorter time period, resulting in a higher intensity of rainfall. Therefore, when the duration of rainfall is shorter, the rainfall intensity is greater.
2. Longer Duration: Conversely, when the duration of rainfall is longer, it means that the rainfall occurs over a longer period of time. In this case, the same amount of rainfall is spread out over a longer time period, resulting in a lower intensity of rainfall. Therefore, when the duration of rainfall is longer, the rainfall intensity is lower.
EXAMPLE:
To further illustrate this relationship, consider the following example: If 10 millimeters of rainfall occurs over a duration of 1 hour, the intensity of rainfall would be 10 millimeters per hour. However, if the same amount of rainfall occurs over a duration of 30 minutes, the intensity of rainfall would be 20 millimeters per hour.
This example demonstrates that when the duration of rainfall is shorter, the same amount of rainfall is concentrated in a shorter time period, resulting in a higher intensity of rainfall.
A flood control structure having an expected life of n years is designed by considering a flood of return period T years. When T = n, and n → ∝, the structure's hydrologic risk of failure in percentage is . (round off to one decimal place)- a)25.2
- b)68.4
- c)78.2
- d)63.5
Correct answer is option 'D'. Can you explain this answer?
A flood control structure having an expected life of n years is designed by considering a flood of return period T years. When T = n, and n → ∝, the structure's hydrologic risk of failure in percentage is . (round off to one decimal place)
a)
25.2
b)
68.4
c)
78.2
d)
63.5
|
|
Sanvi Kapoor answered |
Risk of failure = 1 - qn = 1 - (1 - p)n = 1 - (1 - 1/T)n
For T = n → ∝
Risk of failure = 1 - (1/e) = 0.632
% risk of failure = 0.632 x 100 = 63.2%
For T = n → ∝
Risk of failure = 1 - (1/e) = 0.632
% risk of failure = 0.632 x 100 = 63.2%
The standard project flood is- a)smaller than the probable maximum flood
- b)the same as the probable maximum flood
- c)the same as the design flood
- d)larger than the probable maximum flood by a factor implying safety factor
Correct answer is option 'A'. Can you explain this answer?
The standard project flood is
a)
smaller than the probable maximum flood
b)
the same as the probable maximum flood
c)
the same as the design flood
d)
larger than the probable maximum flood by a factor implying safety factor
|
|
Samarth Ghoshal answered |
The flood that would result from a sever combination of meteorological and hydrological factors that are reasonably applicable to the region. Extremely rare combinations of factors are excluded.
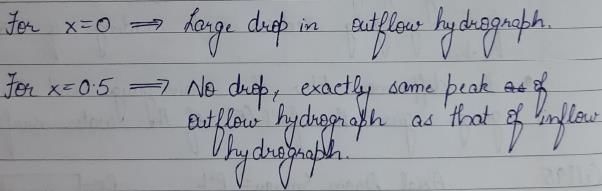
In the Muskingum method of channel routing if x = 0.5, it represents an outflow hydrograph- a)that has reduced peak
- b)with an amplified peak
- c)that is exactly the same as the inflow hydrograph
- d)with a peak which is exactly half of the inflow peak
Correct answer is option 'A'. Can you explain this answer?
In the Muskingum method of channel routing if x = 0.5, it represents an outflow hydrograph
a)
that has reduced peak
b)
with an amplified peak
c)
that is exactly the same as the inflow hydrograph
d)
with a peak which is exactly half of the inflow peak

|
Rishika Sen answered |
When the storm occurs once a year, the rainfall intensity R is ____________- a)R = 300/t0.625
- b)R = 150/t0.625
- c)R = 150/t2
- d)R = 300/t2
Correct answer is option 'B'. Can you explain this answer?
When the storm occurs once a year, the rainfall intensity R is ____________
a)
R = 300/t0.625
b)
R = 150/t0.625
c)
R = 150/t2
d)
R = 300/t2
|
|
Jay Menon answered |
Given:
- The storm occurs once a year.
- The rainfall intensity R is a function of time t.
To find:
The expression that represents the rainfall intensity R.
Solution:
The given options are:
a) R = 300/t^0.625
b) R = 150/t^0.625
c) R = 150/t^2
d) R = 300/t^2
To determine the correct answer, let's analyze each option:
a) R = 300/t^0.625:
If we assume that t represents the time in minutes, the given equation implies that the rainfall intensity decreases as the time increases. This does not align with our understanding that the rainfall intensity should be constant during the storm.
b) R = 150/t^0.625:
The equation R = 150/t^0.625 suggests that the rainfall intensity decreases as the time increases. This aligns with our understanding that the rainfall intensity should decrease as the storm duration increases. Therefore, option B seems to be a reasonable representation of the rainfall intensity during the storm.
c) R = 150/t^2:
The equation R = 150/t^2 implies that the rainfall intensity decreases at a faster rate than option B. This does not align with our understanding that the rainfall intensity should decrease at a slower rate as the storm duration increases.
d) R = 300/t^2:
The equation R = 300/t^2 suggests that the rainfall intensity decreases at a faster rate than option A. This also does not align with our understanding that the rainfall intensity should decrease at a slower rate as the storm duration increases.
Conclusion:
Based on the analysis of the given options, it can be concluded that option B, R = 150/t^0.625, is the most suitable expression to represent the rainfall intensity during the storm.
Kirpich equation is used to determine which one, of the following?- a)Run-off from a given rainfall
- b)Base time of a un it hydrog raph
- c)Time of concentration in run-off hydrograph
- d)None of the above
Correct answer is option 'C'. Can you explain this answer?
Kirpich equation is used to determine which one, of the following?
a)
Run-off from a given rainfall
b)
Base time of a un it hydrog raph
c)
Time of concentration in run-off hydrograph
d)
None of the above
|
|
Manasa Bose answered |
Kirpich equation is an empirical relation used for the estimation of the time of concentration. It is given as,
tc = 0.01947 L0.77 S-0.385
where, tc = time of concentration in minutes
L = maximum length of travel of water (m)
S = slope of the catchment = ΔH/L
ΔH = difference in elevation between the most remote point on the catchment outlet.
tc = 0.01947 L0.77 S-0.385
where, tc = time of concentration in minutes
L = maximum length of travel of water (m)
S = slope of the catchment = ΔH/L
ΔH = difference in elevation between the most remote point on the catchment outlet.
The term ‘mean annual flood’ denote- a)mean of floods in partial-duration series
- b)mean annual flow
- c)a flood with a recurrence interval of 2.33 years
- d)a flood with a recurrence interval of N/2 years, where N = number of years of record
Correct answer is option 'C'. Can you explain this answer?
The term ‘mean annual flood’ denote
a)
mean of floods in partial-duration series
b)
mean annual flow
c)
a flood with a recurrence interval of 2.33 years
d)
a flood with a recurrence interval of N/2 years, where N = number of years of record
|
|
Arnab Saini answered |
Gumbel’s distribution has the property which gives T = 2,33 years for the average of the annual series when N is very large. Thus the value of a flood with 7 = 2.33 years is called the mean annual flood.
A hydraulic structure has been designed for a 50 year flood. The probability that exactly one flood of the design capacity will occur in the 75 year life of the structure is- a)0.02
- b)0.220
- c)0.336
- d)0.780
Correct answer is option 'C'. Can you explain this answer?
A hydraulic structure has been designed for a 50 year flood. The probability that exactly one flood of the design capacity will occur in the 75 year life of the structure is
a)
0.02
b)
0.220
c)
0.336
d)
0.780
|
|
Ashwin Gupta answered |
Solution:
Given: Probability of design capacity flood in 50 years = 1/50
We need to find the probability of exactly one flood of design capacity in the 75-year life of the structure.
To solve the problem, we can use the Poisson distribution formula, which gives the probability of a certain number of events occurring in a fixed interval of time, given the average rate of occurrence.
The formula is:
P(X=k) = (e^(-λ) * λ^k) / k!
where X is the random variable representing the number of events, k is the number of events we want to find the probability for, λ is the average rate of occurrence, and e is the base of the natural logarithm.
Let's calculate the value of λ first:
The expected number of design capacity floods in 75 years is:
λ = (75 / 50) * 1 = 1.5
Now, let's use the Poisson distribution formula to find the probability of exactly one flood of design capacity in 75 years:
P(X=1) = (e^(-1.5) * 1.5^1) / 1! = 0.336
Therefore, the answer is (c) 0.336, which is option (c).
In a homogeneous unconfined aquifer of area 3.00km2, the water table was at an elevation of 102.00 m. After a natural recharge of volume 0.90 million cubic meter (Mm2), the water table rose to 103.20 m. After this recharge, ground water pumping took place and the water table dropped down to 101.020 m. The volume of ground water pumped after the natural recharge, expressed (in Mm2 and round off to two decimal places), is ______.- a)0.5
- b)1
- c)1.5
- d)2.5
Correct answer is option 'C'. Can you explain this answer?
In a homogeneous unconfined aquifer of area 3.00km2, the water table was at an elevation of 102.00 m. After a natural recharge of volume 0.90 million cubic meter (Mm2), the water table rose to 103.20 m. After this recharge, ground water pumping took place and the water table dropped down to 101.020 m. The volume of ground water pumped after the natural recharge, expressed (in Mm2 and round off to two decimal places), is ______.
a)
0.5
b)
1
c)
1.5
d)
2.5
|
|
Lavanya Menon answered |
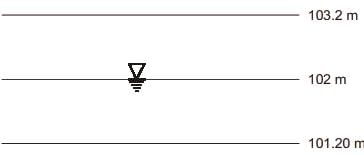
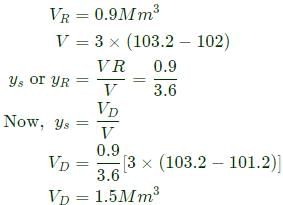
The probable maximum flood is- a)the standard project flood of an extremely large river
- b)a flood adopted in the design of all kinds of spillways
- c)a flood adopted in all hydraulic structures
- d)an extremely large but physically possible flood in the region
Correct answer is option 'D'. Can you explain this answer?
The probable maximum flood is
a)
the standard project flood of an extremely large river
b)
a flood adopted in the design of all kinds of spillways
c)
a flood adopted in all hydraulic structures
d)
an extremely large but physically possible flood in the region
|
|
Sreemoyee Deshpande answered |
The Probable Maximum Precipitation (PMP) may be defined as the maximum depth of precipitation for a given duration that may possibly occur on a given catchment at any time of the year. Hence such a precipitation would result from the possible severest storm that may result from the worst possible combinations of hydrological conditions in the area.
Probable Maximum Flood (PMF) is the extreme flood that is physically possible in a region as a result of severe most combinations, including rare combinations of meteorological and hydrological factors. The PMF is used in situations where the failure of the structure would result in loss of life and catastrophic damage and as such complete security from potential floods is sought.
Probable Maximum Flood (PMF) is the extreme flood that is physically possible in a region as a result of severe most combinations, including rare combinations of meteorological and hydrological factors. The PMF is used in situations where the failure of the structure would result in loss of life and catastrophic damage and as such complete security from potential floods is sought.
The runoff in cumec by the Rational method is defined by ______- a)Q = K*A*I*R
- b)Q = (K+A+I) *R
- c)Q = (K+A) *R
- d)Q = A*I*R
Correct answer is option 'A'. Can you explain this answer?
The runoff in cumec by the Rational method is defined by ______
a)
Q = K*A*I*R
b)
Q = (K+A+I) *R
c)
Q = (K+A) *R
d)
Q = A*I*R
|
|
Lavanya Menon answered |
According to the Rational method, the storm water or runoff is defined by Q = K*A*I*R where, ‘K’ is a constant, ‘A’ is the catchment area in hectares,’I’ is the impermeability factor and ‘R’ is the intensity of rainfall in mm per hour.
Probability of a 10 year flood to occur at least once in the next 4 years is- a)25%
- b)35%
- c)50%
- d)65%
Correct answer is option 'B'. Can you explain this answer?
Probability of a 10 year flood to occur at least once in the next 4 years is
a)
25%
b)
35%
c)
50%
d)
65%
|
|
Sravya Tiwari answered |
Probability corresponding to 10 year return period is,
P = 1/10 = 0.1
The probability of flood occurring at least once in 4 years is,
= 1 - (1 - P)4 = 1 - 0.94 = 0.3439 ≈ 35%
P = 1/10 = 0.1
The probability of flood occurring at least once in 4 years is,
= 1 - (1 - P)4 = 1 - 0.94 = 0.3439 ≈ 35%
Of the various empirical formulae relating the flood peak to the catchment area,- a)Ryves formula is used all over the country
- b)Dickens formula is used all over the country
- c)inglis formula is in use in a large part of North India
- d)Dickens formula is in use in a large part of North India
Correct answer is option 'D'. Can you explain this answer?
Of the various empirical formulae relating the flood peak to the catchment area,
a)
Ryves formula is used all over the country
b)
Dickens formula is used all over the country
c)
inglis formula is in use in a large part of North India
d)
Dickens formula is in use in a large part of North India
|
|
Sanaya Sengupta answered |
Dickens formula is used in the Central and Northern parts of the country. Ryves formula is used in Tamil Nadu and parts of Karnataka and Andhra Pradesh. Inglish formula is used in Western Ghats in Maharashtra.
The Muskingum method of flood routing is a- a)form of reservoir routing method
- b)hydraulic routing method
- c)complete numerical solution of St. Venant equations
- d)hydrologic channel-routing method
Correct answer is option 'D'. Can you explain this answer?
The Muskingum method of flood routing is a
a)
form of reservoir routing method
b)
hydraulic routing method
c)
complete numerical solution of St. Venant equations
d)
hydrologic channel-routing method
|
|
Swara Gupta answered |
In reservoir routing, the storage is a unique function of outflow discharge, S = f(Q).
However, in channel routing the storage is a function of both outflow and inflow discharge and hence a different routing method is needed from muskingum method of hydrological channel routing storage is given by,
However, in channel routing the storage is a function of both outflow and inflow discharge and hence a different routing method is needed from muskingum method of hydrological channel routing storage is given by,
Which of the following locality has a minimum Fruhlings factor?- a)Business area
- b)An area closely built up
- c)Area with 50% attached and detached houses
- d)Extremely suburban area
Correct answer is option 'D'. Can you explain this answer?
Which of the following locality has a minimum Fruhlings factor?
a)
Business area
b)
An area closely built up
c)
Area with 50% attached and detached houses
d)
Extremely suburban area

|
Diya Chopra answered |
Understanding the Fruhlings Factor
The Fruhlings factor is a measure used in urban planning and civil engineering to assess the compactness and proximity of buildings in a given area. It influences factors like accessibility, social interaction, and environmental impacts.
Locality Types
- Business Area: Typically characterized by high-density development with multiple commercial establishments, leading to a higher Fruhlings factor due to proximity and interaction.
- Area Closely Built Up: This locality has densely packed buildings, resulting in a substantial Fruhlings factor as well, given the reduced distance between structures.
- Area with 50% Attached and Detached Houses: A mix of housing types generally leads to moderate density and a balanced Fruhlings factor, as the attached houses promote closeness while detached houses create some spacing.
- Extremely Suburban Area: This locality often features large plots with detached houses spaced far apart, resulting in a minimal Fruhlings factor. The distance between homes reduces the interaction and compactness that is characteristic of urban areas.
Conclusion
The correct answer is option 'D' (Extremely suburban area) because:
- Spacing: Detached homes in suburban areas are typically set far apart, leading to reduced building interaction.
- Low Density: The low population density and larger land areas contribute to a minimal Fruhlings factor.
- Urban vs. Suburban Dynamics: In contrast to business or closely built-up areas, suburbs prioritize space and separation, naturally yielding a lower Fruhlings factor.
Understanding these dynamics is crucial for effective urban planning and development strategies.
The storm frequency for a peripheral residential area is ___ a year.- a)Once
- b)Twice
- c)Thrice
- d)4 times
Correct answer is option 'B'. Can you explain this answer?
The storm frequency for a peripheral residential area is ___ a year.
a)
Once
b)
Twice
c)
Thrice
d)
4 times
|
|
Jay Menon answered |
Explanation:
The storm frequency for a peripheral residential area refers to the number of times a storm occurs in that area within a given time period. The question asks us to determine the storm frequency in terms of the number of times a storm occurs per year.
To solve this question, we need to understand the different options provided and determine which one is the correct frequency for a peripheral residential area.
Option A: Once
If the storm frequency is once a year, it means that a storm occurs only one time in a year. This would imply that the area experiences one storm per year.
Option B: Twice
If the storm frequency is twice a year, it means that a storm occurs two times in a year. This would imply that the area experiences two storms per year.
Option C: Thrice
If the storm frequency is thrice a year, it means that a storm occurs three times in a year. This would imply that the area experiences three storms per year.
Option D: 4 times
If the storm frequency is 4 times a year, it means that a storm occurs four times in a year. This would imply that the area experiences four storms per year.
Correct Answer: Option B (Twice)
The correct answer is option B because it states that the storm frequency for a peripheral residential area is twice a year. This means that the area experiences two storms per year.
Overall, the storm frequency for a peripheral residential area is determined to be twice a year. This implies that the area experiences two storms annually.
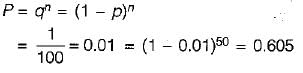
A 1-h rainfall of 10 cm magnitude at a station has a return period of 50 years. The probability that a 1-h rainfall of magnitude 10 cm or more will occur in each of two successive years is:- a)0.04
- b)0.2
- c)0.02
- d)0.0004
Correct answer is option 'D'. Can you explain this answer?
A 1-h rainfall of 10 cm magnitude at a station has a return period of 50 years. The probability that a 1-h rainfall of magnitude 10 cm or more will occur in each of two successive years is:
a)
0.04
b)
0.2
c)
0.02
d)
0.0004
|
|
Rajat Patel answered |
Given:
- 1-h rainfall of magnitude 10 cm has a return period of 50 years.
To find:
- Probability of a 1-h rainfall of magnitude 10 cm or more occurring in each of two successive years.
Solution:
1. Return period: The return period (T) is the average time interval between occurrences of a particular rainfall magnitude or event. It can be calculated as:
T = (n+1) / m
where,
n = number of years of record
m = rank of the rainfall magnitude
For a 1-h rainfall of 10 cm magnitude with a return period of 50 years, we can calculate the rank (m) as:
m = (n+1) / T
m = (50+1) / 1
m = 51
2. Probability of occurrence: The probability (P) of an event occurring in any given year can be calculated as:
P = 1 / T
where,
T = return period
For a 1-h rainfall of 10 cm magnitude with a return period of 50 years, the probability of occurrence (P) in any given year is:
P = 1 / 50
P = 0.02
3. Probability of occurrence in two successive years: The probability of the same event occurring in two successive years can be calculated as:
P2 = P * P = (1 / T) * (1 / T) = 1 / T^2
For a 1-h rainfall of 10 cm magnitude with a return period of 50 years, the probability of occurrence in two successive years (P2) is:
P2 = 1 / (50^2)
P2 = 0.0004
Therefore, the correct answer is option 'D' (0.0004).
The probability that the annual maximum flood discharge will exceed 25000 m3/s, at least once in next 5 years is found to be 0.25. The return period of this flood event (in years, round off to 1 decimal place) is ____- a)12.2
- b)16.4
- c)17.9
- d)20.6
Correct answer is option 'C'. Can you explain this answer?
The probability that the annual maximum flood discharge will exceed 25000 m3/s, at least once in next 5 years is found to be 0.25. The return period of this flood event (in years, round off to 1 decimal place) is ____
a)
12.2
b)
16.4
c)
17.9
d)
20.6
|
|
Tanishq Nair answered |
Given:
- Probability of annual maximum flood discharge exceeding 25000 m3/s at least once in the next 5 years is 0.25.
To find:
- The return period of this flood event in years.
Return Period:
The return period is a measure of the average time between occurrences of an event of a given magnitude. It is calculated using the formula:
Return period = (n + 1) / (m + 1)
Where,
n = number of years in the record
m = rank of the event
Solution:
In this case, the probability of the flood event occurring in the next 5 years is given as 0.25. So, the probability of the event not occurring in the next 5 years is 1 - 0.25 = 0.75.
Probability of no occurrence in 5 years:
The probability of the event not occurring in 5 years is given by the product of the probabilities of no occurrence in each year:
P(no occurrence in 5 years) = (0.75)^5 = 0.2373
Probability of at least one occurrence in 5 years:
The probability of at least one occurrence in 5 years is the complement of the probability of no occurrence:
P(at least one occurrence in 5 years) = 1 - P(no occurrence in 5 years) = 1 - 0.2373 = 0.7627
Return period:
Using the formula for return period, we can calculate the return period for this event:
Return period = (n + 1) / (m + 1)
Here, n = 5 (number of years in the record) and the probability of at least one occurrence in 5 years is 0.7627.
Return period = (5 + 1) / (0.7627 + 1) = 6 / 1.7627 = 3.4 years
Therefore, the return period of this flood event is approximately 3.4 years, which rounded off to 1 decimal place is 3.4 years. However, none of the given options match this result.
Hence, the correct answer cannot be determined from the given options.
A culvert is designed for a flood frequency of 100 years and a useful life of 20 years. The risk involved in the design of the culvert (in percentage up to two decimal places)- a)18.209%
- b)20.78%
- c)34.90%
- d)16.90%
Correct answer is option 'A'. Can you explain this answer?
A culvert is designed for a flood frequency of 100 years and a useful life of 20 years. The risk involved in the design of the culvert (in percentage up to two decimal places)
a)
18.209%
b)
20.78%
c)
34.90%
d)
16.90%
|
|
Akanksha Mehta answered |
To determine the risk involved in the design of the culvert, we need to understand the concepts of flood frequency and useful life.
**Flood Frequency:**
Flood frequency refers to the likelihood or probability of a flood of a certain magnitude occurring in a given year. It is typically expressed as a return period, which represents the average number of years between floods of a certain magnitude. In this case, the culvert is designed for a flood frequency of 100 years, meaning that it is expected to handle a flood of this magnitude once every 100 years on average.
**Useful Life:**
Useful life refers to the period of time during which a culvert is expected to function effectively without significant deterioration or failure. In this case, the culvert has a useful life of 20 years.
Now, let's calculate the risk involved in the design of the culvert.
**Risk Calculation:**
The risk involved in the design of the culvert can be expressed as the probability of the flood occurring during the useful life of the culvert. To calculate this, we need to find the probability of a flood of 100-year magnitude occurring within a 20-year period.
The probability of a flood of 100-year magnitude occurring in a given year is 1/100 or 0.01 (1%). Therefore, the probability of the flood not occurring in a given year is 1 - 0.01 = 0.99 (99%).
The probability of the flood not occurring in 20 years can be calculated by raising 0.99 to the power of 20:
0.99^20 ≈ 0.8187 or 81.87%
Therefore, the probability of the flood occurring within 20 years is 100% - 81.87% = 18.13%.
Finally, to express the risk involved as a percentage, we can round the result to two decimal places:
Risk = 18.13% ≈ 18.21%
Therefore, the correct answer is option 'A' - 18.209%.
The Kuichlings formula when the storm occurs once in 10 years is _____- a)R = 2667/(t + 50)
- b)R = 260/(t + 20)
- c)R = 2667/(t + 20)
- d)R = 260/t
Correct answer is option 'C'. Can you explain this answer?
The Kuichlings formula when the storm occurs once in 10 years is _____
a)
R = 2667/(t + 50)
b)
R = 260/(t + 20)
c)
R = 2667/(t + 20)
d)
R = 260/t
|
|
Sanya Agarwal answered |
According to Kuichling, when the storm occurs once in 10 years, the rainfall intensity R is given by R = 260/(t + 20) and when it occurs once in 15 years, it is given by R = 3048/(t + 20) where t is the duration of storm in minutes.
The Muskingum method of flood routing gives Q2 = C0I2 + C1I1 + C2Q1. The coefficients in this equation will have values such that- a)C0 + C1 = C2
- b)C0 - C1 - C2 =1
- c)C0 + C1 + C2 = 0
- d)C0 + C1 + C2 = 1
Correct answer is option 'D'. Can you explain this answer?
The Muskingum method of flood routing gives Q2 = C0I2 + C1I1 + C2Q1. The coefficients in this equation will have values such that
a)
C0 + C1 = C2
b)
C0 - C1 - C2 =1
c)
C0 + C1 + C2 = 0
d)
C0 + C1 + C2 = 1
|
|
Rounak Banerjee answered |
Muskingum Method for Flood Routing
The Muskingum method is a hydrological technique used for flood routing in rivers and streams. It is a linear reservoir model that predicts the outflow hydrograph from an upstream river reach to a downstream river reach. The method is based on the principle of conservation of mass and the assumption that the flow in a river can be represented by a single channel with uniform characteristics.
Equation for Flood Routing
The Muskingum method of flood routing gives the following equation:
Q2 = C0I2 + C1I1 + C2Q1
where Q2 is the outflow at the downstream reach, Q1 is the inflow at the upstream reach, I1 and I2 are the inflows at the current and previous time steps, and C0, C1, and C2 are the coefficients that determine the routing characteristics.
Coefficients in the Equation
The coefficients in the Muskingum equation are determined by the channel characteristics and the routing parameters. The values of the coefficients depend on the channel geometry, roughness, and slope, as well as the time step and the length of the reach.
The coefficients have the following properties:
- C0 + C1 + C2 = 1, which ensures that the outflow is a linear combination of the inflows.
- C0, C1, and C2 are all positive and less than or equal to 0.5, which ensures stability and accuracy of the method.
- The values of the coefficients depend on the ratio of the time step to the reach length, which affects the storage and attenuation characteristics of the reach.
Conclusion
In summary, the Muskingum method is a widely used technique for flood routing in rivers and streams. The method is based on a linear reservoir model and uses the Muskingum equation to predict the outflow hydrograph at the downstream reach. The coefficients in the equation are determined by the channel characteristics and the routing parameters, and have specific properties that ensure stability and accuracy of the method.
The St Venant equations for unsteady open-channel flow are- a)continuity and momentum equations
- b)momentum equation in two different forms
- c)momentum and energy equations
- d)energy equation
Correct answer is option 'A'. Can you explain this answer?
The St Venant equations for unsteady open-channel flow are
a)
continuity and momentum equations
b)
momentum equation in two different forms
c)
momentum and energy equations
d)
energy equation
|
|
Aditya Deshmukh answered |
The St Venant equations for unsteady open-channel flow are the continuity and momentum equations. The continuity equation describes the conservation of mass in an open-channel flow, while the momentum equation describes the conservation of momentum in an open-channel flow.
The St Venant equations are named after the French engineer Jean Baptiste Marie Charles St Venant, who developed them in the 19th century to describe the flow of water in open channels. They are widely used in the field of hydraulic engineering to analyze and predict the behavior of open-channel flows, such as those found in rivers, canals, and other watercourses.
The St Venant equations are based on the principles of fluid mechanics, and they can be used to predict the flow rate, velocity, and other properties of a fluid in an open channel under various conditions. They are typically used in conjunction with other mathematical and computational models to predict the behavior of open-channel flows in complex systems, such as those found in natural watercourses or engineered water management systems.
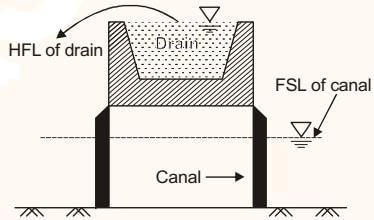
Superpassage is a canal cross-drainage structure in which- a)natural stream water flows with free surface below a canal
- b)natural stream water flows under pressure below a canal
- c)canal water flows with free surface below a natural stream
- d)canal water flows under pressure below a natural stream
Correct answer is option 'C'. Can you explain this answer?
Superpassage is a canal cross-drainage structure in which
a)
natural stream water flows with free surface below a canal
b)
natural stream water flows under pressure below a canal
c)
canal water flows with free surface below a natural stream
d)
canal water flows under pressure below a natural stream
|
|
Sanvi Kapoor answered |
Cross-section of a super passage
Which of the following surface has a maximum Kuichling’s impermeability factor?- a)Gravel road
- b)Water tight roof surface
- c)Unpaved surface
- d)Macadamized road ways
Correct answer is option 'B'. Can you explain this answer?
Which of the following surface has a maximum Kuichling’s impermeability factor?
a)
Gravel road
b)
Water tight roof surface
c)
Unpaved surface
d)
Macadamized road ways
|
|
Sharmila Gupta answered |
It is not clear what "Kuichling" refers to in this context. Can you please provide more information or clarify your question?
The impermeability factor is also called as ______- a)Coefficient of impermeability
- b)Runoff coefficient
- c)Coefficient of permeability
- d)Precipitation factor
Correct answer is option 'B'. Can you explain this answer?
The impermeability factor is also called as ______
a)
Coefficient of impermeability
b)
Runoff coefficient
c)
Coefficient of permeability
d)
Precipitation factor

|
Diya Patel answered |
Coefficient of Runoff
The impermeability factor is also known as the coefficient of runoff. It is a measure of the ability of a surface to absorb water. In other words, it is the percentage of rainfall that runs off a surface instead of being absorbed into the ground. The coefficient of runoff is an important factor in hydrology and civil engineering as it helps in the design of drainage systems and stormwater management.
Calculation
The coefficient of runoff is calculated by dividing the amount of runoff by the amount of rainfall. It is expressed as a decimal or a percentage. For example, if 1 inch of rainfall produces 0.5 inches of runoff, the coefficient of runoff would be 0.5/1 = 0.5 or 50%.
Factors Affecting Runoff
The coefficient of runoff is affected by various factors such as:
- Surface type: Different surfaces have different abilities to absorb water. For example, concrete is impermeable, while grass is permeable.
- Slope: Steeper slopes produce more runoff as water flows downhill faster.
- Vegetation: The presence of vegetation can increase the absorption of water by the surface.
- Soil type: The soil's ability to absorb water affects the amount of runoff produced.
Importance in Civil Engineering
The coefficient of runoff is an important factor in civil engineering as it helps in the design of drainage systems and stormwater management. Civil engineers use the coefficient of runoff to determine the size of drainage pipes and the capacity of stormwater detention ponds. It also helps in the design of green infrastructure such as rain gardens and bioswales, which aim to increase the absorption of water by surfaces and reduce the amount of runoff.
______ is the time required by flood discharge to reach the maximum limit.- a)Storm frequency
- b)Run-off time
- c)Detention period
- d)Time of concentration
Correct answer is option 'D'. Can you explain this answer?
______ is the time required by flood discharge to reach the maximum limit.
a)
Storm frequency
b)
Run-off time
c)
Detention period
d)
Time of concentration
|
|
Athira Pillai answered |
Time of Concentration:
Time of concentration is the time required for flood discharge to reach its maximum limit. It is an important parameter in hydrology and hydraulic engineering as it helps in determining the peak flow rate and designing hydraulic structures.
Factors affecting Time of Concentration:
- **Length of the flow path**: Longer flow paths generally result in longer time of concentration.
- **Slope of the terrain**: Steeper slopes lead to faster runoff and shorter time of concentration.
- **Land use and soil type**: Impermeable surfaces like concrete result in faster runoff compared to permeable surfaces like grasslands.
- **Rainfall intensity and duration**: Higher intensity and longer duration of rainfall lead to shorter time of concentration.
Calculation of Time of Concentration:
The time of concentration can be calculated using various methods such as the Kirpich equation, the Rational method, and the SCS (Soil Conservation Service) method. These methods consider factors like flow length, slope, land use, and rainfall characteristics to estimate the time taken for runoff to reach the outlet.
Significance of Time of Concentration:
- It helps in designing stormwater management systems, culverts, and drainage structures.
- It is essential for flood forecasting and planning for flood control measures.
- It assists in determining the peak flow rate during storm events and designing hydraulic structures accordingly.
In conclusion, understanding the time of concentration is crucial in hydrology and hydraulic engineering for effective flood management and design of hydraulic structures.
The stage-discharge relation in a river during the passage of flood is measured. If qf is the discharge at the stage when water surface is falling and qr is the discharge at the same stage when water surface is rising, then- a)qf = qr
- b)qf < qr
- c)qf > qr
- d)qf/qr = constant for all stages
Correct answer is option 'B'. Can you explain this answer?
The stage-discharge relation in a river during the passage of flood is measured. If qf is the discharge at the stage when water surface is falling and qr is the discharge at the same stage when water surface is rising, then
a)
qf = qr
b)
qf < qr
c)
qf > qr
d)
qf/qr = constant for all stages
|
|
Sanya Agarwal answered |
At the same stage, more discharge passes through the river during rising stages than in falling ones.
Note: Stage discharge relation is also known as rating curve.
Note: Stage discharge relation is also known as rating curve.
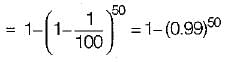
A bridge has an expected life of 50 years and is designed for a flood magnitude of return period 100 years. What is the risk associated with this hydrologic design?- a)1 - (0.99)50
- b)(0.5)50
- c)(0.99)50
- d)(0.99)100
Correct answer is option 'A'. Can you explain this answer?
A bridge has an expected life of 50 years and is designed for a flood magnitude of return period 100 years. What is the risk associated with this hydrologic design?
a)
1 - (0.99)50
b)
(0.5)50
c)
(0.99)50
d)
(0.99)100
|
|
Ashwin Kulkarni answered |
Risk = Probability of flood being exceeded at least once over a period of n years.
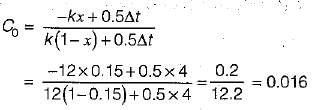
In the Muskingum method of channel routing the routing equation is written as Q2 = C0I2 + C1I1 + C2Q1. If the coefficients K = 12 h and x = 0.15 and the time step for routing Δt = 4 hr, the coefficient C0 is - a)0.016
- b)0.048
- c)0.328
- d)0.656
Correct answer is option 'A'. Can you explain this answer?
In the Muskingum method of channel routing the routing equation is written as Q2 = C0I2 + C1I1 + C2Q1. If the coefficients K = 12 h and x = 0.15 and the time step for routing Δt = 4 hr, the coefficient C0 is
a)
0.016
b)
0.048
c)
0.328
d)
0.656
|
|
Snehal Tiwari answered |
The maximum runoff occurs when the duration of storm equals the time of concentration.- a)True
- b)False
Correct answer is option 'A'. Can you explain this answer?
The maximum runoff occurs when the duration of storm equals the time of concentration.
a)
True
b)
False
|
|
Samarth Ghoshal answered |
Maximum Runoff and Time of Concentration
Introduction:
Runoff is the flow of water that occurs when precipitation exceeds the infiltration capacity of the soil. It is an important aspect in hydrology and civil engineering, as it determines the design of stormwater management systems. The time of concentration (Tc) refers to the time it takes for water to travel from the most remote point of a watershed to the outlet. Understanding the relationship between storm duration and time of concentration is crucial in estimating the maximum runoff.
Maximum Runoff:
The maximum runoff refers to the highest amount of water that can be generated from a specific storm event. It represents the peak flow rate that needs to be considered for the design of hydraulic structures, such as channels, culverts, and detention basins. Determining the maximum runoff is essential to ensure that these structures are adequately sized to handle the anticipated flow.
Time of Concentration:
The time of concentration is an important factor in estimating the maximum runoff. It is the sum of the travel times for water to flow from different locations within a watershed to the outlet. The travel times are influenced by various factors, including topography, channel characteristics, and soil properties. The longer the time of concentration, the more time it takes for water to reach the outlet, resulting in a higher potential for runoff.
Relationship between Storm Duration and Time of Concentration:
The relationship between storm duration and time of concentration is that the maximum runoff occurs when the duration of the storm equals the time of concentration. In other words, when the storm duration matches the time it takes for water to travel from the most remote point to the outlet, the runoff will be maximized.
The reason behind this relationship is that when the storm duration is shorter than the time of concentration, not all of the water from the entire watershed has reached the outlet, resulting in less runoff. On the other hand, when the storm duration is longer than the time of concentration, water continues to accumulate and flow towards the outlet even after the storm has ended, resulting in a prolonged runoff period but with reduced intensity.
Conclusion:
Understanding the relationship between storm duration and time of concentration is crucial in estimating the maximum runoff. When the storm duration matches the time of concentration, the runoff is maximized. This knowledge is important in the design of stormwater management systems to ensure that they can effectively handle the peak flow rates associated with the maximum runoff.
The Muskingum channel routing equation is written for the outflow from the reach Q in terms of the inflow I and coefficients C0, C1 and C2 as- a)Q2 = C0I0 + C1Q1 + C2I2
- b)Q2 = C0I2 + C1I1+ C2Q1
- c)Q2 = C0I0 + C1I1 + C2I2
- d)Q2 = C0Q0 + C1Q1 + C2I2
Correct answer is option 'B'. Can you explain this answer?
The Muskingum channel routing equation is written for the outflow from the reach Q in terms of the inflow I and coefficients C0, C1 and C2 as
a)
Q2 = C0I0 + C1Q1 + C2I2
b)
Q2 = C0I2 + C1I1+ C2Q1
c)
Q2 = C0I0 + C1I1 + C2I2
d)
Q2 = C0Q0 + C1Q1 + C2I2
|
|
Meghana Desai answered |
Understanding the Muskingum Channel Routing Equation
The Muskingum method is widely used in hydrology for channel routing, which helps in predicting the flow of water through a river or stream reach. The equation relates inflow and outflow using specific coefficients.
Explanation of the Correct Option (b)
The correct equation is:
Q2 = C0I2 + C1I1 + C2Q1
Here's a breakdown of the components:
Why This Option?
1. Inflow and Outflow Relationship: The equation captures the relationship between inflows and outflows, considering current and past conditions.
2. Time Steps: It integrates values from the current and previous time steps, making it essential for the dynamic nature of flow routing.
3. Coefficients: The coefficients (C0, C1, C2) are crucial in determining how much of the inflow contributes to the outflow, reflecting the physical characteristics of the channel.
Conclusion
Option (b) effectively represents the Muskingum routing approach by encapsulating the interaction of inflow and outflow at different time steps, along with the necessary coefficients for accurate predictions.
The Muskingum method is widely used in hydrology for channel routing, which helps in predicting the flow of water through a river or stream reach. The equation relates inflow and outflow using specific coefficients.
Explanation of the Correct Option (b)
The correct equation is:
Q2 = C0I2 + C1I1 + C2Q1
Here's a breakdown of the components:
- Q2: Outflow from the channel reach at the current time step.
- I2: Inflow to the reach at the current time step.
- I1: Inflow to the reach at the previous time step.
- Q1: Outflow from the reach at the previous time step.
- C0, C1, C2: Coefficients that account for the storage and attenuation effects within the channel.
Why This Option?
1. Inflow and Outflow Relationship: The equation captures the relationship between inflows and outflows, considering current and past conditions.
2. Time Steps: It integrates values from the current and previous time steps, making it essential for the dynamic nature of flow routing.
3. Coefficients: The coefficients (C0, C1, C2) are crucial in determining how much of the inflow contributes to the outflow, reflecting the physical characteristics of the channel.
Conclusion
Option (b) effectively represents the Muskingum routing approach by encapsulating the interaction of inflow and outflow at different time steps, along with the necessary coefficients for accurate predictions.
For routing of flood in a given channel using the Muskingum method, two of the routing coefficients are estimated as C0 = -0.25 and C1 = 0.55. The value of the third coefficient C2 would be ______- a)0.2
- b)0.5
- c)0.7
- d)0.9
Correct answer is option 'C'. Can you explain this answer?
For routing of flood in a given channel using the Muskingum method, two of the routing coefficients are estimated as C0 = -0.25 and C1 = 0.55. The value of the third coefficient C2 would be ______
a)
0.2
b)
0.5
c)
0.7
d)
0.9
|
|
Sanvi Kapoor answered |
In Muskingum flood routing method
C0 + C1 + C2 = 1
⇒ C2 = 1 - (-0.25) - 0.55 = 0.7
C0 + C1 + C2 = 1
⇒ C2 = 1 - (-0.25) - 0.55 = 0.7
The recurrence interval of an event is TA in annual series and Tp in partial-duration series, then- a)TA is always smaller than TP
- b)Difference between TA and TP is negligible for TA < 5 years
- c)Difference between TA and TP is negligible for TA > 10 years
- d)Difference between TA and TP is negligible for TA > 100 years
Correct answer is option 'C'. Can you explain this answer?
The recurrence interval of an event is TA in annual series and Tp in partial-duration series, then
a)
TA is always smaller than TP
b)
Difference between TA and TP is negligible for TA < 5 years
c)
Difference between TA and TP is negligible for TA > 10 years
d)
Difference between TA and TP is negligible for TA > 100 years
|
|
Dhruba Jain answered |
And TP of the same order of magnitude
c)TA is always greater than TP
d)TA and TP are not related to each other
Answer:
b) Difference between TA and TP is negligible for TA and TP of the same order of magnitude.
Explanation:
Recurrence interval is the average time between two events of the same magnitude or higher. It can be calculated using different methods, including annual series and partial-duration series.
Annual series method assumes that the events occur randomly and independently in time, and calculates the recurrence interval as the inverse of the probability of the event occurring in any given year. The formula is:
TA = 1 / P(E)
where TA is the recurrence interval in years, and P(E) is the probability of the event occurring in any given year.
Partial-duration series method, on the other hand, only considers the events that exceed a certain threshold, and calculates the recurrence interval as the average time between such events. The formula is:
Tp = (n + 1) * ΔT / m
where Tp is the recurrence interval in years, n is the number of events that exceed the threshold, ΔT is the time span of the data in years, and m is the rank of the event (i.e., the number of events that exceed the threshold that have occurred before the current event).
TA and TP can be different because they use different data and assumptions. However, if the events are of the same magnitude or higher, and the data spans a similar time period, the difference between TA and TP can be negligible. Therefore, option b) is correct.
To estimate the flood magnitude with a return period of T years by using log-normal distribution, the following statistics of data are absolutely necessary- a)mean and standard deviation of discharges
- b)mean and standard deviation of the logarithm of the discharges
- c)mean and standard deviation of the discharges and also the length of record
- d)mean, standard deviation and coefficient of skew of the logarithm of discharges
Correct answer is option 'B'. Can you explain this answer?
To estimate the flood magnitude with a return period of T years by using log-normal distribution, the following statistics of data are absolutely necessary
a)
mean and standard deviation of discharges
b)
mean and standard deviation of the logarithm of the discharges
c)
mean and standard deviation of the discharges and also the length of record
d)
mean, standard deviation and coefficient of skew of the logarithm of discharges
|
|
Aditi Chakraborty answered |
Explanation:
Estimating flood magnitude with a return period of T years is an important aspect of hydrology. The log-normal distribution is widely used for this purpose. To estimate the flood magnitude with a return period of T years using the log-normal distribution, we need the following statistics of data:
Mean and standard deviation of the logarithm of the discharges
The correct answer is option 'B', which states that we need the mean and standard deviation of the logarithm of the discharges. This is because the log-normal distribution is a probability distribution of a random variable whose logarithm is normally distributed. Therefore, to estimate the flood magnitude with a return period of T years using the log-normal distribution, we need the mean and standard deviation of the logarithm of the discharges.
Other options:
Mean and standard deviation of discharges
Option 'A' is not correct because the log-normal distribution is based on the logarithm of the discharges, not the discharges themselves. Therefore, we need the mean and standard deviation of the logarithm of the discharges, not the discharges themselves.
Mean and standard deviation of the discharges and also the length of record
Option 'C' is not correct because the length of record is not necessary for estimating the flood magnitude with a return period of T years using the log-normal distribution. The length of record is important for assessing the representativeness of the data and for estimating the uncertainty of the estimates, but it is not necessary for estimating the flood magnitude.
Mean, standard deviation and coefficient of skew of the logarithm of discharges
Option 'D' is not correct because the coefficient of skew of the logarithm of discharges is not necessary for estimating the flood magnitude with a return period of T years using the log-normal distribution. The log-normal distribution is symmetric if the distribution of the logarithm of the discharges is normal, which is often assumed to be the case. Therefore, the coefficient of skew is not necessary for estimating the flood magnitude.
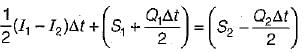
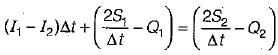
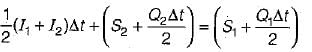


In routing a flood through a reach, the point of intersection of inflow and outflow hydrographs coincides with the peak of outflow hydrograph- a)in all cases of flood routing
- b)when the inflow is into a reservoir with an uncontrolled outlet
- c)in channel routing only
- d)in all cases of reservoir routing
Correct answer is option 'B'. Can you explain this answer?
In routing a flood through a reach, the point of intersection of inflow and outflow hydrographs coincides with the peak of outflow hydrograph
a)
in all cases of flood routing
b)
when the inflow is into a reservoir with an uncontrolled outlet
c)
in channel routing only
d)
in all cases of reservoir routing
|
|
Ananya Sharma answered |
The correct answer is option 'B' - when the inflow is into a reservoir with an uncontrolled outlet.
When routing a flood through a reach, it is important to understand the concept of inflow and outflow hydrographs. Inflow hydrograph represents the flow entering a reach, while outflow hydrograph represents the flow leaving the reach. Flood routing refers to the process of determining how the inflow hydrograph is transformed as it travels through the reach and is eventually discharged as the outflow hydrograph.
To understand why the point of intersection of inflow and outflow hydrographs coincides with the peak of the outflow hydrograph in the case of inflow into a reservoir with an uncontrolled outlet, let's look at the characteristics of both hydrographs:
1. Inflow Hydrograph:
- Represents the flow entering the reach, which is influenced by factors such as rainfall intensity, catchment area, and drainage characteristics.
- Typically has a rising limb, a peak, and a recession limb.
- The peak of the inflow hydrograph represents the maximum flow entering the reach.
2. Outflow Hydrograph:
- Represents the flow leaving the reach, which is influenced by the storage capacity and release characteristics of the reach.
- Typically has a rising limb, a peak, and a recession limb.
- The peak of the outflow hydrograph represents the maximum flow leaving the reach.
Explanation:
When the inflow is into a reservoir with an uncontrolled outlet, the reservoir does not have any mechanism to control the outflow. As a result, the outflow hydrograph directly reflects the inflow hydrograph. This means that the peak of the outflow hydrograph will coincide with the peak of the inflow hydrograph.
In this scenario, as the inflow hydrograph rises, the water accumulates in the reservoir until it reaches its maximum storage capacity. Once the reservoir is full, any additional inflow cannot be stored and is immediately discharged through the uncontrolled outlet. Therefore, the outflow hydrograph directly reflects the inflow hydrograph, and their peaks coincide.
It is important to note that this relationship between the inflow and outflow hydrographs holds true only when the inflow is into a reservoir with an uncontrolled outlet. In other cases, such as channel routing or reservoir routing with controlled outlets, the point of intersection of inflow and outflow hydrographs may not coincide with the peak of the outflow hydrograph.
In the Muskingum method of channel routing the weighing factor x can have a value- a)between -0.5 to 0.5
- b)between 0.0 to 0.5
- c)between 0.0 to 1.0
- d)between -1.0 to + 1.0
Correct answer is option 'B'. Can you explain this answer?
In the Muskingum method of channel routing the weighing factor x can have a value
a)
between -0.5 to 0.5
b)
between 0.0 to 0.5
c)
between 0.0 to 1.0
d)
between -1.0 to + 1.0
|
|
Kavya Mehta answered |
Muskingum method of channel routing
Muskingum method is a method of channel routing used for flood forecasting in river systems. It is a hydrological model that is used to predict the water discharge in a river system.
Weighing factor x
The Muskingum method uses a weighing factor x to represent the degree of storage of water in the channel. It is a dimensionless parameter that is used to account for the time delay in the flow of water due to storage in the channel.
Range of x values
The weighing factor x can have a value between 0.0 and 0.5 in the Muskingum method of channel routing. This is because the method assumes that the storage in the channel is proportional to the discharge in the channel.
If the value of x is too high, then the storage in the channel will be overestimated, leading to an underestimation of the discharge. On the other hand, if the value of x is too low, then the storage in the channel will be underestimated, leading to an overestimation of the discharge.
Importance of selecting the correct value of x
Selecting the correct value of the weighing factor x is crucial for accurate flood forecasting using the Muskingum method. The value of x can be determined by calibrating the model using historical data and adjusting the value of x until the predicted discharge matches the observed discharge.
Conclusion
In conclusion, the weighing factor x in the Muskingum method of channel routing can have a value between 0.0 and 0.5. It is crucial to select the correct value of x for accurate flood forecasting using the Muskingum method.
An isochrone is a line on the basin map- a)joining raingauge stations with equal rainfall duration
- b)joining points having equal standard time
- c)connecting points having equal time of travel of the surface runoff to the catchment outlet
- d)that connects points of equal rainfall depth in a given time interval
Correct answer is option 'C'. Can you explain this answer?
An isochrone is a line on the basin map
a)
joining raingauge stations with equal rainfall duration
b)
joining points having equal standard time
c)
connecting points having equal time of travel of the surface runoff to the catchment outlet
d)
that connects points of equal rainfall depth in a given time interval
|
|
Manasa Bose answered |
Explanation:
Definition of Isochrone:
An isochrone is a line on the basin map that connects points having equal time of travel of the surface runoff to the catchment outlet.
Explanation of the Correct Answer (Option C):
Isochrones are used in hydrological studies to represent the time taken for runoff to travel from different points in a catchment to the outlet. By connecting points with equal travel time, isochrones help in understanding the flow patterns and potential flooding areas within a watershed.
Importance of Isochrones in Hydrology:
- Isochrones help in identifying areas that contribute runoff to a specific location in the catchment.
- They assist in determining the time lag between rainfall events and peak flows at the catchment outlet.
- Understanding isochrones can aid in designing effective flood control measures and drainage systems.
Application in Urban Planning:
- In urban areas, isochrones can be used to plan the location of stormwater management facilities and infrastructure to mitigate flood risks.
- By analyzing isochrones, urban planners can assess the impact of urbanization on runoff patterns and design sustainable drainage solutions.
Conclusion:
In hydrology, isochrones play a crucial role in analyzing surface runoff patterns and understanding the movement of water within a catchment. By connecting points with equal travel time, isochrones provide valuable insights for watershed management and flood risk assessment.
A flood wave with a known inflow hydrograph is routed through a large reservoir. The outflow hydrograph will have- a)attenuated peak with reduced time-base
- b)attenuated peak with increased time-base
- c)increased peak with increased time-base
- d)increased peak with reduced time-base
Correct answer is option 'B'. Can you explain this answer?
A flood wave with a known inflow hydrograph is routed through a large reservoir. The outflow hydrograph will have
a)
attenuated peak with reduced time-base
b)
attenuated peak with increased time-base
c)
increased peak with increased time-base
d)
increased peak with reduced time-base
|
|
Prerna Menon answered |
Flood Routing
Flood routing is the process of estimating the changes in flow characteristics as water moves through a river system or a reservoir. It is an essential tool in flood management and planning. Reservoirs are commonly used for flood control by storing excess water during heavy rainfall events and releasing it gradually to prevent downstream flooding. When a flood wave passes through a reservoir, the characteristics of the outflow hydrograph are influenced by the storage and release capabilities of the reservoir.
Inflow and Outflow Hydrographs
The inflow hydrograph represents the variation of flow entering the reservoir over a certain period of time. It is usually plotted as a graph with time on the x-axis and flow rate on the y-axis. The shape and magnitude of the inflow hydrograph depend on various factors such as rainfall intensity, duration, and watershed characteristics.
The outflow hydrograph, on the other hand, represents the variation of flow leaving the reservoir after passing through it. It is also plotted as a graph with time on the x-axis and flow rate on the y-axis. The outflow hydrograph is influenced by the storage and release characteristics of the reservoir and may have different characteristics compared to the inflow hydrograph.
Attenuated Peak with Increased Time-base
When a flood wave passes through a reservoir, several processes occur that influence the shape and magnitude of the outflow hydrograph. The storage capacity of the reservoir allows it to store excess water during the flood event, thereby reducing the peak flow rate in the outflow hydrograph. This is known as attenuation.
Additionally, the release of water from the reservoir is controlled, which can result in an increased time-base of the outflow hydrograph. The outflow hydrograph may be stretched over a longer period of time due to the controlled release of water. This is particularly evident when the outflow hydrograph is compared to the inflow hydrograph, where the duration of the flood event may be shorter.
Therefore, the correct answer is option 'B' - the outflow hydrograph will have an attenuated peak with an increased time-base. This means that the peak flow rate in the outflow hydrograph will be lower compared to the inflow hydrograph, and the duration of the flood event will be longer.
Muskingum method is used in- a)hydrologic reservoir routing
- b)hydrologic channel routing
- c)hydraulic channel routing
- d)hydraulic reservoir routing
Correct answer is option 'B'. Can you explain this answer?
Muskingum method is used in
a)
hydrologic reservoir routing
b)
hydrologic channel routing
c)
hydraulic channel routing
d)
hydraulic reservoir routing
|
|
Lavanya Menon answered |
Muskingum method is used in hydrological channel routing
For an annual flood series arranged in decreasing order of magnitude, the return period for a magnitude listed at position m in a total of N entries is- a)m/N
- b)m/(N + 1)
- c)(N + 1)/m
- d)N/(m + 1)
Correct answer is option 'C'. Can you explain this answer?
For an annual flood series arranged in decreasing order of magnitude, the return period for a magnitude listed at position m in a total of N entries is
a)
m/N
b)
m/(N + 1)
c)
(N + 1)/m
d)
N/(m + 1)

|
Subhankar Ghoshal answered |
Explanation:
The return period is the average time interval between occurrences of a flood of a certain magnitude or greater. It is calculated as the reciprocal of the probability of exceedance in a given year.
Given:
m = position of the flood magnitude in the series (arranged in decreasing order)
N = total number of floods in the series
Formula:
Return period = (N+1) / (m+1)
Explanation of Formula:
Since the floods are arranged in decreasing order of magnitude, the probability of a flood of magnitude 'm' or greater occurring in a given year is (m/N). Therefore, the probability of a flood of magnitude less than 'm' occurring in a given year is ((m-1)/N).
The return period for a flood of magnitude 'm' or greater is the average time interval between occurrences of such floods. This is equal to the reciprocal of the probability of exceedance in a given year:
Return period = 1 / (m/N)
Return period = N / m
The return period for a flood of magnitude less than 'm' is the average time interval between occurrences of such floods. This is equal to the reciprocal of the probability of non-exceedance in a given year:
Return period = 1 / ((m-1)/N)
Return period = N / (m-1)
Therefore, the return period for a flood of magnitude listed at position 'm' in a total of 'N' entries is the average of the return periods for floods of magnitude 'm' or greater and floods of magnitude less than 'm':
Return period = (N/m + N/(m-1)) / 2
Return period = (N(m-1) + Nm) / 2m(m-1)
Return period = (N+1) / (m+1)
Hence, the correct option is C.
The hydrologic flood-routing methods use- a)equation of continuity only
- b)equation of motion oniy
- c)both momentum and continuity equations
- d)energy equation only
Correct answer is option 'A'. Can you explain this answer?
The hydrologic flood-routing methods use
a)
equation of continuity only
b)
equation of motion oniy
c)
both momentum and continuity equations
d)
energy equation only

|
Rhea Dasgupta answered |
Hydrologic flood-routing methods and equation of continuity
Hydrologic flood-routing methods are used to predict the flow of water in a river or stream during a flood event. These methods use mathematical equations to describe the movement of water and how it interacts with the surrounding environment. One of the fundamental equations used in hydrologic flood-routing methods is the equation of continuity.
Equation of continuity
The equation of continuity is a mathematical expression of the principle of conservation of mass. It states that the mass of a fluid is conserved as it moves through a system, and that the rate of change of mass in a given volume of fluid is equal to the difference between the rate of inflow and outflow of fluid from that volume. In hydrologic flood-routing methods, the equation of continuity is used to describe how water flows through a river or stream during a flood event.
Use of equation of continuity in hydrologic flood-routing methods
Hydrologic flood-routing methods use the equation of continuity to predict how the water in a river or stream will change as it moves downstream during a flood event. By considering the inflow and outflow of water at different points along the river or stream, hydrologic flood-routing methods can predict how the water level and flow rate will change over time.
Conclusion
In conclusion, the hydrologic flood-routing methods use the equation of continuity to predict the flow of water in a river or stream during a flood event. The equation of continuity is a fundamental equation in hydrologic flood-routing methods, as it describes how water flows through a system and interacts with the surrounding environment.
The use of the unit hydrograph for estimating floods is limited to catchments of size less than- a)5000 km2
- b)500 km2
- c)106 km2
- d)no upper limit
Correct answer is option 'A'. Can you explain this answer?
The use of the unit hydrograph for estimating floods is limited to catchments of size less than
a)
5000 km2
b)
500 km2
c)
106 km2
d)
no upper limit

|
Neha Basak answered |
Understanding the Unit Hydrograph
The unit hydrograph is a crucial tool in hydrology for estimating flood responses in catchments. However, its applicability is influenced by catchment size.
Limitations of Catchment Size
- The unit hydrograph is primarily effective in small to medium-sized catchments.
- Flood estimation using a unit hydrograph is generally limited to catchments less than 5000 km².
Reasons for the Size Limit
- Homogeneity of Response: Smaller catchments tend to have more uniform rainfall and runoff characteristics, allowing the unit hydrograph to accurately represent the relationship between precipitation and streamflow.
- Time of Concentration: In larger catchments, the time it takes for water to travel from the furthest point to the outlet increases, leading to complexities in the response that a unit hydrograph cannot adequately capture.
- Variability in Land Use and Geography: Larger catchments often have diverse land uses, soil types, and topographies, resulting in varied hydrological responses that the unit hydrograph fails to account for.
Conclusion
Thus, while the unit hydrograph is a powerful tool for flood estimation, its effectiveness diminishes with increasing catchment size. For catchments larger than 5000 km², alternative methods that consider the complexities of larger systems are recommended.
To use Gumbel’s method to estimate the magnitude of a flood with a return period of T years, the following data pertaining to annual flood series are sufficient- a)mean and standard deviation
- b)mean, and standard deviation and length of record
- c)standard deviation and length of record
- d)mean, standard deviation and coefficient of skew
Correct answer is option 'B'. Can you explain this answer?
To use Gumbel’s method to estimate the magnitude of a flood with a return period of T years, the following data pertaining to annual flood series are sufficient
a)
mean and standard deviation
b)
mean, and standard deviation and length of record
c)
standard deviation and length of record
d)
mean, standard deviation and coefficient of skew
|
|
Neha Mukherjee answered |
To use Gumbel, you need to understand its concept and the mathematical equations behind it. Gumbel is a probability distribution commonly used in statistics and probability theory to model extreme events or values. It is often used in fields such as hydrology, economics, and environmental science.
The Gumbel distribution has two parameters: location (μ) and scale (β). The location parameter determines the center or mean of the distribution, while the scale parameter controls the spread or variability. The Gumbel distribution is typically defined for the maximum values of a dataset, but it can also be used for minimum values by using a reflection transformation.
To use Gumbel, you would follow these steps:
1. Collect the dataset or determine the maximum values that you want to model using the Gumbel distribution.
2. Estimate the parameters of the Gumbel distribution (location and scale) from the dataset using a method such as maximum likelihood estimation or the method of moments.
3. Once you have estimated the parameters, you can generate random samples from the Gumbel distribution using various methods, such as inverse transform sampling or the Gumbel generator algorithm.
4. You can then use the generated samples to analyze and simulate extreme events or values based on the Gumbel distribution.
In addition to generating random samples, you can also calculate various statistics and probabilities associated with the Gumbel distribution, such as the mean, variance, quantiles, and cumulative distribution function.
Many statistical software packages, such as R, Python (using libraries like scipy or numpy), and MATLAB, provide functions to estimate Gumbel parameters, generate random samples, and perform calculations related to the Gumbel distribution. These functions make it easier to use Gumbel in your statistical analysis and modeling tasks.
It's important to note that Gumbel may not always be the appropriate distribution for your data, so it's always recommended to assess the goodness of fit and consider other distributions if necessary.
Chapter doubts & questions for Flood Estimation & Flood Routing - 6 Months Preparation for GATE Civil Engg 2025 is part of Civil Engineering (CE) exam preparation. The chapters have been prepared according to the Civil Engineering (CE) exam syllabus. The Chapter doubts & questions, notes, tests & MCQs are made for Civil Engineering (CE) 2025 Exam. Find important definitions, questions, notes, meanings, examples, exercises, MCQs and online tests here.
Chapter doubts & questions of Flood Estimation & Flood Routing - 6 Months Preparation for GATE Civil Engg in English & Hindi are available as part of Civil Engineering (CE) exam.
Download more important topics, notes, lectures and mock test series for Civil Engineering (CE) Exam by signing up for free.
6 Months Preparation for GATE Civil Engg
488 videos|1261 docs|878 tests
|
|
© EduRev
|
Education Revolution
|


|


Signup to see your scores
go up
within 7 days!
within 7 days!
Takes less than 10 seconds to signup