


All Exams >
Civil Engineering (CE) >
6 Months Preparation for GATE Civil Engg >
All Questions
All questions of Influence Lines for Civil Engineering (CE) Exam
A and C is a pin support while B is roller support.
XL and XR are centroid of uniform loading on beams AB and BC respectively.
IL and IR are given.
LR and LL are length of beams.
AR and AL are areas of beams. Q. 3 moment method can be used in:-
- a)single span beams
- b)only double span beams
- c)double and single span beams
- d)all types of beams
Correct answer is option 'D'. Can you explain this answer?
A and C is a pin support while B is roller support.
XL and XR are centroid of uniform loading on beams AB and BC respectively.
IL and IR are given.
LR and LL are length of beams.
AR and AL are areas of beams.
XL and XR are centroid of uniform loading on beams AB and BC respectively.
IL and IR are given.
LR and LL are length of beams.
AR and AL are areas of beams.
Q. 3 moment method can be used in:-
a)
single span beams
b)
only double span beams
c)
double and single span beams
d)
all types of beams

|
Nandita Datta answered |
Answer: d
Explanation: Although it is not valid for single span beams, it can be used for them using some particular techniques.
Explanation: Although it is not valid for single span beams, it can be used for them using some particular techniques.

Three wheel loads 10t, 26t and 24t spaced 2m apart roll on a girder from left to right with the 10t load leading. The girder has a span of 20 meter. For the condition of maximum bending moment at a section 8 meter from the left end.- a)The 10t load should be placed at the section.
- b)The 26t load should be placed at the section.
- c)The 24t load should be placed at the section.
- d)Either the 26t load or the 24t load should be placed at the section.
Correct answer is option 'B'. Can you explain this answer?
Three wheel loads 10t, 26t and 24t spaced 2m apart roll on a girder from left to right with the 10t load leading. The girder has a span of 20 meter. For the condition of maximum bending moment at a section 8 meter from the left end.
a)
The 10t load should be placed at the section.
b)
The 26t load should be placed at the section.
c)
The 24t load should be placed at the section.
d)
Either the 26t load or the 24t load should be placed at the section.

|
Ishani Basu answered |
Maximum bending moment at a section occurs when a particular load is on the section which changes the ratio 
as the load passes over the section .
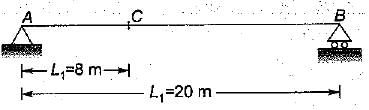
where R1, → resultant of load on left sid e of section Resultant of all loads (R)
= 10 + 26 + 24 = 60t
When 10t load crosses section C.
When 26t load crosses the section C,

It means that maximum bending moment is obtained when 26t load is on the section.
as the load passes over the section .
where R1, → resultant of load on left sid e of section Resultant of all loads (R)
= 10 + 26 + 24 = 60t
When 10t load crosses section C.
When 26t load crosses the section C,
It means that maximum bending moment is obtained when 26t load is on the section.
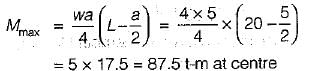
The absolute maximum Bending Moment in a simply supported beam of span 20 m due to a moving UDL of 4 t/m spanning over 5 m is- a)87.5 t-m at the support
- b)87.5 t-m near the midpoint
- c)3.5 t-m at the midpoint
- d)87.5 t-m at the midpoint
Correct answer is option 'D'. Can you explain this answer?
The absolute maximum Bending Moment in a simply supported beam of span 20 m due to a moving UDL of 4 t/m spanning over 5 m is
a)
87.5 t-m at the support
b)
87.5 t-m near the midpoint
c)
3.5 t-m at the midpoint
d)
87.5 t-m at the midpoint
|
|
Ishani Basu answered |
Absolute maximum bending moment will occur at the centre when the load is spread equally on either side of the centre.
A uniformly distributed line load of 60 kN per metre run of length 5 meters on a girder of span 16 metres. What is the maximum positive shear force at a section 6 metres from the left end.- a)140.625 kN
- b)65.625 kN
- c)90.625 kN
- d)45.625 kN
Correct answer is option 'A'. Can you explain this answer?
A uniformly distributed line load of 60 kN per metre run of length 5 meters on a girder of span 16 metres. What is the maximum positive shear force at a section 6 metres from the left end.
a)
140.625 kN
b)
65.625 kN
c)
90.625 kN
d)
45.625 kN
|
|
Puja Sharma answered |
We must first draw the influence line diagram for the SF at the section D,
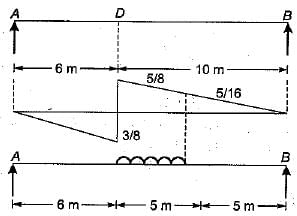
For maximum positive SF at D, the loading should be applied as shown in the figure.
Maximum positive = load x area of ILD SF at D intensity covered by the load
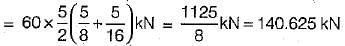
For maximum positive SF at D, the loading should be applied as shown in the figure.
Maximum positive = load x area of ILD SF at D intensity covered by the load
The maximum bending moment at the left quarter point of a simple beam due to crossing of UDL of length shorter than the span in the direction left to right, would occur after the load had just crossed the section by- a)One-fourth of its length
- b)Half of its length
- c)Three-fourth of its length
- d)Its full length
Correct answer is option 'C'. Can you explain this answer?
The maximum bending moment at the left quarter point of a simple beam due to crossing of UDL of length shorter than the span in the direction left to right, would occur after the load had just crossed the section by
a)
One-fourth of its length
b)
Half of its length
c)
Three-fourth of its length
d)
Its full length
|
|
Jyoti Choudhury answered |
The load should be positioned such that section divides the span and load in the same ratio.
The bed of an alluvial channel along the flow will always be- a)flat
- b)way
- c)duned and rippled
- d)and of the above is possible
Correct answer is option 'D'. Can you explain this answer?
The bed of an alluvial channel along the flow will always be
a)
flat
b)
way
c)
duned and rippled
d)
and of the above is possible
|
|
Avinash Mehta answered |
The correct answer is 'D', all of the above is possible. The bed of an alluvial channel along the flow can take on different forms depending on the specific conditions of the channel and the flow. For example, in a stable channel with a relatively low sediment load, the bed may be relatively flat. However, in a channel with a high sediment load or with high velocity flow, the bed may be rippled or even duned. Additionally, in meandering channels, the bed may be way. The bed morphology of an alluvial channel is a constantly changing and influenced by many factors such as sediment load, discharge, channel slope, and channel width.
The most important shape parameter in sediment analysis is- a)sphericity
- b)Shape factor
- c)roundness
- d)form factor
Correct answer is option 'A'. Can you explain this answer?
The most important shape parameter in sediment analysis is
a)
sphericity
b)
Shape factor
c)
roundness
d)
form factor
|
|
Garima Kulkarni answered |
Sphericity:
Sphericity is the most important shape parameter in sediment analysis. It is a measure of how closely a sediment particle resembles a sphere. Sphericity is defined as the ratio of the surface area of a sphere with the same volume as the particle to the surface area of the particle itself. It indicates the roundness or angularity of the particle.
Importance of Sphericity:
Sphericity plays a crucial role in various aspects of sediment analysis and understanding sediment behavior. Here are some reasons why sphericity is considered the most important shape parameter:
1. Particle Packing: Sphericity affects the packing of sediment particles. Spherical particles tend to pack more efficiently, resulting in higher porosity and lower permeability. On the other hand, angular particles have irregular shapes that lead to poor packing, higher porosity, and higher permeability. The packing of sediment particles influences the strength, stability, and hydraulic conductivity of soil or sediment.
2. Hydraulic Conductivity: Sphericity affects the hydraulic conductivity of sediments. Spherical particles have lower hydraulic conductivity compared to angular particles. This is because angular particles have more void spaces and irregular pathways through which water can flow more easily. The hydraulic conductivity is an important parameter in geotechnical engineering, hydrogeology, and environmental studies.
3. Sediment Transport: Sphericity influences the transport of sediment particles by water or wind. Spherical particles offer less resistance to flow and are more easily transported compared to angular particles. In rivers, for example, rounder particles are more likely to be transported downstream, while angular particles tend to settle and deposit.
4. Particle Shape Analysis: Sphericity is a fundamental shape parameter used in particle shape analysis. By measuring the sphericity of sediment particles, we can classify and characterize them based on their roundness or angularity. This information is vital in sedimentological studies, sediment transport modeling, and sediment source identification.
Conclusion:
In sediment analysis, sphericity is considered the most important shape parameter due to its significant influence on particle packing, hydraulic conductivity, sediment transport, and particle shape analysis. Understanding the sphericity of sediment particles helps in predicting their behavior, stability, and movement in various geological and engineering applications.
When a series of wheel loads crosses a simply supported girder, the maximum bending moment under any given wheel load occurs when
- a)the centre of span is midway between the centre of gravity of the load system and the wheel load under consideration
- b)the centre of gravity of the load system is midway between the centre of span and wheel load under consideration
- c)the wheel load under consideration is midway between the centre of gravity of the load system
- d)None of the above
Correct answer is option 'A'. Can you explain this answer?
When a series of wheel loads crosses a simply supported girder, the maximum bending moment under any given wheel load occurs when
a)
the centre of span is midway between the centre of gravity of the load system and the wheel load under consideration
b)
the centre of gravity of the load system is midway between the centre of span and wheel load under consideration
c)
the wheel load under consideration is midway between the centre of gravity of the load system
d)
None of the above

|
Arnab Saini answered |
The centre of span is midway between the centre of gravity of the load system and the wheel load under consideration
What will be the value of Rda?- a)1
- b)0
- c)0.481
- d)0.681
Correct answer is option 'C'. Can you explain this answer?
What will be the value of Rda?
a)
1
b)
0
c)
0.481
d)
0.681
|
|
Jay Sharma answered |
Calculation of Rda value:
1. The value of Rda can be calculated using the formula:
Rda = (D1/D2)^(1/3) - 1
2. Given that D1 = 1.2 and D2 = 0.6, we can substitute these values into the formula:
Rda = (1.2/0.6)^(1/3) - 1
Rda = 2^(1/3) - 1
Rda = 1.2599 - 1
Rda = 0.2599
Final Answer:
The value of Rda is 0.2599, which is approximately 0.481 when rounded to three decimal places. Therefore, the correct option is 'C' - 0.481.
Following figure is for questions 7 and 8.
AB = BC = 1mQ. What will be the equation for vertical reaction at point B (RBY)?- a)RBY = 4X
- b)RBY = 2X
- c)RBY = 3X
- d)RBY = X
Correct answer is option 'D'. Can you explain this answer?
Following figure is for questions 7 and 8.
AB = BC = 1m
AB = BC = 1m
Q. What will be the equation for vertical reaction at point B (RBY)?
a)
RBY = 4X
b)
RBY = 2X
c)
RBY = 3X
d)
RBY = X
|
|
Anshul Chakraborty answered |
Answer: d
Explanation: Take load at any variable distance X and conserve load about point A.
Explanation: Take load at any variable distance X and conserve load about point A.
Following figure is for Q8-Q10.
AB= 2m, BC= 3m, CD= 3m
B is pin support, D is roller and C is just an arbitrary point.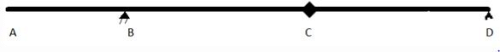 Q. What will be the ILD equation for ILD of shear at point B?
- a)1.33 – 0.116625X
- b)2.33 – 0.16625X
- c)3.33 – 0.16625X
- d)1.33 – 0.16625X
Correct answer is option 'D'. Can you explain this answer?
Following figure is for Q8-Q10.
AB= 2m, BC= 3m, CD= 3m
B is pin support, D is roller and C is just an arbitrary point.
AB= 2m, BC= 3m, CD= 3m
B is pin support, D is roller and C is just an arbitrary point.
Q. What will be the ILD equation for ILD of shear at point B?
a)
1.33 – 0.116625X
b)
2.33 – 0.16625X
c)
3.33 – 0.16625X
d)
1.33 – 0.16625X
|
|
Akanksha Mehta answered |
Answer: d
Explanation: Apply unit load at any point at a distance X and conserve moment about point D
Explanation: Apply unit load at any point at a distance X and conserve moment about point D
What will be the shape of overall ILD?- a)straight line
- b)parabola
- c)hyperbola
- d)arbitrary curve
Correct answer is option 'D'. Can you explain this answer?
What will be the shape of overall ILD?
a)
straight line
b)
parabola
c)
hyperbola
d)
arbitrary curve
|
|
Aditi Chakraborty answered |
Answer: d
Explanation: ILD will be basically(approximately) a line passing through all above points but it will be a type of curve as slope near A will be zero and then slope will change.
Explanation: ILD will be basically(approximately) a line passing through all above points but it will be a type of curve as slope near A will be zero and then slope will change.
A is a fixed support and B is roller.
AB = 18m.
C is a point at a distance of 6m from point A.
D is a point at a distance of 6m from point B.
Assume E and I to be given.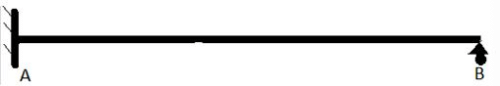 Q. What will be the value of Δaa?
- a)544/EI
- b)944/EI
- c)1544/EI
- d)1944/EI
Correct answer is option 'D'. Can you explain this answer?
A is a fixed support and B is roller.
AB = 18m.
C is a point at a distance of 6m from point A.
D is a point at a distance of 6m from point B.
Assume E and I to be given.
AB = 18m.
C is a point at a distance of 6m from point A.
D is a point at a distance of 6m from point B.
Assume E and I to be given.
Q. What will be the value of Δaa?
a)
544/EI
b)
944/EI
c)
1544/EI
d)
1944/EI
|
|
Aditi Chakraborty answered |
Answer: d
Explanation: Applying a redundant load of unity on point A and applying conjugate beam method will give the answer easily.
Explanation: Applying a redundant load of unity on point A and applying conjugate beam method will give the answer easily.
Ray = reaction at support A in y direction.
Sign convention is as usual.
Beam is linear elastic.
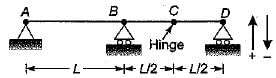
Point A is a pin joint and point B and C are roller support. D is just an arbitrary point.
Unit load is applied at point D. Q. What will be the difference between magnitudes of Fad and Fda?
- a)Faa
- b)0
- c)Fad
- d)Fda
Correct answer is option 'B'. Can you explain this answer?
Ray = reaction at support A in y direction.
Sign convention is as usual.
Beam is linear elastic.
Point A is a pin joint and point B and C are roller support. D is just an arbitrary point.
Unit load is applied at point D.
Sign convention is as usual.
Beam is linear elastic.
Point A is a pin joint and point B and C are roller support. D is just an arbitrary point.
Unit load is applied at point D.
Q. What will be the difference between magnitudes of Fad and Fda?
a)
Faa
b)
0
c)
Fad
d)
Fda
|
|
Sreemoyee Chauhan answered |
Answer: b
Explanation: Due to validity of Maxwell’s reciprocal theorem, magnitudes of Fad and Fda will be equal.
Explanation: Due to validity of Maxwell’s reciprocal theorem, magnitudes of Fad and Fda will be equal.
Ray = reaction at support A in y direction.
Sign convention is as usual.
Beam is linear elastic.
Point A is a pin joint and point B and C are roller support. D is just an arbitrary point.
Unit load is applied at point D. Q. What is the relation between Fad and Fda?
- a)Fad = -Fda
- b)Fad = Fda
- c)Fad = -2Fda
- d)Fad = 2Fda
Correct answer is option 'A'. Can you explain this answer?
Ray = reaction at support A in y direction.
Sign convention is as usual.
Beam is linear elastic.
Point A is a pin joint and point B and C are roller support. D is just an arbitrary point.
Unit load is applied at point D.
Sign convention is as usual.
Beam is linear elastic.
Point A is a pin joint and point B and C are roller support. D is just an arbitrary point.
Unit load is applied at point D.
Q. What is the relation between Fad and Fda?
a)
Fad = -Fda
b)
Fad = Fda
c)
Fad = -2Fda
d)
Fad = 2Fda
|
|
Aditi Sarkar answered |
Answer: a
Explanation: Magnitudes will be same as stated above. Now, sign will be opposite as slope at B won’t change in deflection diagram and there won’t be and vertical deflection at point C.
Explanation: Magnitudes will be same as stated above. Now, sign will be opposite as slope at B won’t change in deflection diagram and there won’t be and vertical deflection at point C.
While writing influence line equations, left most point is always considered as origin and following sign convention is followed. Q. For drawing ILD, what value of test load is assumed?
- a)1 unit
- b)Arbitrary
- c)Depends upon structure
- d)0
Correct answer is option 'A'. Can you explain this answer?
While writing influence line equations, left most point is always considered as origin and following sign convention is followed.
Q. For drawing ILD, what value of test load is assumed?
a)
1 unit
b)
Arbitrary
c)
Depends upon structure
d)
0
|
|
Pallabi Tiwari answered |
Answer: a
Explanation: 1 unit load is assumed as calculations are easy then. Actual loads are multiplies with the results obtained to calculate further.
Explanation: 1 unit load is assumed as calculations are easy then. Actual loads are multiplies with the results obtained to calculate further.
Which one of the following equations represents influence line of fixed end moment at B of the fixed beam AB of length l with origin at A?- a)

- b)

- c)

- d)

Correct answer is option 'A'. Can you explain this answer?
Which one of the following equations represents influence line of fixed end moment at B of the fixed beam AB of length l with origin at A?
a)
b)
c)
d)
|
|
Partho Choudhary answered |
For the influence line of fixed end moment at B, release the moment at B and give unit rotation, the deformed shape will represent the influence line.

due to unit load at x distance from A.
due to unit load at x distance from A.
Following figure is for Q2-Q7.
AC= 1m, CB =3 m
C is just an arbitrary point. A is pin support and B is a roller type support. Q. If both, a load of 50KN at point C and a uniform load of 10KN/m between CB acts, then what will be the shear generated at point C?
- a)48.75
- b)50.75
- c)46.75
- d)52.75
Correct answer is option 'A'. Can you explain this answer?
Following figure is for Q2-Q7.
AC= 1m, CB =3 m
C is just an arbitrary point. A is pin support and B is a roller type support.
AC= 1m, CB =3 m
C is just an arbitrary point. A is pin support and B is a roller type support.
Q. If both, a load of 50KN at point C and a uniform load of 10KN/m between CB acts, then what will be the shear generated at point C?
a)
48.75
b)
50.75
c)
46.75
d)
52.75
|
|
Lakshmi Datta answered |
Answer: a
Explanation: Net shear generated will be the sum of individually generated shear which has been already calculated earlier.
Explanation: Net shear generated will be the sum of individually generated shear which has been already calculated earlier.
While writing influence line equations, left most point is always considered as origin and following sign convention is followed.Q. ILD of statically determinate beams consists of curve as well as straight lines.
State whether the above statement is true or false.- a)True
- b)False
Correct answer is option 'B'. Can you explain this answer?
While writing influence line equations, left most point is always considered as origin and following sign convention is followed.
Q. ILD of statically determinate beams consists of curve as well as straight lines.
State whether the above statement is true or false.
State whether the above statement is true or false.
a)
True
b)
False
|
|
Anshul Chakraborty answered |
Answer: b
Explanation: ILD of statically determinate beams consist of only straight lines.
Explanation: ILD of statically determinate beams consist of only straight lines.
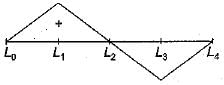
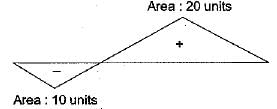
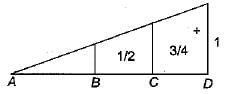
A and C is a pin support while B is roller support.
XL and XR are centroid of uniform loading on beams AB and BC respectively.
IL and IR are given.
LR and LL are length of beams.
AR and AL are areas of beams. Q. What is the change in slope at point B?
- a)AR . XR/LR
- b)AL . XL/IL
- c)0
- d)AR . XR/E . LR
Correct answer is option 'C'. Can you explain this answer?
A and C is a pin support while B is roller support.
XL and XR are centroid of uniform loading on beams AB and BC respectively.
IL and IR are given.
LR and LL are length of beams.
AR and AL are areas of beams.
XL and XR are centroid of uniform loading on beams AB and BC respectively.
IL and IR are given.
LR and LL are length of beams.
AR and AL are areas of beams.
Q. What is the change in slope at point B?
a)
AR . XR/LR
b)
AL . XL/IL
c)
0
d)
AR . XR/E . LR
|
|
Ishani Basu answered |
Answer: c
Explanation: Since point B is roller support, there won’t be any change at of slope at point B.
Explanation: Since point B is roller support, there won’t be any change at of slope at point B.
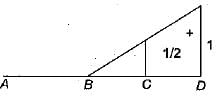
Following figure is for questions 7 and 8.
AB = BC = 1mQ. Where will be the maximum point of ILD lie?- a)A
- b)B
- c)C
- d)Between A and B
Correct answer is option 'C'. Can you explain this answer?
Following figure is for questions 7 and 8.
AB = BC = 1m
AB = BC = 1m
Q. Where will be the maximum point of ILD lie?
a)
A
b)
B
c)
C
d)
Between A and B
|
|
Anirudh Kulkarni answered |
Answer: c
Explanation: On drawing curve based on the above equation, we will find that maximum point will lie at C.
Explanation: On drawing curve based on the above equation, we will find that maximum point will lie at C.
Following figure is for Q2-Q7.
AC= 1m, CB =3 m
C is just an arbitrary point. A is pin support and B is a roller type support.Q. If a concentrated load of 50KN is applied at point C, then what will be the shear developed at point C?- a)17.5 KN
- b)27.5 KN
- c)37.5 KN
- d)47.5 KN
Correct answer is option 'C'. Can you explain this answer?
Following figure is for Q2-Q7.
AC= 1m, CB =3 m
C is just an arbitrary point. A is pin support and B is a roller type support.
AC= 1m, CB =3 m
C is just an arbitrary point. A is pin support and B is a roller type support.
Q. If a concentrated load of 50KN is applied at point C, then what will be the shear developed at point C?
a)
17.5 KN
b)
27.5 KN
c)
37.5 KN
d)
47.5 KN
|
|
Akanksha Mehta answered |
Answer: c
Explanation: Position of ILD at point C is 0.75 (peak). So, shear developed will be 0.75 multiplied by 50KN.
Explanation: Position of ILD at point C is 0.75 (peak). So, shear developed will be 0.75 multiplied by 50KN.
A is a fixed support and B is roller.
AB = 18m.
C is a point at a distance of 6m from point A.
D is a point at a distance of 6m from point B.
Assume E and I to be given.Q. What will be the value of Ray for ILD?- a)0
- b)1
- c)2
- d)-1
Correct answer is option 'B'. Can you explain this answer?
A is a fixed support and B is roller.
AB = 18m.
C is a point at a distance of 6m from point A.
D is a point at a distance of 6m from point B.
Assume E and I to be given.
AB = 18m.
C is a point at a distance of 6m from point A.
D is a point at a distance of 6m from point B.
Assume E and I to be given.
Q. What will be the value of Ray for ILD?
a)
0
b)
1
c)
2
d)
-1
|
|
Sankar Dasgupta answered |
Answer: b
Explanation: Since redundant force is applied at point A, Fda/Faa will be the result unity.
Explanation: Since redundant force is applied at point A, Fda/Faa will be the result unity.
Following figure is for Q8-Q10.
AB= 2m, BC= 3m, CD= 3m
B is pin support, D is roller and C is just an arbitrary point.Q. What will be the ILD equation for ILD of shear at point C for AB part of beam?- a)-0.33 + 0.165X
- b)-0.33 + 0.265X
- c)-0.43 + 0.165X
- d)-0.33 + 0.365X
Correct answer is option 'A'. Can you explain this answer?
Following figure is for Q8-Q10.
AB= 2m, BC= 3m, CD= 3m
B is pin support, D is roller and C is just an arbitrary point.
AB= 2m, BC= 3m, CD= 3m
B is pin support, D is roller and C is just an arbitrary point.
Q. What will be the ILD equation for ILD of shear at point C for AB part of beam?
a)
-0.33 + 0.165X
b)
-0.33 + 0.265X
c)
-0.43 + 0.165X
d)
-0.33 + 0.365X
|
|
Gauri Sarkar answered |
Answer: a
Explanation: Apply unit load between point A and B and conserve moment about point B.
Explanation: Apply unit load between point A and B and conserve moment about point B.
Following figure is for questions 5 and 5.
AB is of length 1m.Q. What will be the equation for vertical reaction at point A (RAY)?- a)RAY = 1-X
- b)RAY = 2-X
- c)RAY = 3-X
- d)RAY = 4-X
Correct answer is option 'A'. Can you explain this answer?
Following figure is for questions 5 and 5.
AB is of length 1m.
AB is of length 1m.
Q. What will be the equation for vertical reaction at point A (RAY)?
a)
RAY = 1-X
b)
RAY = 2-X
c)
RAY = 3-X
d)
RAY = 4-X
|
|
Poulomi Patel answered |
Answer: a
Explanation: Place unit load at any variable distance X and calculate RAY by conserving moment about point B.
Explanation: Place unit load at any variable distance X and calculate RAY by conserving moment about point B.
A and C is a pin support while B is roller support.
XL and XR are centroid of uniform loading on beams AB and BC respectively.
IL and IR are given.
LR and LL are length of beams.
AR and AL are areas of beams.Q. Which of the following is method for solving indeterminate structures?- a)1 moment equation
- b)2 moment equation
- c)3 moment equation
- d)4 moment equation
Correct answer is option 'C'. Can you explain this answer?
A and C is a pin support while B is roller support.
XL and XR are centroid of uniform loading on beams AB and BC respectively.
IL and IR are given.
LR and LL are length of beams.
AR and AL are areas of beams.
XL and XR are centroid of uniform loading on beams AB and BC respectively.
IL and IR are given.
LR and LL are length of beams.
AR and AL are areas of beams.
Q. Which of the following is method for solving indeterminate structures?
a)
1 moment equation
b)
2 moment equation
c)
3 moment equation
d)
4 moment equation
|
|
Kirti Sharma answered |
Answer: c
Explanation: We will be discussing this method in detail subsequently.
Explanation: We will be discussing this method in detail subsequently.
Ray = reaction at support A in y direction.
Sign convention is as usual.
Beam is linear elastic.
Point A is a pin joint and point B and C are roller support. D is just an arbitrary point.
Unit load is applied at point D.Q. Which of the following is equal to Ray?- a)Faa/Fda
- b)–Faa/Fda
- c)Fda/Faa
- d)–Fda/Faa
Correct answer is option 'C'. Can you explain this answer?
Ray = reaction at support A in y direction.
Sign convention is as usual.
Beam is linear elastic.
Point A is a pin joint and point B and C are roller support. D is just an arbitrary point.
Unit load is applied at point D.
Sign convention is as usual.
Beam is linear elastic.
Point A is a pin joint and point B and C are roller support. D is just an arbitrary point.
Unit load is applied at point D.
Q. Which of the following is equal to Ray?
a)
Faa/Fda
b)
–Faa/Fda
c)
Fda/Faa
d)
–Fda/Faa
|
|
Pallabi Bajaj answered |
Answer: c
Explanation: Just replacing the value of Fad in the answer of Q1 will give us the result. This relation will be the basic equation for ILD of indeterminate structures.
Explanation: Just replacing the value of Fad in the answer of Q1 will give us the result. This relation will be the basic equation for ILD of indeterminate structures.
Following figure is for Q2-Q7.
AC= 1m, CB =3 m
C is just an arbitrary point. A is pin support and B is a roller type support.Q. If we have to apply a concentrated load in the above shown beam, such that shear at C becomes max. , where should we apply that load?- a)At A
- b)At B
- c)At C
- d)Midway between A and C
Correct answer is option 'C'. Can you explain this answer?
Following figure is for Q2-Q7.
AC= 1m, CB =3 m
C is just an arbitrary point. A is pin support and B is a roller type support.
AC= 1m, CB =3 m
C is just an arbitrary point. A is pin support and B is a roller type support.
Q. If we have to apply a concentrated load in the above shown beam, such that shear at C becomes max. , where should we apply that load?
a)
At A
b)
At B
c)
At C
d)
Midway between A and C
|
|
Lakshmi Datta answered |
Answer: c
Explanation: If we draw ILD according to the above given equations, we will see that peak of ILD comes at point C
Explanation: If we draw ILD according to the above given equations, we will see that peak of ILD comes at point C
Following figure is for Q2-Q7.
AC= 1m, CB =3 m
C is just an arbitrary point. A is pin support and B is a roller type support.Q. What will be the shear developed at point C if a uniform load of 10KN/m is applied between point B and C?- a)10.25 KN
- b)11.25 KN
- c)12.25 KN
- d)13.25 KN
Correct answer is option 'B'. Can you explain this answer?
Following figure is for Q2-Q7.
AC= 1m, CB =3 m
C is just an arbitrary point. A is pin support and B is a roller type support.
AC= 1m, CB =3 m
C is just an arbitrary point. A is pin support and B is a roller type support.
Q. What will be the shear developed at point C if a uniform load of 10KN/m is applied between point B and C?
a)
10.25 KN
b)
11.25 KN
c)
12.25 KN
d)
13.25 KN
|
|
Gauri Sarkar answered |
Answer: b
Explanation: In case of uniform load, area of ILD curve multiplied by uniform load gives the shear.
Explanation: In case of uniform load, area of ILD curve multiplied by uniform load gives the shear.
Ray = reaction at support A in y direction.
Sign convention is as usual.
Beam is linear elastic.
Point A is a pin joint and point B and C are roller support. D is just an arbitrary point.
Unit load is applied at point D.Q. The relationship between Ray,Fda and Faa is valid only for point A.
State whether the above statement is true or false.- a)True
- b)False
Correct answer is option 'B'. Can you explain this answer?
Ray = reaction at support A in y direction.
Sign convention is as usual.
Beam is linear elastic.
Point A is a pin joint and point B and C are roller support. D is just an arbitrary point.
Unit load is applied at point D.
Sign convention is as usual.
Beam is linear elastic.
Point A is a pin joint and point B and C are roller support. D is just an arbitrary point.
Unit load is applied at point D.
Q. The relationship between Ray,Fda and Faa is valid only for point A.
State whether the above statement is true or false.
State whether the above statement is true or false.
a)
True
b)
False
|
|
Garima Kulkarni answered |
Answer: b
Explanation: It is valid for all supports like B and C, just replace all a’s by that point. We haven’t used any support conditions of point A while deriving this equation.
Explanation: It is valid for all supports like B and C, just replace all a’s by that point. We haven’t used any support conditions of point A while deriving this equation.
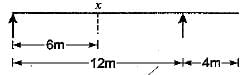
Select the correct influence line diagram for shear force at x of the following beam
- a)
- b)
- c)
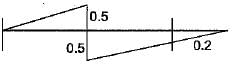
- d)
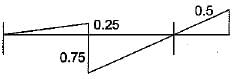
Correct answer is option 'B'. Can you explain this answer?
Select the correct influence line diagram for shear force at x of the following beam
a)
b)
c)
d)
|
|
Anisha Chakraborty answered |
Maximum shear force is at either of the support due to a point load
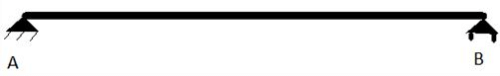
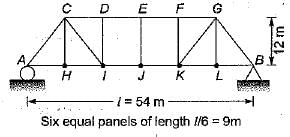
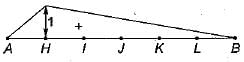
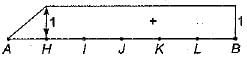
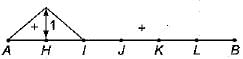
Which one of the following is the influence line for the force in the member U1L2 of the plane pin-jointed frame shown in the figure given below?
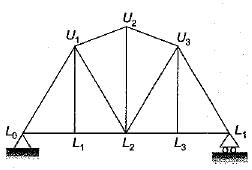
- a)
- b)
- c)
- d)
Correct answer is option 'B'. Can you explain this answer?
Which one of the following is the influence line for the force in the member U1L2 of the plane pin-jointed frame shown in the figure given below?
a)
b)
c)
d)

|
Constructing Careers answered |
The influence line for the force in member U1L2 of the given frame can be determined by analysing how the applied loads affect that specific member. To find this, follow these steps:
- Identify the location of member U1L2 within the frame.
- Consider moving a unit load across the entire span of the frame.
- At each position of the load, calculate the force in member U1L2.
- Plot these forces against the position of the load to create the influence line.
In this case, the correct influence line will show how the force in U1L2 varies with the position of the unit load. The line will typically peak where the load has the greatest effect on the member.
Based on this analysis, option B correctly represents the influence line for the force in member U1L2.
The ordinates of influence line diagram for bending moment always have the dimension of- a)force
- b)length
- c)force x length
- d)force/length
Correct answer is option 'B'. Can you explain this answer?
The ordinates of influence line diagram for bending moment always have the dimension of
a)
force
b)
length
c)
force x length
d)
force/length
|
|
Raj Chaudhary answered |
Introduction:
The influence line diagram for bending moment is a graphical representation that shows the variation of bending moment at a particular section of a structure due to the application of a unit load at different positions along the structure. It is a powerful tool used in structural analysis to determine the maximum and minimum bending moments and their locations.
Explanation:
The ordinates of the influence line diagram for bending moment represent the magnitude of the bending moment at a specific location on the structure. These ordinates are measured along the vertical axis of the influence line diagram.
Dimension of the Ordinates:
The dimension of the ordinates of the influence line diagram for bending moment is the same as the dimension of the bending moment itself. Bending moment is expressed in units of force multiplied by length, commonly known as moment units (kNm, lb-ft, etc.).
Reasoning:
The bending moment at a section of a structure is the product of the force applied and the perpendicular distance from the section to the line of action of the force. This perpendicular distance is a length measurement.
Conclusion:
Therefore, the ordinates of the influence line diagram for bending moment have the dimension of length. This is because the bending moment itself is a force multiplied by length, and the ordinates represent the magnitude of the bending moment at specific locations on the structure.
While writing influence line equations, left most point is always considered as origin and following sign convention is followed.Q. in influence line diagrams (ILD) :-- a)Points remain fixed, position of load changes
- b)Points change, position of loads remain fixed
- c)Both of them changes
- d)Neither of them changes
Correct answer is option 'A'. Can you explain this answer?
While writing influence line equations, left most point is always considered as origin and following sign convention is followed.
Q. in influence line diagrams (ILD) :-
a)
Points remain fixed, position of load changes
b)
Points change, position of loads remain fixed
c)
Both of them changes
d)
Neither of them changes
|
|
Poulomi Patel answered |
Answer: a
Explanation: In ILD we analyze effect of a force or moment on a fixed point by constantly varying point of application of load/moment.
Explanation: In ILD we analyze effect of a force or moment on a fixed point by constantly varying point of application of load/moment.
Ray = reaction at support A in y direction.
Sign convention is as usual.
Beam is linear elastic.
Point A is a pin joint and point B and C are roller support. D is just an arbitrary point.
Unit load is applied at point D.Q. What will be the value of Ray in the above figure?- a)Fad/Faa
- b)–Fad/Faa
- c)Fda/Faa
- d)–Fda/Faa
Correct answer is option 'B'. Can you explain this answer?
Ray = reaction at support A in y direction.
Sign convention is as usual.
Beam is linear elastic.
Point A is a pin joint and point B and C are roller support. D is just an arbitrary point.
Unit load is applied at point D.
Sign convention is as usual.
Beam is linear elastic.
Point A is a pin joint and point B and C are roller support. D is just an arbitrary point.
Unit load is applied at point D.
Q. What will be the value of Ray in the above figure?
a)
Fad/Faa
b)
–Fad/Faa
c)
Fda/Faa
d)
–Fda/Faa
|
|
Pallabi Chavan answered |
Answer: b
Explanation: If we remove the support at point A and replace it by force Faa. Due to sign convention, its direction will be initially considered upward.
Explanation: If we remove the support at point A and replace it by force Faa. Due to sign convention, its direction will be initially considered upward.
Following figure is for Q2-Q7.
AC= 1m, CB =3 m
C is just an arbitrary point. A is pin support and B is a roller type support.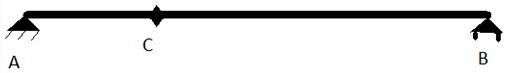 Q. What will be the equation of ILD of shear force at point C for AC part?
- a).25X – 1.25
- b).25X – 2.25
- c).25X – .25
- d).25X + .25
Correct answer is option 'C'. Can you explain this answer?
Following figure is for Q2-Q7.
AC= 1m, CB =3 m
C is just an arbitrary point. A is pin support and B is a roller type support.
AC= 1m, CB =3 m
C is just an arbitrary point. A is pin support and B is a roller type support.
Q. What will be the equation of ILD of shear force at point C for AC part?
a)
.25X – 1.25
b)
.25X – 2.25
c)
.25X – .25
d)
.25X + .25
|
|
Bhavya Ahuja answered |
Answer: c
Explanation: Just assume force at any point between AC and conserve moment about point A.
Explanation: Just assume force at any point between AC and conserve moment about point A.
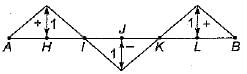
Influence line diagram for a truss member is shown in the above figure. Positive values indicate tension. Dead load of the truss is 20 kN/m and the live load is 10 kN/m. Live load is longer than the span. Maximum tensile force in the member is:- a)600 kN
- b)400 kN
- c)300 kN
- d)200 kN
Correct answer is option 'B'. Can you explain this answer?
Influence line diagram for a truss member is shown in the above figure. Positive values indicate tension. Dead load of the truss is 20 kN/m and the live load is 10 kN/m. Live load is longer than the span. Maximum tensile force in the member is:
a)
600 kN
b)
400 kN
c)
300 kN
d)
200 kN
|
|
Subhankar Khanna answered |
Tensile force due to D.L.
= (20 - 10) x 20 = 200 kN
Maximum Tensile force due to L.L.
= 20 x 10 = 200 kN
Thus maximum tensile force
= 200 + 200 = 400 kN
= (20 - 10) x 20 = 200 kN
Maximum Tensile force due to L.L.
= 20 x 10 = 200 kN
Thus maximum tensile force
= 200 + 200 = 400 kN
The influence line for horizontal thrust of a two- hinged parabolic arch of span i’ and rise 'h' will be shown in- a)
- b)
- c)

- d)None of these
Correct answer is option 'B'. Can you explain this answer?
The influence line for horizontal thrust of a two- hinged parabolic arch of span i’ and rise 'h' will be shown in
a)
b)
c)
d)
None of these
|
|
Gitanjali Menon answered |
Figure in (a) is the I.L.D. of horizontal, thrust for three hinged arch
What will be the value of Rba?- a)1
- b)0
- c)2
- d)3
Correct answer is option 'B'. Can you explain this answer?
What will be the value of Rba?
a)
1
b)
0
c)
2
d)
3
|
|
Tanishq Nair answered |
Answer: b
Explanation: Δba will be zero as it is roller supported.
Explanation: Δba will be zero as it is roller supported.
Following figure is for questions 5 and 5.
AB is of length 1m.Q. What will be the shape of ILD curve for vertical reaction at point A (RAY)?- a)Triangular
- b)Circular
- c)Rectangular
- d)Trapezoidal
Correct answer is option 'A'. Can you explain this answer?
Following figure is for questions 5 and 5.
AB is of length 1m.
AB is of length 1m.
Q. What will be the shape of ILD curve for vertical reaction at point A (RAY)?
a)
Triangular
b)
Circular
c)
Rectangular
d)
Trapezoidal
|
|
Pallabi Tiwari answered |
Answer: a
Explanation: On plotting the above given equation, shape of curve will come out to be triangular.
Explanation: On plotting the above given equation, shape of curve will come out to be triangular.
The Muller-Breslau principle can be used to
1. Determine the shape of the influence line
2. Indicate the parts of the structure to be loaded to obtain the maximum effect
3. Calculate the ordinates of the influence linesWhich of the these statements is/are correct? - a)only 1
- b)both 1 and 2
- c)both 2 and 3
- d)1, 2 and 3
Correct answer is option 'D'. Can you explain this answer?
The Muller-Breslau principle can be used to
1. Determine the shape of the influence line
2. Indicate the parts of the structure to be loaded to obtain the maximum effect
3. Calculate the ordinates of the influence lines
1. Determine the shape of the influence line
2. Indicate the parts of the structure to be loaded to obtain the maximum effect
3. Calculate the ordinates of the influence lines
Which of the these statements is/are correct?
a)
only 1
b)
both 1 and 2
c)
both 2 and 3
d)
1, 2 and 3
|
|
Tarun Shah answered |
The Muller-Breslau principle is a method used for calculating influence lines for determining the effects of moving loads on a structure. It is based on the principle that the displacement of a structure due to a unit load at any point is proportional to the area of the influence line.
The principle can be used to:
1. Determine the shape of the influence line: The shape of the influence line can be determined by considering the structure as a continuous beam and calculating the deflection at any point due to a unit load moving along the beam. The influence line is then plotted by taking the ratio of the deflection to the length of the beam.
2. Indicate the parts of the structure to be loaded to obtain the maximum effect: The Muller-Breslau principle can also be used to determine the position of the load on the structure that will produce the maximum effect. This is done by finding the point along the influence line where the product of the load and the area under the influence line is maximum.
3. Calculate the ordinates of the influence lines: The Muller-Breslau principle can also be used to calculate the ordinates of the influence lines at any point along the beam. This is done by dividing the area under the influence line up to that point by the length of the beam.
Therefore, all three statements are correct and the correct answer is option 'D'.
What will be the value of Rca?- a)1
- b)0
- c)0.652
- d)0.852
Correct answer is option 'D'. Can you explain this answer?
What will be the value of Rca?
a)
1
b)
0
c)
0.652
d)
0.852
|
|
Ishani Basu answered |
Answer: d
Explanation: It will be the ration of Δca and Δaa. Δaa is 1944/EI and Δca is 1656/EI
Explanation: It will be the ration of Δca and Δaa. Δaa is 1944/EI and Δca is 1656/EI
Following figure is for Q8-Q10.
AB= 2m, BC= 3m, CD= 3m
B is pin support, D is roller and C is just an arbitrary point.Q. What will be the ILD equation for ILD of shear at point D?- a)-.43 + 0.16625X
- b)-.33 + 0.16625X
- c)-.53 + 0.16625X
- d)-.33 + 0.216625X
Correct answer is option 'B'. Can you explain this answer?
Following figure is for Q8-Q10.
AB= 2m, BC= 3m, CD= 3m
B is pin support, D is roller and C is just an arbitrary point.
AB= 2m, BC= 3m, CD= 3m
B is pin support, D is roller and C is just an arbitrary point.
Q. What will be the ILD equation for ILD of shear at point D?
a)
-.43 + 0.16625X
b)
-.33 + 0.16625X
c)
-.53 + 0.16625X
d)
-.33 + 0.216625X
|
|
Pallabi Tiwari answered |
Answer: b
Explanation: Apply load at any point and conserve moment about point B.
Explanation: Apply load at any point and conserve moment about point B.
Following figure is for questions 7 and 8.
AB = BC = 1mQ. Maximum point of ILD always lies at the point at which load is applied.
State whether the above statement is true or false.- a)True
- b)False
Correct answer is option 'B'. Can you explain this answer?
Following figure is for questions 7 and 8.
AB = BC = 1m
AB = BC = 1m
Q. Maximum point of ILD always lies at the point at which load is applied.
State whether the above statement is true or false.
State whether the above statement is true or false.
a)
True
b)
False
|
|
Anshul Chakraborty answered |
Answer: b
Explanation: In the above example above sentence is proved wrong.
Explanation: In the above example above sentence is proved wrong.
A is a fixed support and B is roller.
AB = 18m.
C is a point at a distance of 6m from point A.
D is a point at a distance of 6m from point B.
Assume E and I to be given.Q. How many redundant forces are there in the above structure?- a)0
- b)1
- c)2
- d)3
Correct answer is option 'B'. Can you explain this answer?
A is a fixed support and B is roller.
AB = 18m.
C is a point at a distance of 6m from point A.
D is a point at a distance of 6m from point B.
Assume E and I to be given.
AB = 18m.
C is a point at a distance of 6m from point A.
D is a point at a distance of 6m from point B.
Assume E and I to be given.
Q. How many redundant forces are there in the above structure?
a)
0
b)
1
c)
2
d)
3
|
|
Aditi Sarkar answered |
Answer: b
Explanation: 1 redundant force is there as it is equal to DSI.
We have taken the horizontal force at point A as redundant force.
Explanation: 1 redundant force is there as it is equal to DSI.
We have taken the horizontal force at point A as redundant force.
While writing influence line equations, left most point is always considered as origin and following sign convention is followed.Q. In BMD and SFD :-- a)Points remain fixed, position of load changes
- b)Points change, position of loads remain fixed
- c)Both of them changes
- d)Neither of them changes
Correct answer is option 'B'. Can you explain this answer?
While writing influence line equations, left most point is always considered as origin and following sign convention is followed.
Q. In BMD and SFD :-
a)
Points remain fixed, position of load changes
b)
Points change, position of loads remain fixed
c)
Both of them changes
d)
Neither of them changes
|
|
Sahil Chawla answered |
Answer: b
Explanation: In BMD and SFD, we analyze the structure by fixing loads initially.
Explanation: In BMD and SFD, we analyze the structure by fixing loads initially.
A is a fixed support and B is roller.
AB = 18m.
C is a point at a distance of 6m from point A.
D is a point at a distance of 6m from point B.
Assume E and I to be given.What is the DSI for this structure?- a)1
- b)2
- c)3
- d)4
Correct answer is option 'A'. Can you explain this answer?
A is a fixed support and B is roller.
AB = 18m.
C is a point at a distance of 6m from point A.
D is a point at a distance of 6m from point B.
Assume E and I to be given.
AB = 18m.
C is a point at a distance of 6m from point A.
D is a point at a distance of 6m from point B.
Assume E and I to be given.
What is the DSI for this structure?
a)
1
b)
2
c)
3
d)
4
|
|
Sankar Dasgupta answered |
Answer: a
Explanation: Total 4 unknowns are there and 3 equations are there.
Explanation: Total 4 unknowns are there and 3 equations are there.
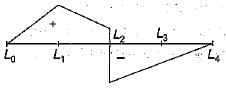
A and C is a pin support while B is roller support.
XL and XR are centroid of uniform loading on beams AB and BC respectively.
IL and IR are given.
LR and LL are length of beams.
AR and AL are areas of beams.Q. 3 moment method is valid in:-- a)single span beams
- b)only double span beams
- c)double and single span beams
- d)only multiple span beams
Correct answer is option 'D'. Can you explain this answer?
A and C is a pin support while B is roller support.
XL and XR are centroid of uniform loading on beams AB and BC respectively.
IL and IR are given.
LR and LL are length of beams.
AR and AL are areas of beams.
XL and XR are centroid of uniform loading on beams AB and BC respectively.
IL and IR are given.
LR and LL are length of beams.
AR and AL are areas of beams.
Q. 3 moment method is valid in:-
a)
single span beams
b)
only double span beams
c)
double and single span beams
d)
only multiple span beams
|
|
Sreemoyee Chauhan answered |
Answer: d
Explanation: This method is valid in only multiple span beam i.e. including double span.
Explanation: This method is valid in only multiple span beam i.e. including double span.
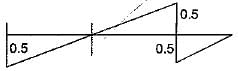
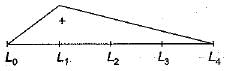
For the continuous beam shown in figure, the influence line diagram for support reaction at D is best represented as
- a)
- b)
- c)
- d)
Correct answer is option 'C'. Can you explain this answer?
For the continuous beam shown in figure, the influence line diagram for support reaction at D is best represented as
a)
b)
c)
d)
|
|
Athira Pillai answered |
The ILD for support reaction at D can be obtained by:giving unit displacement in the direction of reaction. The deflected shape of beam will represent ILD as in figure (c).
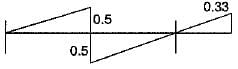
For the pin-joined plane truss shown in the below figure, which of the following diagrams represents the influence line for the bar force in the member CH?
+ sign indicates tension
- sign indicates compression- a)
- b)
- c)
- d)
Correct answer is option 'B'. Can you explain this answer?
For the pin-joined plane truss shown in the below figure, which of the following diagrams represents the influence line for the bar force in the member CH?
+ sign indicates tension
- sign indicates compression
+ sign indicates tension
- sign indicates compression
a)
b)
c)
d)

|
Machine Experts answered |
To determine the influence line for the bar force in the member CH of the pin-joined plane truss, we need to consider the effects of a moving load on the structure. The influence line shows how the internal force in a member varies as a point load moves across the truss.
- The influence line for CH will peak when the load is directly over the member.
- As the load moves away from CH, the internal force will decrease.
- The shape of the influence line typically resembles a triangular or trapezoidal form depending on the geometry of the truss.
- In this case, the correct diagram will show a positive value when the load is over CH, indicating tension, and a negative value when the load is further away, indicating compression.
By analysing the diagrams provided, option B correctly represents the influence line for member CH.
Chapter doubts & questions for Influence Lines - 6 Months Preparation for GATE Civil Engg 2025 is part of Civil Engineering (CE) exam preparation. The chapters have been prepared according to the Civil Engineering (CE) exam syllabus. The Chapter doubts & questions, notes, tests & MCQs are made for Civil Engineering (CE) 2025 Exam. Find important definitions, questions, notes, meanings, examples, exercises, MCQs and online tests here.
Chapter doubts & questions of Influence Lines - 6 Months Preparation for GATE Civil Engg in English & Hindi are available as part of Civil Engineering (CE) exam.
Download more important topics, notes, lectures and mock test series for Civil Engineering (CE) Exam by signing up for free.
6 Months Preparation for GATE Civil Engg
488 videos|1261 docs|878 tests
|
|
© EduRev
|
Education Revolution
|


|


Signup on EduRev and stay on top of your study goals
10M+ students crushing their study goals daily