


All Exams >
Electrical Engineering (EE) >
6 Months Preparation for GATE Electrical >
All Questions
All questions of Column/Bar Graphs for Electrical Engineering (EE) Exam
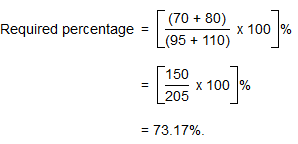
Practice Quiz or MCQ (Multiple Choice Questions) with solutions are available for Practice, which would help you prepare for "Bar Graphs" under LR and DI. You can practice these practice quizzes as per your speed and improvise the topic. The same topic is covered under various competitive examinations like - CAT, GMAT, Bank PO, SSC and other competitive examinations.Q. What is the ratio of the total sales of branch B2 for both years to the total sales of branch B4 for both years?
- a)2:3
- b)
3:5 - c)4:5
- d)7:9
Correct answer is option 'D'. Can you explain this answer?
Practice Quiz or MCQ (Multiple Choice Questions) with solutions are available for Practice, which would help you prepare for "Bar Graphs" under LR and DI. You can practice these practice quizzes as per your speed and improvise the topic. The same topic is covered under various competitive examinations like - CAT, GMAT, Bank PO, SSC and other competitive examinations.
Q.
What is the ratio of the total sales of branch B2 for both years to the total sales of branch B4 for both years?
a)
2:3
b)
3:5
c)
4:5
d)
7:9
|
|
Nilesh Kumar answered |
Required ratio = 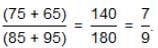

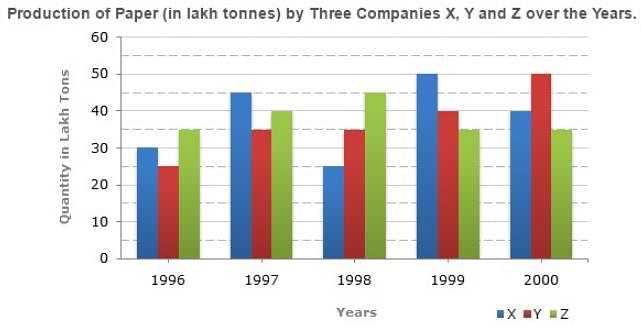
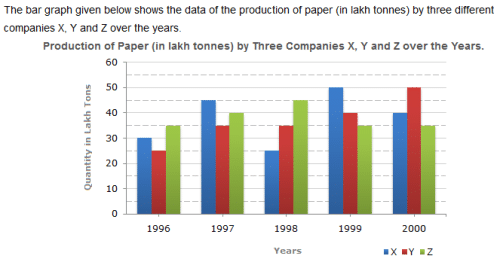 In which year was the percentage of production of Company Z to the production of Company Y the maximum?
- a)1996
- b)1997
- c)1998
- d)1999
Correct answer is option 'A'. Can you explain this answer?
In which year was the percentage of production of Company Z to the production of Company Y the maximum?
a)
1996
b)
1997
c)
1998
d)
1999

|
Sasidhar Addaguduru answered |
The answer would be 1996 because the percentage also depends on initial value even though the quantity increase is more in 1998 but the initial value is also high, So it will not be the correct one.
Chlorophyll is found in oval-shaped structures called as- a)stomata
- b)stoma
- c)chloroplast
- d)centrioles
Correct answer is option 'C'. Can you explain this answer?
Chlorophyll is found in oval-shaped structures called as
a)
stomata
b)
stoma
c)
chloroplast
d)
centrioles
|
|
Pooja Shah answered |
The 'chlorophyll' is found in the oval shaped structures known as Chloroplast.
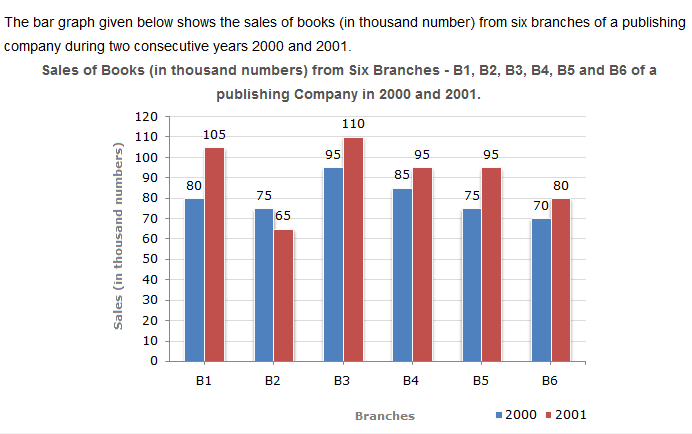


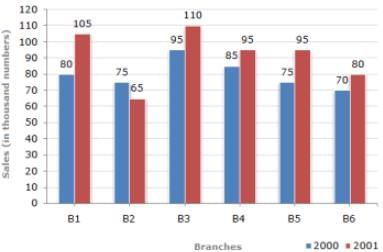
The bar graph given below shows the sales of books (in thousand number) from six branches of a publishing company during two consecutive years 2000 and 2001.Sales of Books (in thousand numbers) from Six Branches - B1, B2, B3, B4, B5 and B6 of a publishing
Company in 2000 and 2001.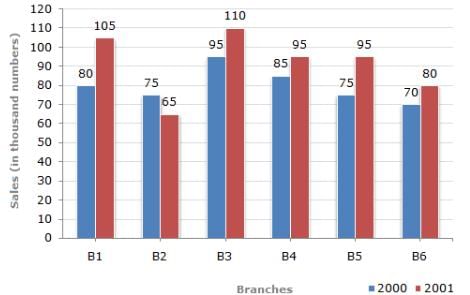
Q. Total sales of branches B1, B3 and B5 together for both the years (in thousand numbers) is?- a)250
- b)310
- c)435
- d)560
Correct answer is option 'D'. Can you explain this answer?
The bar graph given below shows the sales of books (in thousand number) from six branches of a publishing company during two consecutive years 2000 and 2001.
Sales of Books (in thousand numbers) from Six Branches - B1, B2, B3, B4, B5 and B6 of a publishing
Company in 2000 and 2001.
Company in 2000 and 2001.
Q. Total sales of branches B1, B3 and B5 together for both the years (in thousand numbers) is?
a)
250
b)
310
c)
435
d)
560

|
Pallavi Shah answered |
Total sales of branches B1, B3 and B5 for both the years (in thousand numbers)
= (80 + 105) + (95 + 110) + (75 + 95)
= 560.
 For which of the following years, the percentage rise/fall in production from the previous year is the maximum for Company Y?
- a)1997
- b)1998
- c)1999
- d)2000
Correct answer is option 'A'. Can you explain this answer?
For which of the following years, the percentage rise/fall in production from the previous year is the maximum for Company Y?
a)
1997
b)
1998
c)
1999
d)
2000

|
Ishani Rane answered |
Percentage change (rise/fall) in the production of Company Y in comparison to the previous year, for different years are:
For 1997 = [(35 - 25)/25x 100]% = 40%.
For 1998 = [ (35 - 35)/35 x 100]% = 0%.
For 1999 = [ (40 - 35)/35 x 100 ]% = 14.29%.
For 2000 = [(50 - 40)/40 x 100]% = 25%.
Hence, the maximum percentage rise/fall in the production of Company Y is for 1997.
Out of the two bar graphs provided below, one shows the amounts (in Lakh Rs.) invested by a Company in purchasing raw materials over the years and the other shows the values (in Lakh Rs.) of finished goods sold by the Company over the years.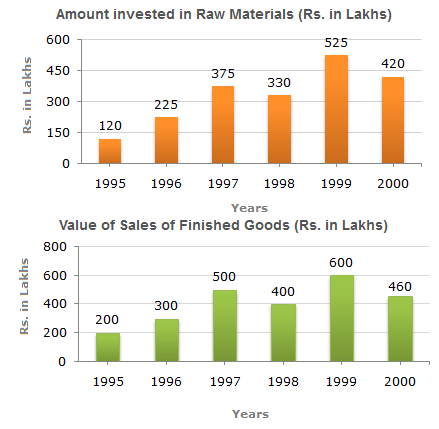 In which year, the percentage change (compared to the previous year) in the investment on Raw materials is same as that in the value of sales of finished goods?
- a)1996
- b)1997
- c)1998
- d)1999
Correct answer is option 'B'. Can you explain this answer?
Out of the two bar graphs provided below, one shows the amounts (in Lakh Rs.) invested by a Company in purchasing raw materials over the years and the other shows the values (in Lakh Rs.) of finished goods sold by the Company over the years.
In which year, the percentage change (compared to the previous year) in the investment on Raw materials is same as that in the value of sales of finished goods?
a)
1996
b)
1997
c)
1998
d)
1999

|
Manoj Ghosh answered |
The differences between the amount invested in raw material and the value of sales of finished goods for various years are:
For 1995,
= Rs. (200−120) lakhs
= Rs.80 lakhs.
For 1996,
= Rs. (300−225) lakhs
= Rs.75 lakhs.
For 1997,
= Rs. (500−375) lakhs
= Rs.125 lakhs.
For 1998,
= Rs. (400−330) lakhs
= Rs.70 lakhs.
For 1999,
= Rs. (600−525) lakhs
= Rs.75 lakhs.
For 2000,
= Rs. (460−420) lakhs
= Rs.40 lakhs.
Clearly, maximum difference was during 1997
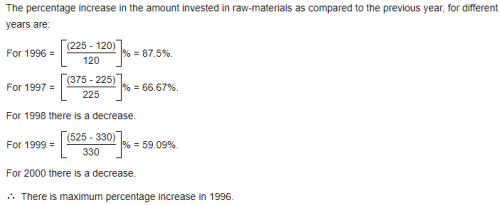
Out of the two bar graphs provided below, one shows the amounts (in Lakh Rs.) invested by a Company in purchasing raw materials over the years and the other shows the values (in Lakh Rs.) of finished goods sold by the Company over the years.In which year, there has been a maximum percentage increase in the amount invested in Raw materials as compared to the previous year?- a)1996
- b)1997
- c)1998
- d)1999
Correct answer is option 'A'. Can you explain this answer?
Out of the two bar graphs provided below, one shows the amounts (in Lakh Rs.) invested by a Company in purchasing raw materials over the years and the other shows the values (in Lakh Rs.) of finished goods sold by the Company over the years.
In which year, there has been a maximum percentage increase in the amount invested in Raw materials as compared to the previous year?
a)
1996
b)
1997
c)
1998
d)
1999
|
|
Ishani Rane answered |
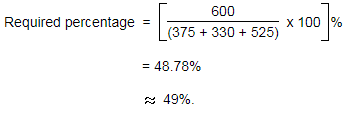
Out of the two bar graphs provided below, one shows the amounts (in Lakh Rs.) invested by a Company in purchasing raw materials over the years and the other shows the values (in Lakh Rs.) of finished goods sold by the Company over the years.The value of sales of finished goods in 1999 was approximately what percent of the sum of amount invested in Raw materials in the years 1997, 1998 and 1999?- a)33%
- b)37%
- c)45%
- d)49%
Correct answer is option 'D'. Can you explain this answer?
Out of the two bar graphs provided below, one shows the amounts (in Lakh Rs.) invested by a Company in purchasing raw materials over the years and the other shows the values (in Lakh Rs.) of finished goods sold by the Company over the years.
The value of sales of finished goods in 1999 was approximately what percent of the sum of amount invested in Raw materials in the years 1997, 1998 and 1999?
a)
33%
b)
37%
c)
45%
d)
49%

|
Kavya Sharma answered |
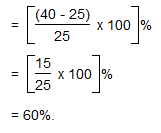
What is the percentage increase in the production of Company Y from 1996 to 1999?- a)30%
- b)45%
- c)50%
- d)60%
Correct answer is option 'D'. Can you explain this answer?
What is the percentage increase in the production of Company Y from 1996 to 1999?
a)
30%
b)
45%
c)
50%
d)
60%
|
|
Swati Datta answered |
Percentage increase in the production of Company Y from 1996 to 1999
The bar graph given below shows the percentage distribution of the total production of a car manufacturing company into various models over two years.
Percentage of Six different types of Cars manufactured by a Company over Two Years
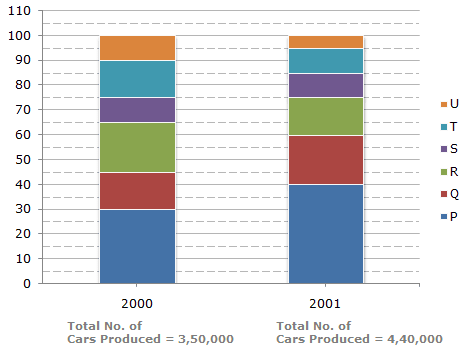 What was the difference in the number of Q type cars produced in 2000 and that produced in 2001?
- a)35,500
- b)27,000
- c)22,500
- d)17,500
Correct answer is option 'A'. Can you explain this answer?
The bar graph given below shows the percentage distribution of the total production of a car manufacturing company into various models over two years.
Percentage of Six different types of Cars manufactured by a Company over Two Years
Percentage of Six different types of Cars manufactured by a Company over Two Years
What was the difference in the number of Q type cars produced in 2000 and that produced in 2001?
a)
35,500
b)
27,000
c)
22,500
d)
17,500

|
EduRev CAT answered |
Total number of Q type cars produced in 2001
= (60 - 40)% of 4,40,000 = 88,000.
Total number of Q type cars produced in 2000
= (45 - 30)% of 3,50,000 = 52,500.
∴ Required difference = (88000 - 52500) = 35,500.
The bar graph given below shows the sales of books (in thousand number) from six branches of a publishing company during two consecutive years 2000 and 2001.
Sales of Books (in thousand numbers) from Six Branches - B1, B2, B3, B4, B5, and B6 of a publishing Company in 2000 amd 2001.
Q. What is the average sales of all the branches (in thousand numbers) for the year 2000?- a)73
- b)80
- c)83
- d)88
Correct answer is option 'B'. Can you explain this answer?
The bar graph given below shows the sales of books (in thousand number) from six branches of a publishing company during two consecutive years 2000 and 2001.
Sales of Books (in thousand numbers) from Six Branches - B1, B2, B3, B4, B5, and B6 of a publishing Company in 2000 amd 2001.
Q. What is the average sales of all the branches (in thousand numbers) for the year 2000?
Sales of Books (in thousand numbers) from Six Branches - B1, B2, B3, B4, B5, and B6 of a publishing Company in 2000 amd 2001.
Q. What is the average sales of all the branches (in thousand numbers) for the year 2000?
a)
73
b)
80
c)
83
d)
88
|
|
Sreemoyee Dey answered |
Average sales of all the six branches (in thousand number) for the year 2000
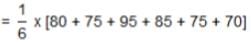
= 80.
= 80.
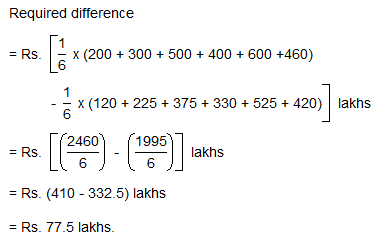
Out of the two bar graphs provided below, one shows the amounts (in Lakh Rs.) invested by a Company in purchasing raw materials over the years and the other shows the values (in Lakh Rs.) of finished goods sold by the Company over the years.What was the difference between the average amount invested in Raw materials during the given period and the average value of sales of finished goods during this period?- a)Rs. 62.5 lakhs
- b)Rs. 68.5 lakhs
- c).Rs. 71.5 lakhs
- d)Rs. 77.5 lakhs
Correct answer is option 'D'. Can you explain this answer?
Out of the two bar graphs provided below, one shows the amounts (in Lakh Rs.) invested by a Company in purchasing raw materials over the years and the other shows the values (in Lakh Rs.) of finished goods sold by the Company over the years.
What was the difference between the average amount invested in Raw materials during the given period and the average value of sales of finished goods during this period?
a)
Rs. 62.5 lakhs
b)
Rs. 68.5 lakhs
c)
.Rs. 71.5 lakhs
d)
Rs. 77.5 lakhs

|
Nayanika Basu answered |
Out of the two bar graphs provided below, one shows the amounts (in Lakh Rs.) invested by a Company in purchasing raw materials over the years and the other shows the values (in Lakh Rs.) of finished goods sold by the Company over the years.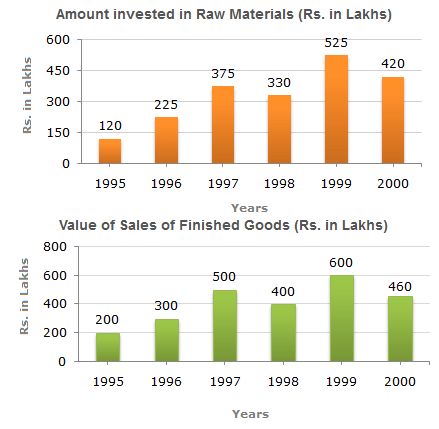 Q.The maximum difference between the amount invested in Raw materials and value of sales of finished goods was during the year?
- a)1995
- b)1996
- c)1997
- d)1998
Correct answer is option 'C'. Can you explain this answer?
Out of the two bar graphs provided below, one shows the amounts (in Lakh Rs.) invested by a Company in purchasing raw materials over the years and the other shows the values (in Lakh Rs.) of finished goods sold by the Company over the years.
Q.
The maximum difference between the amount invested in Raw materials and value of sales of finished goods was during the year?
a)
1995
b)
1996
c)
1997
d)
1998
|
|
Anjana Banerjee answered |
The differences between the amount invested in raw material and the value of sales of finished goods for various years are:
For 1995 = Rs. (200 - 120) lakhs = Rs. 80 lakhs.
For 1996 = Rs. (300 - 225) lakhs = Rs. 75 lakhs.
For 1997 = Rs. (500 - 375) lakhs = Rs. 125 lakhs.
For 1998 = Rs. (400 - 330) lakhs = Rs. 70 lakhs.
For 1999 = Rs. (600 - 525) lakhs = Rs. 75 lakhs.
For 2000 = Rs. (460 - 420) lakhs = Rs. 40 lakhs.
Clearly, maximum difference was during 1997.
Chapter doubts & questions for Column/Bar Graphs - 6 Months Preparation for GATE Electrical 2025 is part of Electrical Engineering (EE) exam preparation. The chapters have been prepared according to the Electrical Engineering (EE) exam syllabus. The Chapter doubts & questions, notes, tests & MCQs are made for Electrical Engineering (EE) 2025 Exam. Find important definitions, questions, notes, meanings, examples, exercises, MCQs and online tests here.
Chapter doubts & questions of Column/Bar Graphs - 6 Months Preparation for GATE Electrical in English & Hindi are available as part of Electrical Engineering (EE) exam.
Download more important topics, notes, lectures and mock test series for Electrical Engineering (EE) Exam by signing up for free.
6 Months Preparation for GATE Electrical
795 videos|1417 docs|800 tests
|
|
© EduRev
|
Education Revolution
|


|


Signup to see your scores
go up
within 7 days!
within 7 days!
Takes less than 10 seconds to signup