


LR Exam > LR Questions > Out of the two bar graphs provided below, one...
Start Learning for Free
Out of the two bar graphs provided below, one shows the amounts (in Lakh Rs.) invested by a Company in purchasing raw materials over the years and the other shows the values (in Lakh Rs.) of finished goods sold by the Company over the years.
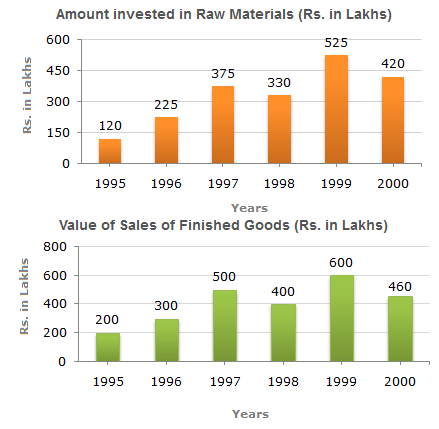
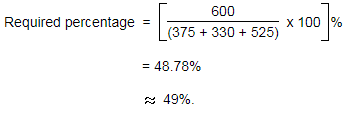
The value of sales of finished goods in 1999 was approximately what percent of the sum of amount invested in Raw materials in the years 1997, 1998 and 1999?
- a)33%
- b)37%
- c)45%
- d)49%
Correct answer is option 'D'. Can you explain this answer?

Verified Answer
Out of the two bar graphs provided below, one shows the amounts (in La...

|
Explore Courses for LR exam
|
|
Top Courses for LRView all


Question Description
Out of the two bar graphs provided below, one shows the amounts (in Lakh Rs.) invested by a Company in purchasing raw materials over the years and the other shows the values (in Lakh Rs.) of finished goods sold by the Company over the years.The value of sales of finished goods in 1999 was approximately what percent of the sum of amount invested in Raw materials in the years 1997, 1998 and 1999?a)33%b)37%c)45%d)49%Correct answer is option 'D'. Can you explain this answer? for LR 2025 is part of LR preparation. The Question and answers have been prepared according to the LR exam syllabus. Information about Out of the two bar graphs provided below, one shows the amounts (in Lakh Rs.) invested by a Company in purchasing raw materials over the years and the other shows the values (in Lakh Rs.) of finished goods sold by the Company over the years.The value of sales of finished goods in 1999 was approximately what percent of the sum of amount invested in Raw materials in the years 1997, 1998 and 1999?a)33%b)37%c)45%d)49%Correct answer is option 'D'. Can you explain this answer? covers all topics & solutions for LR 2025 Exam. Find important definitions, questions, meanings, examples, exercises and tests below for Out of the two bar graphs provided below, one shows the amounts (in Lakh Rs.) invested by a Company in purchasing raw materials over the years and the other shows the values (in Lakh Rs.) of finished goods sold by the Company over the years.The value of sales of finished goods in 1999 was approximately what percent of the sum of amount invested in Raw materials in the years 1997, 1998 and 1999?a)33%b)37%c)45%d)49%Correct answer is option 'D'. Can you explain this answer?.
Out of the two bar graphs provided below, one shows the amounts (in Lakh Rs.) invested by a Company in purchasing raw materials over the years and the other shows the values (in Lakh Rs.) of finished goods sold by the Company over the years.The value of sales of finished goods in 1999 was approximately what percent of the sum of amount invested in Raw materials in the years 1997, 1998 and 1999?a)33%b)37%c)45%d)49%Correct answer is option 'D'. Can you explain this answer? for LR 2025 is part of LR preparation. The Question and answers have been prepared according to the LR exam syllabus. Information about Out of the two bar graphs provided below, one shows the amounts (in Lakh Rs.) invested by a Company in purchasing raw materials over the years and the other shows the values (in Lakh Rs.) of finished goods sold by the Company over the years.The value of sales of finished goods in 1999 was approximately what percent of the sum of amount invested in Raw materials in the years 1997, 1998 and 1999?a)33%b)37%c)45%d)49%Correct answer is option 'D'. Can you explain this answer? covers all topics & solutions for LR 2025 Exam. Find important definitions, questions, meanings, examples, exercises and tests below for Out of the two bar graphs provided below, one shows the amounts (in Lakh Rs.) invested by a Company in purchasing raw materials over the years and the other shows the values (in Lakh Rs.) of finished goods sold by the Company over the years.The value of sales of finished goods in 1999 was approximately what percent of the sum of amount invested in Raw materials in the years 1997, 1998 and 1999?a)33%b)37%c)45%d)49%Correct answer is option 'D'. Can you explain this answer?.
Solutions for Out of the two bar graphs provided below, one shows the amounts (in Lakh Rs.) invested by a Company in purchasing raw materials over the years and the other shows the values (in Lakh Rs.) of finished goods sold by the Company over the years.The value of sales of finished goods in 1999 was approximately what percent of the sum of amount invested in Raw materials in the years 1997, 1998 and 1999?a)33%b)37%c)45%d)49%Correct answer is option 'D'. Can you explain this answer? in English & in Hindi are available as part of our courses for LR.
Download more important topics, notes, lectures and mock test series for LR Exam by signing up for free.
Here you can find the meaning of Out of the two bar graphs provided below, one shows the amounts (in Lakh Rs.) invested by a Company in purchasing raw materials over the years and the other shows the values (in Lakh Rs.) of finished goods sold by the Company over the years.The value of sales of finished goods in 1999 was approximately what percent of the sum of amount invested in Raw materials in the years 1997, 1998 and 1999?a)33%b)37%c)45%d)49%Correct answer is option 'D'. Can you explain this answer? defined & explained in the simplest way possible. Besides giving the explanation of
Out of the two bar graphs provided below, one shows the amounts (in Lakh Rs.) invested by a Company in purchasing raw materials over the years and the other shows the values (in Lakh Rs.) of finished goods sold by the Company over the years.The value of sales of finished goods in 1999 was approximately what percent of the sum of amount invested in Raw materials in the years 1997, 1998 and 1999?a)33%b)37%c)45%d)49%Correct answer is option 'D'. Can you explain this answer?, a detailed solution for Out of the two bar graphs provided below, one shows the amounts (in Lakh Rs.) invested by a Company in purchasing raw materials over the years and the other shows the values (in Lakh Rs.) of finished goods sold by the Company over the years.The value of sales of finished goods in 1999 was approximately what percent of the sum of amount invested in Raw materials in the years 1997, 1998 and 1999?a)33%b)37%c)45%d)49%Correct answer is option 'D'. Can you explain this answer? has been provided alongside types of Out of the two bar graphs provided below, one shows the amounts (in Lakh Rs.) invested by a Company in purchasing raw materials over the years and the other shows the values (in Lakh Rs.) of finished goods sold by the Company over the years.The value of sales of finished goods in 1999 was approximately what percent of the sum of amount invested in Raw materials in the years 1997, 1998 and 1999?a)33%b)37%c)45%d)49%Correct answer is option 'D'. Can you explain this answer? theory, EduRev gives you an
ample number of questions to practice Out of the two bar graphs provided below, one shows the amounts (in Lakh Rs.) invested by a Company in purchasing raw materials over the years and the other shows the values (in Lakh Rs.) of finished goods sold by the Company over the years.The value of sales of finished goods in 1999 was approximately what percent of the sum of amount invested in Raw materials in the years 1997, 1998 and 1999?a)33%b)37%c)45%d)49%Correct answer is option 'D'. Can you explain this answer? tests, examples and also practice LR tests.
|
|
Explore Courses for LR exam
|
|

Signup for Free!
Signup to see your scores go up within 7 days! Learn & Practice with 1000+ FREE Notes, Videos & Tests.
|
© EduRev
|
Education Revolution
|


|


Signup on EduRev and stay on top of your study goals
10M+ students crushing their study goals daily