


All Exams >
Mechanical Engineering >
6 Months Preparation for GATE Mechanical >
All Questions
All questions of Transportation, Assignment & Queuing Theory for Mechanical Engineering Exam
A typist at an office of a company receives on an average 20 letters per day for typing. The typist works 8 hours a day and it takes on the average 20 minutes to type a letter. The cost of a letter waiting to be mailed is 80 paise per hour and the cost of the equipment plus salary of the typist is Rs. 45 per day. What will be the total daily cost of waiting letters to be mailed?- a) 77
- b) 77
Correct answer is between ' 77, 77'. Can you explain this answer?
A typist at an office of a company receives on an average 20 letters per day for typing. The typist works 8 hours a day and it takes on the average 20 minutes to type a letter. The cost of a letter waiting to be mailed is 80 paise per hour and the cost of the equipment plus salary of the typist is Rs. 45 per day. What will be the total daily cost of waiting letters to be mailed?
a)
77
b)
77
|
|
Sarita Yadav answered |
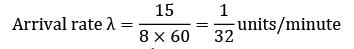
λ = 20 /day
Working hours = 8 hrs.
Cost of letter waiting to be mailed
= 80 paise/hr
= 0.8 Rs/hr.
Cost of equipment + Salary = Rs. 45/day
Total daily cost of waiting letters
= LS × cost/letter/hr × 8 +(cost of equipment + Salary)
= 5 × 0.8 × 8 + 45 = 32 + 45 = Rs. 77

A garage is manned with a single worker. Customers arrive at a rate of 20 per hour. The time required to provide service is exponentially distributed with a mean of 100 seconds. The mean waiting time (in minutes) of a customer, needing repair facility in the queue will be __________- a) 1.9
- b) 2.2
Correct answer is between ' 1.9, 2.2'. Can you explain this answer?
A garage is manned with a single worker. Customers arrive at a rate of 20 per hour. The time required to provide service is exponentially distributed with a mean of 100 seconds. The mean waiting time (in minutes) of a customer, needing repair facility in the queue will be __________
a)
1.9
b)
2.2
|
|
Avinash Sharma answered |
λ = 20/hour
= 2.08 minutes
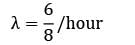
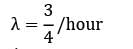
In a single server queueing model the mean arrival rate is 6 per shift of (8 hours) and the arrival follows poisson distribution. The mean service time is 50 minutes and it follows exponential distribution. The working time of the server is (hours)- a) 3 hours
- b) 4 hours
- c) 5 hours
- d) 6 hours
Correct answer is option 'C'. Can you explain this answer?
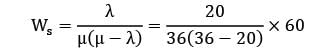
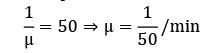
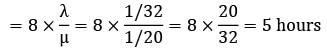
In a single server queueing model the mean arrival rate is 6 per shift of (8 hours) and the arrival follows poisson distribution. The mean service time is 50 minutes and it follows exponential distribution. The working time of the server is (hours)
a)
3 hours
b)
4 hours
c)
5 hours
d)
6 hours
|
|
Zoya Sharma answered |
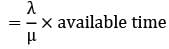
Working time of the server = ρ × available time
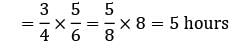
In applying Vogel’s approximation method to a profit maximation problem, row and column penalties are determined by- a)finding the largest unit cost in each row or column.
- b)finding the sum of the unit costs in each row or column.
- c)finding the difference between the two lowest unit costs in each row and column.
- d)finding the difference between the two highest unit costs in each row and column.
Correct answer is option 'D'. Can you explain this answer?
In applying Vogel’s approximation method to a profit maximation problem, row and column penalties are determined by
a)
finding the largest unit cost in each row or column.
b)
finding the sum of the unit costs in each row or column.
c)
finding the difference between the two lowest unit costs in each row and column.
d)
finding the difference between the two highest unit costs in each row and column.
|
|
Devansh Nambiar answered |
The concept of Vogel’s Approximation Method can be well understood through an illustration given below :
The difference between two least cost cells are calculated for each row and column, which can be seen in the iteration given for each row and column.
In a single server queue customers are served at a rate of μ. If W and Wq represent the mean waiting time in the system and mean waiting time in the queue respectively, then W will be equal to- a) Wq − μ
- b) Wq − μ
- c) Wq + 1/μ
- d) Wq − 1/μ
Correct answer is option 'C'. Can you explain this answer?
In a single server queue customers are served at a rate of μ. If W and Wq represent the mean waiting time in the system and mean waiting time in the queue respectively, then W will be equal to
a)
Wq − μ
b)
Wq − μ
c)
Wq + 1/μ
d)
Wq − 1/μ
|
|
Sanvi Kapoor answered |
We know that:
Waiting time in system (W) =
Waiting time in queue (Wq) =
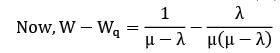

∴ W = Wq + 1/μ
In a M/M/1 queue, the service rate is- a)Poisson
- b)Exponential
- c)Linear
- d)None of the above
Correct answer is option 'A'. Can you explain this answer?
In a M/M/1 queue, the service rate is
a)
Poisson
b)
Exponential
c)
Linear
d)
None of the above

|
Poulomi Khanna answered |
Correct Answer :- a
Explanation : Arrivals occur at rate λ according to a Poisson process and move the process from state i to i + 1. Service times have an exponential distribution with rate parameter μ in the M/M/1 queue, where 1/μ is the mean service time.
Which of the following is needed to use the transportation model?- a)Capacity of the sources
- b)Demand of the destinations
- c)Unit shipping cost
- d)All of these
Correct answer is option 'D'. Can you explain this answer?
Which of the following is needed to use the transportation model?
a)
Capacity of the sources
b)
Demand of the destinations
c)
Unit shipping cost
d)
All of these
|
|
Samridhi Choudhary answered |
Capacity of the sources
- The capacity of the sources refers to the maximum amount of goods or products that can be produced or supplied from each source. This is an essential factor in the transportation model as it determines the limit on how much can be transported from each source to the destinations.
Demand of the destinations
- The demand of the destinations is the amount of goods or products that need to be delivered to each destination. This information is crucial in the transportation model as it helps in determining the total demand that needs to be met and how to allocate the transportation resources efficiently.
Unit shipping cost
- The unit shipping cost is the cost associated with transporting one unit of goods or products from a source to a destination. This cost factor is important in the transportation model as it helps in calculating the total transportation cost and optimizing the transportation routes to minimize costs.
All of these
- All of the above factors are needed to use the transportation model effectively. The capacity of the sources, demand of the destinations, and unit shipping cost are all critical inputs that are required to formulate and solve the transportation problem. By considering all these factors, the transportation model can help in determining the most cost-effective and efficient way to transport goods from sources to destinations.
Customers arrive at a ticket counter with an arrival rate of 12 customers per hour. A clerk serves the customers at a rate of 24 per hour. The probability that the clerk is busy is __________
- a)0.5
- b)0.9
- c)1.0
- d)2.0
Correct answer is option 'A'. Can you explain this answer?
Customers arrive at a ticket counter with an arrival rate of 12 customers per hour. A clerk serves the customers at a rate of 24 per hour. The probability that the clerk is busy is __________
a)
0.5
b)
0.9
c)
1.0
d)
2.0
|
|
Neha Joshi answered |
Arrival rate λ = 12/hour
Service rate μ = 24/hour
Probability that the clerk is busy is when there is at least one customer in the system
= λ/μ
In a health clinic, the average rate of arrival of patients is 12 per hour. On an average, a doctor can serve patients at the rate of one patient every four minutes. Find the utilization factor.- a) 0.2
- b) 0.8
- c) 1
- d) 0.5
Correct answer is option 'B'. Can you explain this answer?
In a health clinic, the average rate of arrival of patients is 12 per hour. On an average, a doctor can serve patients at the rate of one patient every four minutes. Find the utilization factor.
a)
0.2
b)
0.8
c)
1
d)
0.5
|
|
Sanvi Kapoor answered |
λ = 12/hour
In order for a transportation matrix which has six rows and four columns not to degenerate, what is the number of occupied cells, in the matrix?- a)6
- b)9
- c)14
- d)23
Correct answer is option 'B'. Can you explain this answer?
In order for a transportation matrix which has six rows and four columns not to degenerate, what is the number of occupied cells, in the matrix?
a)
6
b)
9
c)
14
d)
23
|
|
Avinash Sharma answered |
Number of cells for non-degenerate solution
= 6 + 4 - 1 = 9
= 6 + 4 - 1 = 9
In a queuing problem, if the arrivals are completely random, then the probability distribution of number of arrivals in a given time follows - a)Poisson distribution
- b)Normal distribution
- c)Binomial distribution
- d)Exponential distribution
Correct answer is option 'C'. Can you explain this answer?
In a queuing problem, if the arrivals are completely random, then the probability distribution of number of arrivals in a given time follows
a)
Poisson distribution
b)
Normal distribution
c)
Binomial distribution
d)
Exponential distribution
|
|
Gauri Roy answered |
Correct Answer :- C
Explanation : Number of arrivals per unit time is estimated by the Poisson's distribution.
The milk plant at a city distributes its products by trucks, loaded at the loading dock. It has its own fleet of trucks plus trucks of a private transport company. This transport company has complained that sometimes its trucks have to wait in line and thus the company loses money paid for a truck and driver that is only waiting. The company has asked the milk plant management either to go in for a second loading dock or discount prices equivalent to the waiting time. !rrival rate = 3/hour !verage service rate = 4/hour The transport company has provided 40% of the total number of trucks. The expected waiting time of company trucks per day before docking is __________- a) 7.0
- b) 7.4
Correct answer is between ' 7.0, 7.4'. Can you explain this answer?
The milk plant at a city distributes its products by trucks, loaded at the loading dock. It has its own fleet of trucks plus trucks of a private transport company. This transport company has complained that sometimes its trucks have to wait in line and thus the company loses money paid for a truck and driver that is only waiting. The company has asked the milk plant management either to go in for a second loading dock or discount prices equivalent to the waiting time. !rrival rate = 3/hour !verage service rate = 4/hour The transport company has provided 40% of the total number of trucks. The expected waiting time of company trucks per day before docking is __________
a)
7.0
b)
7.4
|
|
Sarita Yadav answered |
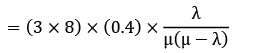
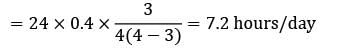
Total expected waiting time of company trucks per day
= trucks/day × % of company trucks × expected waiting time per truck
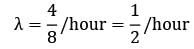
Consider a single server queuing model with Poisson arrivals (λ = 4/hour) and exponential service (μ = 4/hour). The number in the system is restricted to a maximum of 10. The probability that a person who comes in leaves without joining the queue is- a)1/11
- b)1/10
- c)1/9
- d)1/2
Correct answer is option 'A'. Can you explain this answer?
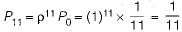
Consider a single server queuing model with Poisson arrivals (λ = 4/hour) and exponential service (μ = 4/hour). The number in the system is restricted to a maximum of 10. The probability that a person who comes in leaves without joining the queue is
a)
1/11
b)
1/10
c)
1/9
d)
1/2
|
|
Poulomi Patel answered |
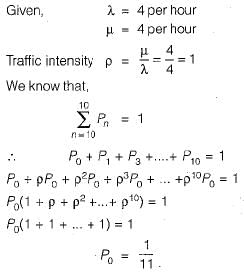
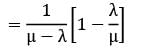
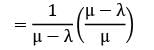
Probability that a person who comes in leaves without joining the queue i.e.
A repair shop is manned with a single worker. Customers arrive at a rate of 20 per hour. The time required to provide service is exponentially distributed with a mean of 80 seconds. If the productivity loss for an hour is Rs. 20,000 due to breakdown, what could be the expected loss?- a) 800
- b) 800
Correct answer is between ' 800, 800'. Can you explain this answer?
A repair shop is manned with a single worker. Customers arrive at a rate of 20 per hour. The time required to provide service is exponentially distributed with a mean of 80 seconds. If the productivity loss for an hour is Rs. 20,000 due to breakdown, what could be the expected loss?
a)
800
b)
800

|
Aditya Majumdar answered |
Expected Loss Calculation:
- Given data:
- Arrival rate of customers = 20 per hour
- Service time distribution mean = 80 seconds
- Productivity loss for an hour = Rs. 20,000
Calculating Utilization:
- Utilization (ρ) can be calculated using the formula:
ρ = Arrival rate * Service time = 20/3600 * 80 = 0.444
Calculating Expected Number of Customers:
- Expected number of customers in the system (Ls) can be calculated using Little's Law:
Ls = λ * Ws = 20/3600 * 80 = 0.44 customers
Calculating Expected Loss:
- Expected loss due to breakdown is Rs. 20,000 per hour.
- Expected loss per customer = Rs. 20,000 / 0.44 = Rs. 45454.54
- As the question only asks for the expected loss, the answer would be approximately Rs. 800.
Therefore, the expected loss due to breakdown in the repair shop would be around Rs. 800.
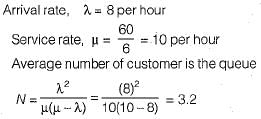
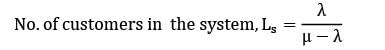
The number of customers arriving at a railway reservation counter is Poisson distributed with an arrival rate of eight customers per hour. The reservation clerk at this counter at this counter takes six minutes per customer on an average with an exponentially distributed service time. The average number of the customers in the queue will be- a)3
- b)3.2
- c)4
- d)4.2
Correct answer is option 'B'. Can you explain this answer?
The number of customers arriving at a railway reservation counter is Poisson distributed with an arrival rate of eight customers per hour. The reservation clerk at this counter at this counter takes six minutes per customer on an average with an exponentially distributed service time. The average number of the customers in the queue will be
a)
3
b)
3.2
c)
4
d)
4.2

|
Varun Mukherjee answered |
Consider a single server queueing model where the mean arrival rate is 4 per 8 hour shift and the arrivals follow poisson distribution. The mean service time is 60 minutes and it follows exponential distribution. The idle time of the server is- a) 8 hours
- b) 2 hours
- c) 4 hours
- d) 6 hours
Correct answer is option 'C'. Can you explain this answer?
Consider a single server queueing model where the mean arrival rate is 4 per 8 hour shift and the arrivals follow poisson distribution. The mean service time is 60 minutes and it follows exponential distribution. The idle time of the server is
a)
8 hours
b)
2 hours
c)
4 hours
d)
6 hours
|
|
Neha Joshi answered |
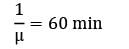
μ = 1/hour
Idle time at the server = (1 − ρ) × 8 hours
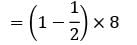
= 4 hours

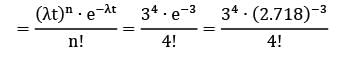
On an average, 6 customers reach a telephonic booth every hour to make calls. Determine the probability that exactly 4 customers will reach in 30 min period, assuming that arrivals follow poisson distribution.- a) 0.160
- b) 0.170
Correct answer is between ' 0.160, 0.170'. Can you explain this answer?
On an average, 6 customers reach a telephonic booth every hour to make calls. Determine the probability that exactly 4 customers will reach in 30 min period, assuming that arrivals follow poisson distribution.
a)
0.160
b)
0.170
|
|
Sarita Yadav answered |
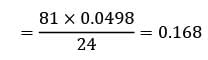
λ = 6/hour
t = 30 min = 0.5 hours
n = 4
λt = 6 × 0.5 = 3 customers
Probability of 4 customers arriving in 0.5 hour
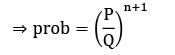
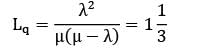
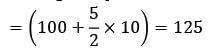
On an average 96 patients per 24-hours day require the service of an emergency clinic. Also on the average a patient requires 10 minute of active attention. Assume that the facility can handle only one emergency at a time suppose that it costs the clinic Rs.100 per patient treated to obtain an average servicing time of 10 minute, and that each minute of decrease in this average time would cost the clinic Rs.10 per patient treated. How much would have to be budgeted by the clinic to decrease the average size of the queue from113patients to 1/2 patients.(A)123(B)127
Correct answer is between ','. Can you explain this answer?
On an average 96 patients per 24-hours day require the service of an emergency clinic. Also on the average a patient requires 10 minute of active attention. Assume that the facility can handle only one emergency at a time suppose that it costs the clinic Rs.100 per patient treated to obtain an average servicing time of 10 minute, and that each minute of decrease in this average time would cost the clinic Rs.10 per patient treated. How much would have to be budgeted by the clinic to decrease the average size of the queue from
1
1
3
patients to 1/2 patients.
(A)123
(B)127
|
|
Avinash Sharma answered |
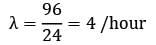
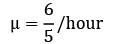
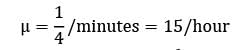
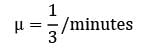
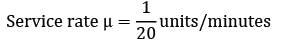
μ = 1/10 × 60 = 6/hour
This number is to be reduced from
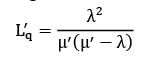
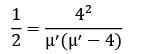
μ′ = 8, −4
μ′ = 8
Average time required by each patient
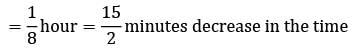
required to attend a patient
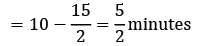
∴ budget required for each patient
The arrival rate and the service time are usually assumed to respectively follow the- a)normal distribution and exponential law
- b)poisson’s distribution and exponential law
- c)exponential law and Erlang distribution law
- d)binomial distribution and normal distribution
Correct answer is option 'D'. Can you explain this answer?
The arrival rate and the service time are usually assumed to respectively follow the
a)
normal distribution and exponential law
b)
poisson’s distribution and exponential law
c)
exponential law and Erlang distribution law
d)
binomial distribution and normal distribution
|
|
Suyash Patel answered |
Correct Answer :- d
Explanation : The arrival rate and the service time are usually assumed to respectively follow the binomial distribution and normal distribution.
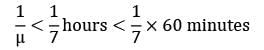
In a small clinic only one case is possible to handle at a time, patients arrive on an average of 3 per hour. The mean service time should be less than _________ minutes per patient so that the average time in the system is less than 15 minutes.- a) 8
- b) 9
Correct answer is between ' 8, 9'. Can you explain this answer?
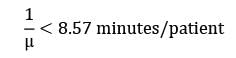
In a small clinic only one case is possible to handle at a time, patients arrive on an average of 3 per hour. The mean service time should be less than _________ minutes per patient so that the average time in the system is less than 15 minutes.
a)
8
b)
9
|
|
Sanvi Kapoor answered |
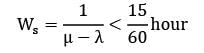
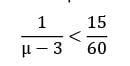
μ < 7="" />
The matrix in assignment model is- a)square maxtrix
- b)rectangular matrix
- c)diagonal matrix
- d)unit matrix
Correct answer is option 'A'. Can you explain this answer?
The matrix in assignment model is
a)
square maxtrix
b)
rectangular matrix
c)
diagonal matrix
d)
unit matrix
|
|
Athira Pillai answered |
Assignment model can be solved by conventional linear programming approach or transportation model approach, it is square matrix, having equal number of rows and columns. The objective is to assign one item from row to one item from column so that total cost of assignement is minimum.
Trains arrive at a yard every 15 minutes and the service time is 5 minutes. The probability that the yard has 3 trains in the system is __________- a) 0.020
- b) 0.030
Correct answer is between ' 0.020, 0.030'. Can you explain this answer?
Trains arrive at a yard every 15 minutes and the service time is 5 minutes. The probability that the yard has 3 trains in the system is __________
a)
0.020
b)
0.030

|
Sanchita Pillai answered |
Solution:
Given data:
Inter-arrival time = 15 min
Service time = 5 min
To find: Probability of having 3 trains in the system
Assumptions made:
- The arrival of trains follows a Poisson distribution
- The service times follow an exponential distribution
Calculation:
1. Finding average number of arrivals in a minute
Average number of arrivals in a minute (λ) = 1/15
2. Finding average number of departures in a minute
Average number of departures in a minute (μ) = 1/5
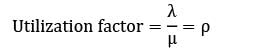
3. Finding utilization factor (ρ)
Utilization factor (ρ) = λ/μ
ρ = (1/15)/(1/5)
ρ = 1/3
4. Finding probability of having 0, 1, 2, and 3 trains in the system
Probability of having 0 trains in the system:
P0 = 1 - ρ = 1 - 1/3 = 2/3
Probability of having 1 train in the system:
P1 = ρ(1 - ρ) = (1/3)(2/3) = 2/9
Probability of having 2 trains in the system:
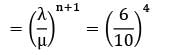
P2 = ρ^2(1 - ρ/2) = (1/9)(2/3) = 2/27
Probability of having 3 trains in the system:
P3 = ρ^3/3!(1 - ρ/3) = (1/27)(3/4) = 1/36
5. Finding the required probability
The required probability is the probability of having 3 trains in the system, which is P3 = 1/36
Therefore, the probability that the yard has 3 trains in the system is 0.028 or 0.03 (approx.)
Answer: b) 0.030
Given data:
Inter-arrival time = 15 min
Service time = 5 min
To find: Probability of having 3 trains in the system
Assumptions made:
- The arrival of trains follows a Poisson distribution
- The service times follow an exponential distribution
Calculation:
1. Finding average number of arrivals in a minute
Average number of arrivals in a minute (λ) = 1/15
2. Finding average number of departures in a minute
Average number of departures in a minute (μ) = 1/5
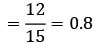
3. Finding utilization factor (ρ)
Utilization factor (ρ) = λ/μ
ρ = (1/15)/(1/5)
ρ = 1/3
4. Finding probability of having 0, 1, 2, and 3 trains in the system
Probability of having 0 trains in the system:
P0 = 1 - ρ = 1 - 1/3 = 2/3
Probability of having 1 train in the system:
P1 = ρ(1 - ρ) = (1/3)(2/3) = 2/9
Probability of having 2 trains in the system:
P2 = ρ^2(1 - ρ/2) = (1/9)(2/3) = 2/27
Probability of having 3 trains in the system:
P3 = ρ^3/3!(1 - ρ/3) = (1/27)(3/4) = 1/36
5. Finding the required probability
The required probability is the probability of having 3 trains in the system, which is P3 = 1/36
Therefore, the probability that the yard has 3 trains in the system is 0.028 or 0.03 (approx.)
Answer: b) 0.030
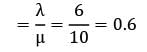
The inter-arrival times at a tool crib are exponential with an average time of 10 minutes and the length of the service time is assumed to be exponential with mean 6 minutes. The probability that a person arriving at the booth will have to wait is equal to- a) 0.15
- b) 0.40
- c) 0.42
- d) 0.6
Correct answer is option 'D'. Can you explain this answer?
The inter-arrival times at a tool crib are exponential with an average time of 10 minutes and the length of the service time is assumed to be exponential with mean 6 minutes. The probability that a person arriving at the booth will have to wait is equal to
a)
0.15
b)
0.40
c)
0.42
d)
0.6
|
|
Sanvi Kapoor answered |
Probability that person has to wait = ρ =
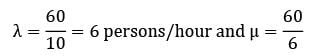
= 10 persons/hour
Therefore probability that person has to wait
Arrival rate of telephonic calls at a telephone booth are according to poisson distribution, with an average time of 9 minutes between two consecutive arrivals. The length of telephone call is assumed to be exponentially distributed with mean 3 minutes.What is the probability that an arrival will have to wait for more than 10 minutes before the phone is free?- a) 0.030
- b) 0.038
Correct answer is between ' 0.030, 0.038'. Can you explain this answer?
Arrival rate of telephonic calls at a telephone booth are according to poisson distribution, with an average time of 9 minutes between two consecutive arrivals. The length of telephone call is assumed to be exponentially distributed with mean 3 minutes.
What is the probability that an arrival will have to wait for more than 10 minutes before the phone is free?
a)
0.030
b)
0.038
|
|
Avinash Sharma answered |
Given,
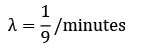
Probability (waiting time ≥ 10)
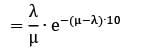
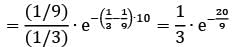
= 0.033
ln a queuing problem, if the arrivals are completely random, then the probability distribution, of number of arrivals in a given time follows:- a)Poisson distribution
- b)Normal distribution
- c)Binomial distribution
- d)Exponential distribution
Correct answer is option 'A'. Can you explain this answer?
ln a queuing problem, if the arrivals are completely random, then the probability distribution, of number of arrivals in a given time follows:
a)
Poisson distribution
b)
Normal distribution
c)
Binomial distribution
d)
Exponential distribution
|
|
Rashi Chauhan answered |
Number of arrival in queuing problem follow poisson distribution.
A repair shop is manned by a single worker. Customers arrive at the rate of 30 per hour. Time required to provide service is exponentially distributed with mean of 100 seconds. What is the mean waiting time of a customer, needing repair facility in the queue?- a)8.1 minutes
- b)9 minutes
- c)8.33 minutes
- d)9.33 minutes
Correct answer is option 'C'. Can you explain this answer?
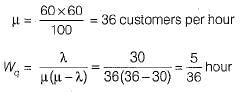
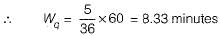
A repair shop is manned by a single worker. Customers arrive at the rate of 30 per hour. Time required to provide service is exponentially distributed with mean of 100 seconds. What is the mean waiting time of a customer, needing repair facility in the queue?
a)
8.1 minutes
b)
9 minutes
c)
8.33 minutes
d)
9.33 minutes
|
|
Varun Mukherjee answered |
λ = 30 per hour
A machine receives jobs at a rate of 20 per hour and the processing rate is 30 per hour. How much time (in minutes) on an average does a job have to wait before it gets loaded on to the machine?- a) 4
- b) 3
- c) 5
- d) 6
Correct answer is option 'A'. Can you explain this answer?
A machine receives jobs at a rate of 20 per hour and the processing rate is 30 per hour. How much time (in minutes) on an average does a job have to wait before it gets loaded on to the machine?
a)
4
b)
3
c)
5
d)
6
|
|
Nitya Nambiar answered |
Given:
- Job arrival rate = 20 per hour
- Processing rate = 30 per hour
To find:
- Average waiting time for a job before it gets loaded onto the machine
Explanation:
The average waiting time for a job can be calculated using Little's Law, which states that the average number of jobs in a system is equal to the arrival rate multiplied by the average time a job spends in the system.
Step 1: Calculate the average number of jobs in the system:
The arrival rate is given as 20 jobs per hour, so the average arrival rate per minute can be calculated by dividing it by 60 (since there are 60 minutes in an hour):
Average arrival rate = 20 / 60 = 1/3 jobs per minute
The processing rate is given as 30 jobs per hour, so the average processing rate per minute can be calculated by dividing it by 60:
Average processing rate = 30 / 60 = 1/2 jobs per minute
The average number of jobs in the system can be calculated as the ratio of the arrival rate to the processing rate:
Average number of jobs in the system = Average arrival rate / Average processing rate = (1/3) / (1/2) = 2/3 jobs
Step 2: Calculate the average time a job spends in the system:
The average time a job spends in the system can be calculated as the reciprocal of the processing rate:
Average time a job spends in the system = 1 / Average processing rate = 1 / (1/2) = 2 minutes
Step 3: Calculate the average waiting time for a job:
The average waiting time for a job can be calculated using Little's Law:
Average waiting time = Average number of jobs in the system * Average time a job spends in the system = (2/3) * 2 = 4/3 minutes
Therefore, the average waiting time for a job before it gets loaded onto the machine is 4/3 minutes, which is approximately 1.33 minutes.
A person repairing radios finds that the time spent on the radio sets has exponential distribution with mean 20 minutes. If the radios are repaired in the order in which they come in and their arrival is approximately poisson with an average rate 15 for 8 hour day. What is the repairmen’s expected idle time each day?(A)2.8(B)3.2.
Correct answer is between ','. Can you explain this answer?
A person repairing radios finds that the time spent on the radio sets has exponential distribution with mean 20 minutes. If the radios are repaired in the order in which they come in and their arrival is approximately poisson with an average rate 15 for 8 hour day. What is the repairmen’s expected idle time each day?
(A)2.8
(B)3.2.
|
|
Sanvi Kapoor answered |
No. of hours for which the repairman remains busy in an 8-hour day
∴ Time for which repairman remains idle
= 8 − 5
= 3 hours
In a large maintenance department, fitters draw parts from the parts store which is at present staffed by one store man. The maintenance foreman is concerned about the time spent by fitters getting parts and wants to know if the employment of a store labourer to assist the store man would be worthwhile. It was found that 1. fitters cost Rs.2.50/hour 2. store man costs Rs.2/hour and can deal on the average with 10 fitter per hour 3. a labourer could be employed at Rs.1.75/hour and would increase the service capacity of the store to 12/hour 4. on an average 8 fitters visit the store each hour What would be the net savings or loss if an extra labourer is employed?- a) 3.0
- b) 3.5
Correct answer is between ' 3.0, 3.5'. Can you explain this answer?
In a large maintenance department, fitters draw parts from the parts store which is at present staffed by one store man. The maintenance foreman is concerned about the time spent by fitters getting parts and wants to know if the employment of a store labourer to assist the store man would be worthwhile. It was found that 1. fitters cost Rs.2.50/hour 2. store man costs Rs.2/hour and can deal on the average with 10 fitter per hour 3. a labourer could be employed at Rs.1.75/hour and would increase the service capacity of the store to 12/hour 4. on an average 8 fitters visit the store each hour What would be the net savings or loss if an extra labourer is employed?
a)
3.0
b)
3.5
|
|
Sanvi Kapoor answered |
Without labourer:
= 4
Cost/hour = 4 × 2.50 = Rs. 10
With labourer: λ = 8/hour; μ = 12/hour
` 
= 2
Cost/hour = cost of fitters/hour + cost of labourer hour
= 2 × 2.50 + 1.75
= Rs. 6.75
Net savings = 10 − 6.75 = Rs 3.25
On an average, there are 30 customers in a queue. If the arrival rate of customers into the system is 16 customers per hour and on average 32 customers leave the system per hour, then the average number of customers in the system is- a)16.5
- b)30.5
- c)32.0
- d)46.0
Correct answer is option 'B'. Can you explain this answer?
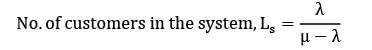
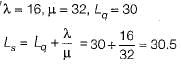
On an average, there are 30 customers in a queue. If the arrival rate of customers into the system is 16 customers per hour and on average 32 customers leave the system per hour, then the average number of customers in the system is
a)
16.5
b)
30.5
c)
32.0
d)
46.0
|
|
Ameya Deshpande answered |
If the arrivals at a service facility are distributed as per the poisson distribution with a mean rate of 10 per hour and the services are exponentially distributed with a mean service time of 4 minutes, what is the probability that a customer may have to wait to be served?- a) 0.40
- b) 0.50
- c) 0.67
- d) 1.00
Correct answer is option 'C'. Can you explain this answer?
If the arrivals at a service facility are distributed as per the poisson distribution with a mean rate of 10 per hour and the services are exponentially distributed with a mean service time of 4 minutes, what is the probability that a customer may have to wait to be served?
a)
0.40
b)
0.50
c)
0.67
d)
1.00
|
|
Anagha Mehta answered |
To calculate the probability that a customer may have to wait to be served, we need to consider the arrival rate and the service rate at the facility.
1. Calculation of Arrival Rate:
The arrival rate is given as 10 customers per hour. The Poisson distribution is used to model the arrival of customers in a given time period. The Poisson distribution is defined by its mean, which is equal to the arrival rate. Therefore, the mean arrival rate is 10 customers per hour.
2. Calculation of Service Rate:
The service time is exponentially distributed with a mean of 4 minutes. The exponential distribution is defined by its mean, which is equal to the reciprocal of the service rate. Therefore, the mean service rate is 1/4 customers per minute.
3. Utilization Factor:
The utilization factor (ρ) is the ratio of the arrival rate to the service rate. It represents the level of utilization of the facility. In this case, the utilization factor can be calculated as follows:
ρ = Arrival Rate / Service Rate
ρ = 10 customers per hour / (1/4) customers per minute
ρ = 10 * 60 / 1/4
ρ = 600 / 1/4
ρ = 600 * 4
ρ = 2400
4. Probability of Wait Time:
The probability that a customer may have to wait to be served can be calculated using the following formula:
P(wait) = ρ^2 / (1 - ρ)
Substituting the calculated value of ρ into the formula:
P(wait) = 2400^2 / (1 - 2400)
P(wait) = 5760000 / (-2399)
P(wait) ≈ 0.67
Therefore, the probability that a customer may have to wait to be served is approximately 0.67, which corresponds to option 'C'.
Consider the following statements on transportation problem:
1. In Vogel’s approximation method, priority allotment is made in the cell with the lowest cost.
2. The North-west corner method ensures faster optimal solution.
3. If the total demand is higher than the supply, transportation problem cannot be solved.
4. A feasible solution may not be an optimal solution.Which of these statements are correct?- a)1 and 4
- b)1 and 3
- c)2 and 3
- d)2 and 4
Correct answer is option 'D'. Can you explain this answer?
Consider the following statements on transportation problem:
1. In Vogel’s approximation method, priority allotment is made in the cell with the lowest cost.
2. The North-west corner method ensures faster optimal solution.
3. If the total demand is higher than the supply, transportation problem cannot be solved.
4. A feasible solution may not be an optimal solution.
Which of these statements are correct?
a)
1 and 4
b)
1 and 3
c)
2 and 3
d)
2 and 4
|
|
Raghav Mukherjee answered |
's approximation method, the difference between the two smallest transportation costs for each row and each column is calculated.
2. The Northwest corner method is an iterative method that starts by allocating the maximum possible quantity to the cell in the top-left corner, then moving to the next cell in the first row, and so on.
3. The stepping stone method is an improvement over the MODI method as it considers all the unoccupied cells and identifies the cell that can provide the maximum reduction in cost.
4. In the transportation problem, the objective is to minimize the total transportation cost while satisfying the supply and demand constraints.
Which of the statements are true?
A. 1 and 2
B. 2 and 3
C. 3 and 4
D. 1 and 4
If the number of arrival in a queue follows the poisson distribution, then the inter-arrival time obeys which one of the following distribution?- a)Poisson
- b)Negative exponential
- c)Normal
- d)Binomial
Correct answer is option 'B'. Can you explain this answer?
If the number of arrival in a queue follows the poisson distribution, then the inter-arrival time obeys which one of the following distribution?
a)
Poisson
b)
Negative exponential
c)
Normal
d)
Binomial
|
|
Tanishq Menon answered |
Explanation:
Poisson Distribution: Poisson distribution is a discrete probability distribution that expresses the probability of a given number of events occurring in a fixed interval of time or space if these events occur with a known constant mean rate λ and are independent of the time since the last event.
Inter-arrival Time: The time interval between two consecutive arrivals in a queue is called inter-arrival time.
Negative Exponential Distribution: The negative exponential distribution is a continuous probability distribution that describes the time between events in a Poisson process, i.e., a process in which events occur continuously and independently at a constant average rate.
Relation between Poisson Distribution and Negative Exponential Distribution: The inter-arrival time between two consecutive arrivals in a queue is distributed according to the negative exponential distribution if the number of arrivals in the queue follows the Poisson distribution.
Reason: The Poisson process assumes that events occur independently from each other and at a constant average rate. Therefore, the probability of an event occurring in a small time interval is proportional to the length of the time interval. The negative exponential distribution describes the time between events in a Poisson process, where the probability of an event occurring in a small time interval is proportional to the length of the time interval. Hence, the inter-arrival time between two consecutive arrivals in a queue is distributed according to the negative exponential distribution.
Which of the following term is not related to queueing?- a) Jockeying
- b) Reneging
- c) Balking
- d) Sequence
Correct answer is option 'D'. Can you explain this answer?
Which of the following term is not related to queueing?
a)
Jockeying
b)
Reneging
c)
Balking
d)
Sequence

|
Sandeep Sen answered |
Queueing Terminology:
Queueing theory is a branch of mathematics that studies the behavior of waiting lines, or queues. Various terms are used in queueing theory to describe different aspects of the queueing process.
Jockeying:
Jockeying refers to the phenomenon where customers switch between different lines or queues in search of a faster service. This behavior can impact the overall efficiency of the queueing system.
Reneging:
Reneging occurs when a customer leaves the queue before being served due to impatience or dissatisfaction with the waiting time. This can lead to lost revenue for the service provider and is an important consideration in queueing analysis.
Balking:
Balking happens when a customer decides not to join the queue at all, usually because the perceived waiting time is too long or the service quality is not up to their expectations. Understanding balking behavior is crucial for designing effective queueing systems.
Sequence:
Sequence is a term that is not directly related to queueing. In the context of queueing theory, sequence typically refers to the order in which tasks or events occur, rather than the dynamics of waiting lines and service times.
In the Kendall’s notation for representing queuing models the first position represents- a)probability law for the arrival
- b)probability law for the service
- c)number of channels
- d)capacity of the syste
Correct answer is option 'A'. Can you explain this answer?
In the Kendall’s notation for representing queuing models the first position represents
a)
probability law for the arrival
b)
probability law for the service
c)
number of channels
d)
capacity of the syste
|
|
Niharika Iyer answered |
Understanding Kendall's Notation
Kendall's notation is a standardized way to describe the characteristics of queuing systems in operations research and systems engineering. It provides a concise representation of various parameters that define how a queuing model operates.
Components of Kendall's Notation
The notation is typically expressed in the form A/B/C, where:
- A: Represents the arrival process.
- B: Represents the service process.
- C: Represents the number of servers or channels.
Focus on Arrival Process
In Kendall's notation:
- The first position (A) specifies the probability distribution of the arrival process.
- Common distributions include:
- M for Markovian (Poisson arrivals),
- D for deterministic arrivals,
- G for general arrival processes.
This aspect is crucial because it influences how customers arrive at the system, impacting overall performance metrics like wait times and queue lengths.
Importance of Arrival Characteristics
The arrival process determines:
- Rate of arrivals: How often customers enter the system.
- Variability: The consistency (or lack thereof) of the arrival times, affecting system stability and design.
Understanding the arrival distribution helps in forecasting system behavior under various conditions.
Conclusion
Therefore, the correct answer to the question regarding what the first position in Kendall's notation represents is indeed:
- a) probability law for the arrival.
This emphasizes the significance of the arrival process in defining the dynamics of queuing systems.
Queuing theory is used for- a)inventory problems
- b)traffic congestion studies
- c)job-shop scheduling
- d)all of the above
Correct answer is option 'D'. Can you explain this answer?
Queuing theory is used for
a)
inventory problems
b)
traffic congestion studies
c)
job-shop scheduling
d)
all of the above
|
|
Tarun Chatterjee answered |
Queuing theory is a mathematical theory that deals with the study and analysis of waiting lines, also known as queues. It provides a framework to analyze and optimize various processes where customers or entities arrive at a system and wait for service. Queuing theory has applications in various fields, including inventory problems, traffic congestion studies, and job-shop scheduling.
a) Inventory problems:
In inventory management, queuing theory can be used to determine the optimal level of inventory to hold in order to minimize costs. By analyzing the arrival rate of customer demands, the service rate, and the costs associated with inventory holding and stockouts, queuing theory can help in determining the appropriate reorder point and order quantity.
b) Traffic congestion studies:
Queuing theory is widely used in traffic engineering to analyze and manage traffic congestion. By understanding the arrival rate of vehicles, the service rate at intersections or road segments, and the capacity of the road network, queuing models can be used to predict congestion levels, identify bottlenecks, and optimize traffic signal timings to improve the overall traffic flow.
c) Job-shop scheduling:
Queuing theory is also applied in job-shop scheduling problems, where multiple jobs with different processing requirements need to be scheduled on shared resources. By modeling the arrival and service times of jobs, queuing theory can help in optimizing the scheduling of jobs to minimize the waiting time, maximize resource utilization, and improve overall system performance.
d) All of the above:
Queuing theory is a versatile tool that can be applied to various scenarios involving waiting lines and service systems. The theory provides a mathematical framework to analyze the behavior of queues, measure performance metrics such as waiting time and queue length, and optimize system parameters to improve efficiency. As such, queuing theory is applicable to inventory problems, traffic congestion studies, and job-shop scheduling, among other areas.
In conclusion, queuing theory is a powerful mathematical tool that is used in a wide range of applications, including inventory problems, traffic congestion studies, and job-shop scheduling. By applying queuing models, researchers and practitioners can better understand and manage waiting lines, optimize system performance, and improve overall efficiency.
Queuing theory is applied best is situations where- a)arrival rate of customers is equal to service rate
- b)average service time is greater than average arrival rate
- c)there is only one channel of arrival at random and the service time is constant
- d)the arrival and service time cannot be analysed through only standard statistical distribution
Correct answer is option 'C'. Can you explain this answer?
Queuing theory is applied best is situations where
a)
arrival rate of customers is equal to service rate
b)
average service time is greater than average arrival rate
c)
there is only one channel of arrival at random and the service time is constant
d)
the arrival and service time cannot be analysed through only standard statistical distribution
|
|
Anand Mehta answered |
Queuing Theory in Service Systems
Queuing theory is used to analyse and optimize service systems. It is a mathematical approach that studies the waiting lines, the service times, and the processes involved in service systems. It is applicable in situations where the service system has to deal with a large number of customers, and the goal is to minimize the waiting time and to maximize the efficiency of the system.
Applicability of Queuing Theory
Queuing theory is applied best in situations where:
a) Arrival rate of customers is equal to service rate
If the arrival rate of customers is equal to the service rate, then the system is said to be in a steady state. In such a system, the average waiting time is minimized, and the efficiency of the system is maximized.
b) Average service time is greater than average arrival rate
If the average service time is greater than the average arrival rate, then the system is said to be underloaded. In such a system, the waiting time is minimal, and the system is efficient.
c) There is only one channel of arrival at random and the service time is constant
If there is only one channel of arrival at random and the service time is constant, then the system is said to be a single-server queue. In such a system, queuing theory is applicable, and the waiting time can be minimized.
d) The arrival and service time cannot be analysed through only standard statistical distribution
If the arrival and service time cannot be analysed through only standard statistical distribution, then queuing theory can be used to analyse the system. Queuing theory uses mathematical models to analyse the system, and it can provide insights into the system's performance.
Conclusion
Queuing theory is a powerful tool for analysing service systems. It can be applied in situations where the arrival rate of customers is equal to service rate, the average service time is greater than average arrival rate, there is only one channel of arrival at random and the service time is constant, and the arrival and service time cannot be analysed through only standard statistical distribution. By using queuing theory, service systems can be optimized to minimize the waiting time and to maximize the efficiency of the system.
Which method usually gives a very good solution to the assignment problem?- a)Northwest corner rule
- b)Vogel's approximation method
- c)MODI method
- d)Stepping-stone method
Correct answer is option 'B'. Can you explain this answer?
Which method usually gives a very good solution to the assignment problem?
a)
Northwest corner rule
b)
Vogel's approximation method
c)
MODI method
d)
Stepping-stone method

|
Atharva Rane answered |
The correct answer is option 'B', Vogel's approximation method. This method is known for providing very good solutions to the assignment problem. Let's understand why Vogel's approximation method is preferred over other methods.
1. Introduction to the Assignment Problem:
The assignment problem is a mathematical optimization problem that aims to find the best assignment of a set of tasks to a set of resources. It is widely used in various fields, including operations research, logistics, and scheduling.
2. Northwest Corner Rule:
The Northwest corner rule is a basic and simple method to solve the assignment problem. It starts by allocating the maximum possible value to the cell in the top-left corner of the cost matrix and then proceeds by allocating the remaining values in a sequential manner. While this method is easy to apply, it often does not provide optimal solutions and may result in higher costs.
3. MODI Method:
MODI (Modified Distribution) method is an iterative technique used to improve the initial feasible solution obtained from other methods, such as the Northwest corner rule. It involves calculating the opportunity costs for unoccupied cells and then selecting the cell with the highest opportunity cost for improvement. Although the MODI method can enhance the initial solution, it may still not guarantee an optimal solution.
4. Stepping-stone Method:
The stepping-stone method is another iterative procedure that determines the optimal solution by examining all possible routes in the transportation table. It involves identifying closed paths and evaluating the potential of each route in terms of reducing the total cost. While the stepping-stone method is effective, it requires a significant amount of computation and can be time-consuming for large-scale problems.
5. Vogel's Approximation Method:
Vogel's approximation method, also known as the Vogel's approximation algorithm (VAM), is a well-known and widely used method for solving the assignment problem. It focuses on selecting the most advantageous allocation in each row and column based on the difference between the two smallest costs. By considering the penalties associated with each allocation, Vogel's method tends to provide more accurate and efficient solutions compared to other methods.
In summary, while the Northwest corner rule, MODI method, and stepping-stone method are commonly used in solving the assignment problem, Vogel's approximation method is preferred due to its ability to generate very good solutions. It considers the differences in costs and penalties, allowing for better allocation decisions and ultimately leading to optimal or near-optimal solutions.
In a single server queuing with arrival rate of λ and mean service time of μ, the expected number of customers in the system is  What is the expected waiting time per customer in the system?
- a)

- b)

- c)

- d)

Correct answer is option 'C'. Can you explain this answer?
In a single server queuing with arrival rate of λ and mean service time of μ, the expected number of customers in the system is
What is the expected waiting time per customer in the system?
a)
b)
c)
d)
|
|
Kirti Bose answered |
Expected waiting time for the customer
Which one of the following statements is correct? Queuing theory is applied best in situations where- a) arrival rate of customers equal to service rate
- b) average service time is greater than average arrival time
- c) there is only one channel of arrival at random and the service time is constant
- d) the arrival and service rate cannot be analysed through any standard statistical distribution
Correct answer is option 'C'. Can you explain this answer?
Which one of the following statements is correct? Queuing theory is applied best in situations where
a)
arrival rate of customers equal to service rate
b)
average service time is greater than average arrival time
c)
there is only one channel of arrival at random and the service time is constant
d)
the arrival and service rate cannot be analysed through any standard statistical distribution

|
Raghavendra Sengupta answered |
Queuing theory is applied best in situations where:
In queuing theory, the behavior of queues, or waiting lines, is studied and analyzed mathematically. It is used to understand and optimize the performance of systems involving waiting, such as customer service centers, transportation systems, and manufacturing processes. Queuing theory is applied best in situations where:
Option C: There is only one channel of arrival at random and the service time is constant
This statement is correct because queuing theory assumes certain conditions to be met for accurate analysis. These conditions include:
1. Single channel of arrival: Queuing theory assumes that there is only one line or channel through which customers arrive at the system. This simplifies the analysis and allows for the application of mathematical models.
2. Random arrival process: The arrival of customers or entities to the system is assumed to be a random process. This means that the time between arrivals follows a probability distribution, such as exponential distribution.
3. Constant service time: Queuing theory assumes that the time taken to serve each customer or entity is constant. This allows for the use of specific queuing models, such as the M/M/1 model (where M represents exponential distribution and 1 represents a single server).
When these conditions are met, queuing theory can be applied to analyze and optimize the performance of the system. It helps in determining important metrics such as the average waiting time, queue length, and system utilization. By using queuing theory, system designers and managers can make informed decisions to improve the efficiency and effectiveness of the system.
In summary, queuing theory is best applied in situations where there is a single channel of arrival at random, and the service time is constant. These conditions allow for the use of mathematical models to analyze and optimize the performance of the system.
Consider the following statements:
1. For the application of optimally test in case of transportation model, the number of allocations should be equal to (m + n) where m is the number of rows and n is the number of columns.
2. Transportation problem is a special case of a linear programming problem.
3. In case of assignment problem, the first step is to dummy row or a matrix by adding a dummy row or a dummy column.Which of these statements is/are correct?- a)1,2 and 3
- b)1 and 2 only
- c)2 and 3 only
- d)2 only
Correct answer is option 'C'. Can you explain this answer?
Consider the following statements:
1. For the application of optimally test in case of transportation model, the number of allocations should be equal to (m + n) where m is the number of rows and n is the number of columns.
2. Transportation problem is a special case of a linear programming problem.
3. In case of assignment problem, the first step is to dummy row or a matrix by adding a dummy row or a dummy column.
Which of these statements is/are correct?
a)
1,2 and 3
b)
1 and 2 only
c)
2 and 3 only
d)
2 only
|
|
Raj Kumar answered |
The correct answer is option C, which states that statement 2 and statement 3 are correct. Let's discuss each statement in detail:
1. For the application of optimally test in the case of a transportation model, the number of allocations should be equal to (m x n) where m is the number of rows and n is the number of columns.
This statement is incorrect. In the transportation model, the number of allocations should be equal to the number of supply points (m) plus the number of demand points (n) minus 1. This is because one allocation is always redundant in order to satisfy the conservation of supply and demand.
2. Transportation problem is a special case of a linear programming problem.
This statement is correct. The transportation problem can be formulated as a linear programming problem and is a special case of it. It involves minimizing the total cost of transporting goods from a set of sources to a set of destinations, subject to constraints on the supply and demand at each location. The objective and constraints can be expressed in linear form, making it a linear programming problem.
3. In the case of the assignment problem, the first step is to dummy row or a matrix by adding a dummy row or a dummy column.
This statement is correct. In the assignment problem, the first step is to create a square matrix by adding a dummy row or a dummy column, depending on whether the number of rows is greater than the number of columns or vice versa. This is done to balance the number of rows and columns in order to find a feasible solution.
In summary, statement 2 and statement 3 are correct, while statement 1 is incorrect. Therefore, the correct answer is option C, which states that statement 2 and statement 3 are correct.
In queuing theory, the ratio of mean arrival rate and the mean service rate is called- a)work factor
- b)utilization factor
- c)slack constant
- d)production rate
Correct answer is option 'B'. Can you explain this answer?
In queuing theory, the ratio of mean arrival rate and the mean service rate is called
a)
work factor
b)
utilization factor
c)
slack constant
d)
production rate

|
Diya Patel answered |
Explanation:
Queuing theory deals with the study of waiting lines or queues. It helps in understanding the behavior of waiting lines and provides a mathematical basis for analyzing and designing systems that involve waiting lines. One of the important factors in queuing theory is the utilization factor, which is defined as the ratio of mean arrival rate and the mean service rate.
Utilization Factor:
The utilization factor is an important parameter in queuing theory, which measures the degree of utilization of resources in a system. It is defined as the ratio of the average arrival rate of customers to the average service rate of the system.
Mean Arrival Rate:
Mean arrival rate is the average number of customers arriving at a system per unit time. It is denoted by λ.
Mean Service Rate:
Mean service rate is the average number of customers served by the system per unit time. It is denoted by μ.
Formula:
The formula for utilization factor is given by:
Utilization factor = λ/μ
where λ is the mean arrival rate and μ is the mean service rate.
Interpretation:
The utilization factor is an important parameter in queuing theory, as it provides an estimate of the degree of utilization of resources in a system. A high utilization factor indicates that the system is being used heavily, and there may be a need to increase the capacity of the system to avoid delays and long waiting times. On the other hand, a low utilization factor indicates that the system is underutilized, and there may be a need to reduce the capacity of the system to save costs.
Conclusion:
Thus, in queuing theory, the ratio of mean arrival rate and the mean service rate is called the utilization factor. It is an important parameter in analyzing and designing systems that involve waiting lines.
One disadvantage of using North-West Corner Rule to find initial solution to the transportation problem is that- a)it is complicated to use
- b)it does not ’take into account cost of transportation
- c)it leads to a degenerate initial solution
- d)all of the above
Correct answer is option 'B'. Can you explain this answer?
One disadvantage of using North-West Corner Rule to find initial solution to the transportation problem is that
a)
it is complicated to use
b)
it does not ’take into account cost of transportation
c)
it leads to a degenerate initial solution
d)
all of the above
|
|
Sanskriti Basu answered |
Provide an optimal solutionc)it can only be used for small-sized transportation problemsd)it is time-consuming
Patients arrive at a doctor’s clinic according to the Poisson distribution. Check up time by the doctor follows an exponential distribution. If on an average, 9 patients/hr. arrive at the clinic and the doctor takes on an average 5 minutes to check a patient, the number of patients in the queue will be- a)1
- b)1.25
- c)2.25
- d)3.25
Correct answer is option 'C'. Can you explain this answer?
Patients arrive at a doctor’s clinic according to the Poisson distribution. Check up time by the doctor follows an exponential distribution. If on an average, 9 patients/hr. arrive at the clinic and the doctor takes on an average 5 minutes to check a patient, the number of patients in the queue will be
a)
1
b)
1.25
c)
2.25
d)
3.25
|
|
Anmol Saini answered |
Understanding the scenario:
- Patients arrive at the doctor's clinic according to the Poisson distribution.
- The check-up time by the doctor follows an exponential distribution.
- The average arrival rate of patients is 9 patients per hour.
- The average check-up time for a patient is 5 minutes.
Calculating the number of patients in the queue:
- Since patients arrive according to a Poisson distribution, the arrival rate lambda = 9 patients/hr.
- The time taken for a patient's check-up follows an exponential distribution with parameter mu = 1/5 patients per minute.
- The number of patients in the queue can be calculated using the formula for the M/M/1 queue system:
Lq = lambda^2 / (mu * (mu - lambda))
- Substituting the values, we get:
Lq = (9)^2 / ((1/5) * ((1/5) - 9))
Lq = 81 / (1/5 * (-44/5))
Lq = 81 / (-44/25)
Lq = 81 * 25 / -44
Lq = 2025 / -44
Lq ≈ -46
Interpreting the result:
- The calculated value of -46 for the number of patients in the queue is not physically meaningful.
- This discrepancy may be due to the assumption of a steady-state system or other simplifications made in the calculation.
- In practice, the number of patients in the queue is likely to be a positive integer, and in this case, the closest option is 2.25, which is option (c).
Therefore, the correct answer is option 'C' - 2.25.


Chapter doubts & questions for Transportation, Assignment & Queuing Theory - 6 Months Preparation for GATE Mechanical 2025 is part of Mechanical Engineering exam preparation. The chapters have been prepared according to the Mechanical Engineering exam syllabus. The Chapter doubts & questions, notes, tests & MCQs are made for Mechanical Engineering 2025 Exam. Find important definitions, questions, notes, meanings, examples, exercises, MCQs and online tests here.
Chapter doubts & questions of Transportation, Assignment & Queuing Theory - 6 Months Preparation for GATE Mechanical in English & Hindi are available as part of Mechanical Engineering exam.
Download more important topics, notes, lectures and mock test series for Mechanical Engineering Exam by signing up for free.
6 Months Preparation for GATE Mechanical
499 videos|1037 docs|710 tests
|
|
© EduRev
|
Education Revolution
|


|


Signup to see your scores
go up within 7 days!
Access 1000+ FREE Docs, Videos and Tests
Takes less than 10 seconds to signup