


All Exams >
Commerce >
Economics Class 11 >
All Questions
All questions of Production and Costs for Commerce Exam
Opportunity cost is the- a)Next best alternative sacrificed
- b)Next best alternative chosen
- c)Next best alternative available
- d)Next best alternative produced
Correct answer is option 'A'. Can you explain this answer?
Opportunity cost is the
a)
Next best alternative sacrificed
b)
Next best alternative chosen
c)
Next best alternative available
d)
Next best alternative produced

|
Knowledge Hub answered |
“Opportunity cost” of a resource, means the value of the next-highest-valued alternative use of that resource.
E.g. you spend time and money going to a movie, you cannot spend that time at home playing video games, and you cannot spend the money on something else. If your next-best alternative to seeing the movie is playing video games at home, then the opportunity cost of seeing the movie is the money spent plus the pleasure you forgo by not playing videos game at home.
E.g. you spend time and money going to a movie, you cannot spend that time at home playing video games, and you cannot spend the money on something else. If your next-best alternative to seeing the movie is playing video games at home, then the opportunity cost of seeing the movie is the money spent plus the pleasure you forgo by not playing videos game at home.

In the long run TPP changes with the change in which of the following factors- a)Fixed factors
- b)Variable factors
- c)Economic cost
- d)All the factors
Correct answer is option 'D'. Can you explain this answer?
In the long run TPP changes with the change in which of the following factors
a)
Fixed factors
b)
Variable factors
c)
Economic cost
d)
All the factors
|
|
Ishan Choudhury answered |
In the long run TPP changes with the change in all the factors is the right option because total product can be change in long run production function. After change every situation because in long run production more time should be taken by performer.
Marginal Revenue is- a)Same as total revenue
- b)Addition to the total revenue on the production of an additional unit of Output
- c)Addition to the total revenue on the sale of an additional unit of Output
- d)Additional cost involved in production
Correct answer is option 'C'. Can you explain this answer?
Marginal Revenue is
a)
Same as total revenue
b)
Addition to the total revenue on the production of an additional unit of Output
c)
Addition to the total revenue on the sale of an additional unit of Output
d)
Additional cost involved in production

|
Simran Mishra answered |
**Marginal Revenue: Addition to the total revenue on the sale of an additional unit of Output**
Marginal revenue is a concept used in economics to describe the additional revenue generated from the sale of one additional unit of output or product. It is the change in total revenue that occurs as a result of producing and selling one more unit of a product.
**Explanation:**
Marginal revenue is calculated by dividing the change in total revenue by the change in the quantity of output sold. It represents the increase in revenue that a firm earns when it sells one more unit of output.
To understand this concept, let's consider an example of a company that sells smartphones. Suppose the company sells its smartphones for $500 each, and it sells 1000 units in a month, resulting in a total revenue of $500,000. Now, if the company decides to produce and sell one more smartphone, it would have to adjust its price to attract buyers. Let's assume the company reduces the price to $400 for the additional unit.
In this case, the marginal revenue for the additional unit would be $400 because that is the amount of revenue generated from the sale of that unit. The total revenue after selling 1001 units would be $500,000 + $400 = $500,400. Therefore, the marginal revenue for the additional unit is $400.
It is important to note that marginal revenue can vary depending on the market conditions, demand for the product, and the pricing strategies employed by the firm. In some cases, marginal revenue may be positive, indicating an increase in revenue from selling an additional unit. However, in certain situations, such as when the market is highly competitive, marginal revenue may be negative, indicating a decrease in revenue from selling an additional unit.
Overall, marginal revenue is a crucial concept for businesses as it helps them determine the optimal level of production and pricing strategies to maximize their profits. By understanding the change in revenue associated with each additional unit of output, firms can make informed decisions regarding their production and pricing policies.
Explicit costs are paid to- a)External owners of factors
- b)The tax authorities
- c)Internal owners of factors
- d)The government
Correct answer is option 'A'. Can you explain this answer?
Explicit costs are paid to
a)
External owners of factors
b)
The tax authorities
c)
Internal owners of factors
d)
The government
|
|
Poonam Reddy answered |
Total cost is what the firm pays for producing and selling its products. Explicit costs are normal business expenses that are easy to track and appear in the general ledger. Explicit costs are the only costs necessary to calculate a profit, as they clearly affect a company's profits. Wages that a firm pays its employees or rent that a firm pays for its office are explicit costs.
Explain the relationship TC, TFC & TVC.- a)TVC+TFC= TC
- b)TVC X TFC= TC
- c)TVC-TFC= TC
- d)TVC/TFC=TC
Correct answer is option 'A'. Can you explain this answer?
Explain the relationship TC, TFC & TVC.
a)
TVC+TFC= TC
b)
TVC X TFC= TC
c)
TVC-TFC= TC
d)
TVC/TFC=TC
|
|
Vikas Kapoor answered |
Relationship between TFC, TVC, and TC. Total fixed cost (TFC) is represented by a straight line parallel to X-axis and it remains unchanged for all output levels in a time period. ... TC is the sum of TFC and TVC. When no variable output is added, TC is equal to TFC.
The general shape of TPP in the short run is- a)V- shaped
- b)Hyperbola
- c)U shaped
- d)Inverse U shaped
Correct answer is option 'D'. Can you explain this answer?
The general shape of TPP in the short run is
a)
V- shaped
b)
Hyperbola
c)
U shaped
d)
Inverse U shaped
|
|
Naina Sharma answered |
Both the Short-run average total cost curve (SRAC) and Long-run average cost curve (LRAC) curves are typically expressed as U-shaped.
The fixed cost curve is a horizontal straight line to the X axis because- a)It is impossible to change
- b)IT remains same even if fixed factors change
- c)It remains constant in the long run
- d)It remains constant in the short run
Correct answer is option 'D'. Can you explain this answer?
The fixed cost curve is a horizontal straight line to the X axis because
a)
It is impossible to change
b)
IT remains same even if fixed factors change
c)
It remains constant in the long run
d)
It remains constant in the short run
|
|
Rajat Patel answered |
We know, in the short run, there are some factors which are fixed, while others are variable. Similarly, short run costs are also divided into two kinds of costs:(i) Fixed Cost
The sum total of fixed cost and variable cost is equal to total cost. Let us discuss the short run costs in detail.Units of output are measured along the X-axis and fixed costs along the Y-axis. ... The curve makes an intercept on the Y-axis, which is equal to the fixed cost of Rs. 12. TFC curve is a horizontal straight line parallel to the X-axis because TFC remains same at all levels of output,It remains constant in the short run
Cost of production is- a)Price of the output
- b)Expenditure on inputs to produce output
- c)Price of per unit of input
- d)Price of per unit of output
Correct answer is option 'B'. Can you explain this answer?
Cost of production is
a)
Price of the output
b)
Expenditure on inputs to produce output
c)
Price of per unit of input
d)
Price of per unit of output
|
|
Aryan Khanna answered |
Cost of production is the total price paid for resources used to manufacture a product or create a service to sell to consumers including raw materials, labor, and overhead.
Implicit costs are- a)Total cost
- b)Same as explicit costs
- c)Opportunity costs
- d)Imputed costs
Correct answer is option 'D'. Can you explain this answer?
Implicit costs are
a)
Total cost
b)
Same as explicit costs
c)
Opportunity costs
d)
Imputed costs

|
Yuvraj Bhardwaj answered |
Implicit costs are the cost of self supplied
This a MCQ (Multiple Choice Question) based practice test of Chapter 3 - Production and Costs of Economics of Class XII (12) for the quick revision/preparation of School Board examinationsQ Production function shows- a)Technological relationship between inputs and output
- b)Economic relationship between inputs and output
- c)Technological relationship between inputs and cost
- d)Technological relationship between inputs and price
Correct answer is option 'A'. Can you explain this answer?
This a MCQ (Multiple Choice Question) based practice test of Chapter 3 - Production and Costs of Economics of Class XII (12) for the quick revision/preparation of School Board examinations
Q Production function shows
a)
Technological relationship between inputs and output
b)
Economic relationship between inputs and output
c)
Technological relationship between inputs and cost
d)
Technological relationship between inputs and price
|
|
Rajat Patel answered |
Production function is an expression of the technological relation between physical inputs and output of a good.
Symbolically: Ox = f i1, i2, i3…. in)
{Where: Ox = Output of commodity x; f = Functional relationship; i1, i2, …. in = Inputs needed for Ox}
Example of Production function:
Suppose a firm is manufacturing chairs with the help of two inputs, say labour (L) and capital (K). Then, production function can be written as: OChairs = f (L, K)
Production function defines the maximum chairs (OChairs ), which can be produced with the given capital and labour inputs. If production functions is expressed as: 250 = (7L, 2K). It means, 7 units of labour and 2 units of capital can produce maximum of 250 chairs.
In short run which of the following factors can be changed easily- a)Variable factors
- b)Fixed factors
- c)All the factors
- d)None
Correct answer is option 'A'. Can you explain this answer?
In short run which of the following factors can be changed easily
a)
Variable factors
b)
Fixed factors
c)
All the factors
d)
None
|
|
Ishan Choudhury answered |
In short run ..time period for production is very short ..so for increasing production only variable factor can increase instead of fixed factor. for example... a company make 40units of good x by using 3 units of labour and 5 units of capital ...if They wants to increase production from 40 to 45 so they will use 4units of labour and 5units of capital.
In the short run TPP changes with the change in which of the following factors- a)Economic cost
- b)Fixed factors
- c)Variable factors
- d)All the factors
Correct answer is option 'C'. Can you explain this answer?
In the short run TPP changes with the change in which of the following factors
a)
Economic cost
b)
Fixed factors
c)
Variable factors
d)
All the factors
|
|
Ishan Choudhury answered |
When we employee more units of variable factor(labour) on fixed factor(land) then at the end of the point total production (tp) decrease because of more labour.
The law of supply explains a- a)Positive relationship between Price of a commodity and quantity supplied
- b)Negative relationship between Price of a commodity and quantity supplied
- c)Positive relationship between Price of a commodity and market supply
- d)Positive relationship between Price of a commodity and supply
Correct answer is option 'A'. Can you explain this answer?
The law of supply explains a
a)
Positive relationship between Price of a commodity and quantity supplied
b)
Negative relationship between Price of a commodity and quantity supplied
c)
Positive relationship between Price of a commodity and market supply
d)
Positive relationship between Price of a commodity and supply

|
Naseehulhaque Kk answered |
Law of supply states that the relationship between the price of the product and the
Direction: In the following questions, a statement of Assertion (A) is followed by a statement of Reason (R). Mark the correct choice as:Assertion (A): When 5 units of a good are sold at ₹ 20, total revenue is ₹ 100.Reason (R): Total revenue is the revenue earned by the firm from the total amount of product sold by it.- a)Both Assertion (A) and Reason (R) are true, and Reason (R) is the correct explanation of the Assertion (A).
- b)Both Assertion (A) and Reason (R) are true, but Reason (R) is not the correct explanation of the Assertion (A).
- c)Assertion (A) is true, but Reason (R) is false.
- d)Assertion (A) is false, but Reason (R) is true.
Correct answer is option 'A'. Can you explain this answer?
Direction: In the following questions, a statement of Assertion (A) is followed by a statement of Reason (R). Mark the correct choice as:
Assertion (A): When 5 units of a good are sold at ₹ 20, total revenue is ₹ 100.
Reason (R): Total revenue is the revenue earned by the firm from the total amount of product sold by it.
a)
Both Assertion (A) and Reason (R) are true, and Reason (R) is the correct explanation of the Assertion (A).
b)
Both Assertion (A) and Reason (R) are true, but Reason (R) is not the correct explanation of the Assertion (A).
c)
Assertion (A) is true, but Reason (R) is false.
d)
Assertion (A) is false, but Reason (R) is true.

|
Manisha Patel answered |
Assertion: When 5 units of a good are sold at ₹ 20, total revenue is ₹ 100.
Reason: Total revenue is the revenue earned by the firm from the total amount of product sold by it.
Explanation:
Definition of Revenue:
Revenue refers to the total income generated by a firm from the sale of its goods or services. It is calculated by multiplying the price per unit by the quantity of units sold.
Explanation of Assertion:
The assertion states that when 5 units of a good are sold at ₹ 20, the total revenue is ₹ 100. This can be calculated by multiplying the price per unit (₹ 20) by the quantity of units sold (5).
Total Revenue Calculation:
Price per unit = ₹ 20
Quantity of units sold = 5
Total revenue = Price per unit * Quantity of units sold
= ₹ 20 * 5
= ₹ 100
Explanation of Reason:
The reason provided states that total revenue is the revenue earned by the firm from the total amount of product sold by it. This is a correct explanation because total revenue is calculated by multiplying the price per unit by the quantity of units sold. It represents the total income generated by the firm from the sale of its goods or services.
Conclusion:
Both the assertion and reason are true, and the reason correctly explains the assertion. When 5 units of a good are sold at ₹ 20, the total revenue is ₹ 100, and total revenue is indeed the revenue earned by the firm from the total amount of product sold by it. Therefore, option (a) is the correct answer.
The supply curve of a firm shows- a)Graphical representation of quantity supplied at various prices
- b)Graphical representation of quantity supplied at keeping prices constant
- c)Graphical representation of quantity supplied at a particular price only
- d)Graphical representation of quantity supplied at various profit levels
Correct answer is option 'A'. Can you explain this answer?
The supply curve of a firm shows
a)
Graphical representation of quantity supplied at various prices
b)
Graphical representation of quantity supplied at keeping prices constant
c)
Graphical representation of quantity supplied at a particular price only
d)
Graphical representation of quantity supplied at various profit levels
|
|
Rohini Desai answered |
The Supply Curve of a Firm
The supply curve of a firm is a graphical representation of the quantity of goods or services that a firm is willing and able to supply at various prices. It depicts the relationship between the price of a product and the quantity of that product that a firm is willing to produce and sell in a given time period.
Key Points:
- The supply curve slopes upward from left to right, indicating a positive relationship between price and quantity supplied.
- The quantity supplied is shown on the horizontal axis, while the price is shown on the vertical axis.
- The supply curve is usually depicted as a straight line or an upward-sloping curve.
- The shape of the supply curve can vary depending on factors such as production costs, technology, and government regulations.
- The supply curve shows the firm's response to changes in price, assuming that all other factors remain constant.
- When the price of a product increases, the firm has an incentive to increase its production and supply more of the product.
- Conversely, when the price decreases, the firm may reduce its production and supply less of the product.
Overall, the supply curve of a firm provides valuable information about the quantity of goods or services that a firm is willing and able to supply at different price levels. It helps in understanding the behavior of firms in response to changes in market conditions and assists in analyzing market equilibrium and the determination of prices.
Market supply is best defined as- a)Vertical summation of all individual quantity supplied at a given price
- b)Horizontal summation of all individual quantity supplied at a given price
- c)Horizontal summation of all individual quantity supplied at various prices
- d)Vertical summation of all individual quantity supplied at various prices
Correct answer is option 'C'. Can you explain this answer?
Market supply is best defined as
a)
Vertical summation of all individual quantity supplied at a given price
b)
Horizontal summation of all individual quantity supplied at a given price
c)
Horizontal summation of all individual quantity supplied at various prices
d)
Vertical summation of all individual quantity supplied at various prices
|
|
Rajat Patel answered |
A change in the price of resources inputs used to produce the good. Supply is best
Direction: Read the following passage and answer the question that follows:The slope of a total revenue curve is particularly important. It equals the change in the vertical axis (total revenue) divided by the change in the horizontal axis (quantity) between any two points. The slope measures the rate at which total revenue increases as output increases. We can think of it as the increase in total revenue associated with a 1-unit increase in output. The increase in total revenue from a 1-unit increase in quantity is marginal revenue. Thus marginal revenue (MR) equals the slope of the total revenue curve.How much additional revenue does a radish producer gain from selling one more pound of radishes? The answer, of course, is the market price for 1 pound. Marginal revenue equals the market price. Because the market price is not affected by the output choice of a single firm, the marginal revenue the firm gains by producing one more unit is always the market price. The marginal revenue curve shows the relationship between marginal revenue and the quantity a firm produces. For a perfectly competitive firm, the marginal revenue curve is a horizontal line at the market price. If the market price of a pound of radishes is $0.40, then the marginal revenue is $0.40. Marginal revenue curves for prices of $0.20, $0.40, and $0.60. In perfect competition, a firm’s marginal revenue curve is a horizontal line at the market price.Price also equals average revenue, which is total revenue divided by quantity. To obtain average revenue (AR), we divide total revenue by quantity, Q. Because total revenue equals price (P) times quantity (Q), dividing by quantity leaves us with price.Q. The slope of the Total Revenue equals ……..- a)Average Revenue
- b)Marginal Revenue
- c)Average Cost
- d)Marginal Cost
Correct answer is option 'B'. Can you explain this answer?
Direction: Read the following passage and answer the question that follows:
The slope of a total revenue curve is particularly important. It equals the change in the vertical axis (total revenue) divided by the change in the horizontal axis (quantity) between any two points. The slope measures the rate at which total revenue increases as output increases. We can think of it as the increase in total revenue associated with a 1-unit increase in output. The increase in total revenue from a 1-unit increase in quantity is marginal revenue. Thus marginal revenue (MR) equals the slope of the total revenue curve.
How much additional revenue does a radish producer gain from selling one more pound of radishes? The answer, of course, is the market price for 1 pound. Marginal revenue equals the market price. Because the market price is not affected by the output choice of a single firm, the marginal revenue the firm gains by producing one more unit is always the market price. The marginal revenue curve shows the relationship between marginal revenue and the quantity a firm produces. For a perfectly competitive firm, the marginal revenue curve is a horizontal line at the market price. If the market price of a pound of radishes is $0.40, then the marginal revenue is $0.40. Marginal revenue curves for prices of $0.20, $0.40, and $0.60. In perfect competition, a firm’s marginal revenue curve is a horizontal line at the market price.
Price also equals average revenue, which is total revenue divided by quantity. To obtain average revenue (AR), we divide total revenue by quantity, Q. Because total revenue equals price (P) times quantity (Q), dividing by quantity leaves us with price.
Q. The slope of the Total Revenue equals ……..
a)
Average Revenue
b)
Marginal Revenue
c)
Average Cost
d)
Marginal Cost
|
|
Vikas Kapoor answered |
At the point of maximum total revenue m the slope of the total revenue curve is zero and the marginal revenue is therefore also zero. The marginal revenue curve thus crosses the horizontal axis at the quantity at which the total revenue is maximum.
Direction: Read the following passage and answer the question that follows:Agriculture provides livelihood to almost three fourth of population of India. Indian agriculture is highly dependent on spatial and temporal distribution of rainfall. Climate extremes such as drought and flood affect agriculture severely. An account of impact of climate extremes viz. drought and flood, on Indian food-grain production has been presented in this paper. There are temporal fluctuations in food grain production and area under the food-grain. In secular terms, both of them increased up to mid-eighties.After mid-eighties there is decline in the area of food grain while maintaining an increase in production of food-grain suggesting the improvement in agricultural technology and policy. There is more temporal fluctuation in the production of food grain than the area under food grain. The analysis reveals that impact of drought on Indian agriculture is more than that of flood. Rabi food grain production depicts better adaptability to drought than Kharif food grain production mostly due to better access to irrigation infrastructure. Among the various food crops analysed all except jowar can effectively face flood events. Wheat and jowar perform relatively better during drought events.Rice is most sensitive crop to the extreme climate events. Since rice is staple food in the sub-continent, management of rice productions against climate extremes needs special attention for food security and sustainability.Q. What other things affect the supply of goods?- a)Price of the commodity
- b)Income of the consumers
- c)Substitute goods price change
- d)All of the above
Correct answer is option 'D'. Can you explain this answer?
Direction: Read the following passage and answer the question that follows:
Agriculture provides livelihood to almost three fourth of population of India. Indian agriculture is highly dependent on spatial and temporal distribution of rainfall. Climate extremes such as drought and flood affect agriculture severely. An account of impact of climate extremes viz. drought and flood, on Indian food-grain production has been presented in this paper. There are temporal fluctuations in food grain production and area under the food-grain. In secular terms, both of them increased up to mid-eighties.
After mid-eighties there is decline in the area of food grain while maintaining an increase in production of food-grain suggesting the improvement in agricultural technology and policy. There is more temporal fluctuation in the production of food grain than the area under food grain. The analysis reveals that impact of drought on Indian agriculture is more than that of flood. Rabi food grain production depicts better adaptability to drought than Kharif food grain production mostly due to better access to irrigation infrastructure. Among the various food crops analysed all except jowar can effectively face flood events. Wheat and jowar perform relatively better during drought events.
Rice is most sensitive crop to the extreme climate events. Since rice is staple food in the sub-continent, management of rice productions against climate extremes needs special attention for food security and sustainability.
Q. What other things affect the supply of goods?
a)
Price of the commodity
b)
Income of the consumers
c)
Substitute goods price change
d)
All of the above
|
|
Arun Yadav answered |
Factors affecting Supply: Supply refers to the quantity of a good that the producer plans to sell in the market. Supply will be determined by factors such as price, the number of suppliers, the state of technology, government subsidies, weather conditions and the availability of workers to produce the good.
Direction: Read the following passage and answer the question that follows:A producer (firm) is said to be in equilibrium when the firm is producing that quantity of output which gives the firm maximum profit.For a firm, to be in equilibrium, two conditions must be fulfilled. First, and the necessary condition is that firm’s marginal cost equals marginal revenue.Second, along with the first condition is that MC must be greater than MR beyond the level of output at which MC = MR. Therefore, fulfilment of the first condition alone does not ensure maximum profits. It is possible that MC = MR condition may be fulfilled at more than one output level but only that output level beyond which MC > MR is the maximum profits output level.Q. What is the first and necessary condition for equilibrium?- a)MC is more than MR.
- b)MC is less than MR.
- c)MC is equal to MR.
- d)MC is above MR.
Correct answer is option 'C'. Can you explain this answer?
Direction: Read the following passage and answer the question that follows:
A producer (firm) is said to be in equilibrium when the firm is producing that quantity of output which gives the firm maximum profit.
For a firm, to be in equilibrium, two conditions must be fulfilled. First, and the necessary condition is that firm’s marginal cost equals marginal revenue.
Second, along with the first condition is that MC must be greater than MR beyond the level of output at which MC = MR. Therefore, fulfilment of the first condition alone does not ensure maximum profits. It is possible that MC = MR condition may be fulfilled at more than one output level but only that output level beyond which MC > MR is the maximum profits output level.
Q. What is the first and necessary condition for equilibrium?
a)
MC is more than MR.
b)
MC is less than MR.
c)
MC is equal to MR.
d)
MC is above MR.
|
|
Amita Das answered |
The first condition necessary to achieve equilibrium is the one already mentioned: the net external force on the system must be zero. Expressed as an equation, this is simply. net F = 0. Note that if net F is zero, then the net external force in any direction is zero.
Money costs mean- a)Money expenditure on purchase of goods from the factory
- b)Money spent by the consumers
- c)Money expenditure of a producer in the production process
- d)Money expenditure on output
Correct answer is option 'C'. Can you explain this answer?
Money costs mean
a)
Money expenditure on purchase of goods from the factory
b)
Money spent by the consumers
c)
Money expenditure of a producer in the production process
d)
Money expenditure on output

|
Madhurima Dasgupta answered |
Money costs refer to the expenses incurred by a producer in the production process. These costs are essential for the smooth functioning of a business and are essential for the calculation of profits.
Heading: Types of Money Costs
- Fixed Costs: These are costs that do not vary with the level of production. For example, rent, salaries of permanent staff, insurance premiums, etc.
- Variable Costs: These are costs that vary with the level of production. For example, raw materials, electricity bills, wages of temporary staff, etc.
- Semi-Variable Costs: These are costs that are partly fixed and partly variable. For example, telephone bills, transportation costs, etc.
Heading: Importance of Money Costs
- Calculation of Profits: Money costs are subtracted from total revenue to calculate profits. Therefore, it is important to accurately calculate these costs.
- Pricing Decisions: Money costs play a crucial role in determining the selling price of goods or services. If the costs are too high, the selling price will have to be increased.
- Budgeting: Money costs help in creating a budget for the business. This helps in identifying areas where costs can be reduced and profits can be maximized.
Heading: Examples of Money Costs
- Raw Materials: This includes the cost of the materials used in the production process.
- Labor Costs: This includes the salaries and wages paid to the employees.
- Overhead Costs: This includes expenses such as rent, utilities, insurance, etc.
- Marketing Costs: This includes expenses incurred in advertising and promoting the product or service.
- Depreciation: This includes the reduction in value of assets over time.
In conclusion, money costs are essential for the smooth functioning of a business. They help in calculating profits, making pricing decisions, and creating budgets. These costs include raw materials, labor costs, overhead costs, marketing costs, and depreciation.
Cost function shows- a)Technological relationship between cost and price
- b)Inverse relationship between inputs and cost
- c)Technological relationship between cost and output
- d)Economic relationship between inputs and cost
Correct answer is option 'C'. Can you explain this answer?
Cost function shows
a)
Technological relationship between cost and price
b)
Inverse relationship between inputs and cost
c)
Technological relationship between cost and output
d)
Economic relationship between inputs and cost
|
|
Alok Mehta answered |
A firm has to pay for the inputs it needs. Therefore, inputs, on the one hand, generate costs and, on the other hand, generate output. We first study the relationship between inputs and the output; that is "production function". Then we look at the relationship between the output and costs; that is cost function.
Direction: In the following questions, a statement of Assertion (A) is followed by a statement of Reason (R). Mark the correct choice as:Assertion (A): Elasticity of supply of gold is unitary elastic.Reason (R): The unitary elastic supply is equal to 1.- a)Both Assertion (A) and Reason (R) are true, and Reason (R) is the correct explanation of the Assertion (A).
- b)Both Assertion (A) and Reason (R) are true, but Reason (R) is not the correct explanation of the Assertion (A).
- c)Assertion (A) is true, but Reason (R) is false.
- d)Assertion (A) is false, but Reason (R) is true.
Correct answer is option 'C'. Can you explain this answer?
Direction: In the following questions, a statement of Assertion (A) is followed by a statement of Reason (R). Mark the correct choice as:
Assertion (A): Elasticity of supply of gold is unitary elastic.
Reason (R): The unitary elastic supply is equal to 1.
a)
Both Assertion (A) and Reason (R) are true, and Reason (R) is the correct explanation of the Assertion (A).
b)
Both Assertion (A) and Reason (R) are true, but Reason (R) is not the correct explanation of the Assertion (A).
c)
Assertion (A) is true, but Reason (R) is false.
d)
Assertion (A) is false, but Reason (R) is true.
|
|
Amita Das answered |
Unit Elastic Supply has a PES of 1, where quantity supplied change by the same percentage as the price change.
Direction: In the following questions, a statement of Assertion (A) is followed by a statement of Reason (R). Mark the correct choice as:Assertion (A): The percentage change in quantity supplied is 20% and the percentage change in price is 20%. Thus the elasticity of supply is 1.Reason (R): The commodity supplied has unitary elastic supply and its supply curve will be upward rising.- a)Both Assertion (A) and Reason (R) are true, and Reason (R) is the correct explanation of the Assertion (A).
- b)Both Assertion (A) and Reason (R) are true, but Reason (R) is not the correct explanation of the Assertion (A).
- c)Assertion (A) is true, but Reason (R) is false.
- d)Assertion (A) is false, but Reason (R) is true.
Correct answer is option 'B'. Can you explain this answer?
Direction: In the following questions, a statement of Assertion (A) is followed by a statement of Reason (R). Mark the correct choice as:
Assertion (A): The percentage change in quantity supplied is 20% and the percentage change in price is 20%. Thus the elasticity of supply is 1.
Reason (R): The commodity supplied has unitary elastic supply and its supply curve will be upward rising.
a)
Both Assertion (A) and Reason (R) are true, and Reason (R) is the correct explanation of the Assertion (A).
b)
Both Assertion (A) and Reason (R) are true, but Reason (R) is not the correct explanation of the Assertion (A).
c)
Assertion (A) is true, but Reason (R) is false.
d)
Assertion (A) is false, but Reason (R) is true.
|
|
Kiran Mehta answered |
The upward shift represents the fact that supply often decreases when the costs of production increase, so producers need to get a higher price than before in order to supply a given quantity of output.
Direction: In the following questions, a statement of Assertion (A) is followed by a statement of Reason (R). Mark the correct choice as:Assertion (A): A firm is able to sell more quantity of a good only by lowering the price.Reason (R): The firm’s Marginal Revenue, as he goes on selling, would be less than Average revenue.- a)Both Assertion (A) and Reason (R) are true, and Reason (R) is the correct explanation of the Assertion (A).
- b)Both Assertion (A) and Reason (R) are true, but Reason (R) is not the correct explanation of the Assertion (A).
- c)Assertion (A) is true, but Reason (R) is false.
- d)Assertion (A) is false, but Reason (R) is true.
Correct answer is option 'B'. Can you explain this answer?
Direction: In the following questions, a statement of Assertion (A) is followed by a statement of Reason (R). Mark the correct choice as:
Assertion (A): A firm is able to sell more quantity of a good only by lowering the price.
Reason (R): The firm’s Marginal Revenue, as he goes on selling, would be less than Average revenue.
a)
Both Assertion (A) and Reason (R) are true, and Reason (R) is the correct explanation of the Assertion (A).
b)
Both Assertion (A) and Reason (R) are true, but Reason (R) is not the correct explanation of the Assertion (A).
c)
Assertion (A) is true, but Reason (R) is false.
d)
Assertion (A) is false, but Reason (R) is true.
|
|
Arun Yadav answered |
The firm's marginal revenue will be equal to average revenue as marginal revenue is net addition to the revenue when an additional unit is produced.
In the context of isoquants, what does a negative slope indicate?- a)An increase in both labor and capital leads to a decrease in output
- b)A decrease in one input leads to a higher output level
- c)An increase in one input allows for a reduction in the other input while maintaining the same output
- d)Marginal products of both inputs are zero
Correct answer is option 'C'. Can you explain this answer?
In the context of isoquants, what does a negative slope indicate?
a)
An increase in both labor and capital leads to a decrease in output
b)
A decrease in one input leads to a higher output level
c)
An increase in one input allows for a reduction in the other input while maintaining the same output
d)
Marginal products of both inputs are zero

|
Sai Kulkarni answered |
In the context of isoquants, a negative slope indicates:
- An increase in one input allows for a reduction in the other input while maintaining the same output.
- This reflects the principle of substitutability between inputs.
- As one input increases, the other can decrease, keeping the output constant.
- This relationship is crucial for understanding how to optimise resource allocation in production.
A supply schedule is best defined as- a)Graphical representation of quantity supplied at a particular price only
- b)Tabular representation of quantity supplied at various prices
- c)Tabular representation of quantity supplied at keeping prices constant
- d)Tabular representation of quantity supplied at various profit levels
Correct answer is option 'B'. Can you explain this answer?
A supply schedule is best defined as
a)
Graphical representation of quantity supplied at a particular price only
b)
Tabular representation of quantity supplied at various prices
c)
Tabular representation of quantity supplied at keeping prices constant
d)
Tabular representation of quantity supplied at various profit levels
|
|
Maya Bose answered |
Supply Schedule Definition:
A supply schedule is a tabular representation of the quantity supplied at various prices. It shows the relationship between the price of a product and the quantity that producers are willing and able to supply at each price level. This schedule helps to understand the behavior of suppliers in response to changes in price.
Tabular Representation:
A supply schedule presents the data in a table format, with two columns: one for the price of the product and another for the corresponding quantity supplied. Each row represents a different price level, and the quantity supplied at that price is recorded.
Various Prices:
The supply schedule includes various prices to capture the relationship between price and quantity supplied. It shows how the quantity supplied changes as the price of the product changes. By analyzing the supply schedule, we can observe the pattern of supply and identify the factors that influence producers' decisions.
Constant Prices:
The supply schedule does not keep prices constant. Instead, it presents different prices at which the product can be sold. By examining the quantity supplied at each price level, we can determine how suppliers respond to changes in price, which helps in understanding market dynamics.
Graphical Representation:
While the supply schedule is typically presented in a tabular form, it can also be used to create a graphical representation known as the supply curve. The supply curve is derived from the supply schedule and plots the quantity supplied on the x-axis and the price on the y-axis. This graphical representation provides a visual understanding of the relationship between price and quantity supplied.
Importance:
The supply schedule is crucial in determining the equilibrium price and quantity in a market. It helps economists and market participants analyze the supply side of the market and make predictions about the behavior of suppliers. By studying the supply schedule, one can understand the responsiveness of suppliers to changes in price, the elasticity of supply, and the factors that influence producers' decisions to supply goods and services.
In conclusion, a supply schedule is a tabular representation of the quantity supplied at various prices. It provides valuable insights into the behavior of suppliers and helps in analyzing the supply side of the market. By examining the relationship between price and quantity supplied, one can understand the dynamics of supply and make predictions about market outcomes.
Direction: In the following questions, a statement of Assertion (A) is followed by a statement of Reason (R). Mark the correct choice as:Assertion (A): Average Cost will rise only when Marginal Cost rises.Reason (R): Rise in AC takes place when MC is greater than AC and not necessarily when MC rises.- a)Both Assertion (A) and Reason (R) are true, and Reason (R) is the correct explanation of the Assertion (A).
- b)Both Assertion (A) and Reason (R) are true, but Reason (R) is not the correct explanation of the Assertion (A).
- c)Assertion (A) is true, but Reason (R) is false.
- d)Assertion (A) is false, but Reason (R) is true.
Correct answer is option 'D'. Can you explain this answer?
Direction: In the following questions, a statement of Assertion (A) is followed by a statement of Reason (R). Mark the correct choice as:
Assertion (A): Average Cost will rise only when Marginal Cost rises.
Reason (R): Rise in AC takes place when MC is greater than AC and not necessarily when MC rises.
a)
Both Assertion (A) and Reason (R) are true, and Reason (R) is the correct explanation of the Assertion (A).
b)
Both Assertion (A) and Reason (R) are true, but Reason (R) is not the correct explanation of the Assertion (A).
c)
Assertion (A) is true, but Reason (R) is false.
d)
Assertion (A) is false, but Reason (R) is true.
|
|
Amita Das answered |
Average cost rises only when Marginal Cost is greater than Average Cost. Average cost falls as long as marginal cost is below average cost (irrespective of the fact that marginal cost is rising or falling).
Direction: In the following questions, a statement of Assertion (A) is followed by a statement of Reason (R). Mark the correct choice as:Assertion (A): The difference between AC and AVC is due to AFC.Reason (R): As output increases AFC decreases, so the difference between AC and AVC decreases.- a)Both Assertion (A) and Reason (R) are true, and Reason (R) is the correct explanation of the Assertion (A).
- b)Both Assertion (A) and Reason (R) are true, but Reason (R) is not the correct explanation of the Assertion (A).
- c)Assertion (A) is true, but Reason (R) is false.
- d)Assertion (A) is false, but Reason (R) is true.
Correct answer is option 'C'. Can you explain this answer?
Direction: In the following questions, a statement of Assertion (A) is followed by a statement of Reason (R). Mark the correct choice as:
Assertion (A): The difference between AC and AVC is due to AFC.
Reason (R): As output increases AFC decreases, so the difference between AC and AVC decreases.
a)
Both Assertion (A) and Reason (R) are true, and Reason (R) is the correct explanation of the Assertion (A).
b)
Both Assertion (A) and Reason (R) are true, but Reason (R) is not the correct explanation of the Assertion (A).
c)
Assertion (A) is true, but Reason (R) is false.
d)
Assertion (A) is false, but Reason (R) is true.
|
|
Vikas Kapoor answered |
AVC is obtained by dividing the total variable cost by output, i.e., AVC = TVC/Q. Thus, AVC is a part of AC, given AC = AFC + AVC. This is because AC not only includes AVC but also AFC which falls continuously as output rises. Not only this, initially, with the increase in output, AVC falls.
Direction: In the following questions, a statement of Assertion (A) is followed by a statement of Reason (R). Mark the correct choice as:Assertion (A): Average product increases only when marginal product increases.Reason (R): AP increases so long as MP is greater than AP, whether MP is rising or falling.- a)Both Assertion (A) and Reason (R) are true, and Reason (R) is the correct explanation of the Assertion (A).
- b)Both Assertion (A) and Reason (R) are true, but Reason (R) is not the correct explanation of the Assertion (A).
- c)Assertion (A) is true, but Reason (R) is false.
- d)Assertion (A) is false, but Reason (R) is true.
Correct answer is option 'D'. Can you explain this answer?
Direction: In the following questions, a statement of Assertion (A) is followed by a statement of Reason (R). Mark the correct choice as:
Assertion (A): Average product increases only when marginal product increases.
Reason (R): AP increases so long as MP is greater than AP, whether MP is rising or falling.
a)
Both Assertion (A) and Reason (R) are true, and Reason (R) is the correct explanation of the Assertion (A).
b)
Both Assertion (A) and Reason (R) are true, but Reason (R) is not the correct explanation of the Assertion (A).
c)
Assertion (A) is true, but Reason (R) is false.
d)
Assertion (A) is false, but Reason (R) is true.
|
|
Arun Yadav answered |
Average product will increase only when marginal product increases. Average product rises only where marginal product rises. Answer: False: Average product may increase even if marginal product does not increase. Marginal product rises and falls at a faster rate than the average product.
Direction: Read the following passage and answer the question that follows:Jordan Cement Factories Company was set up in December 1951 as a share holding company. In March 1954, the company commenced business with the first bag of cement.In order to ascertain the cost of products for a particular period of time, the company prepares cost sheet, the cost sheet data are collected from various statements of accounts which have been written in cost accounts either on day to day or regular records. The main elements of cost sheet are prime cost,work cost and cost of production.The main principle that underlines the cost classifications of main elements of the cost is fixed and variable cost basis. The company does not consider any others basis like direct and indirect costs or revenue and capital cost or functional classification for cost classification. Fixed and variable cost is based on the changes in activity or volume. Fixed cost or period cost remain unchanged in spite of changes in volume or activity.Variable cost or product cost vary in complete proportion to the volume of output. Capital and revenue basis depends on the purpose of expenditure. Any cost incurred in purchasing assets either to earn income or increasing the earning capacity of the business is known as capital cost. But any cost incurred for the purpose of maintaining the earning capacity of the business it is revenue expenditure.Q. Read the following statements - Assertion (A) and Reason (R)Assertion (A): Revenue Expenditure is incurred for the purpose of increasing the earning capacity of the business.Reason (R): Revenue expenditure can be easily defined as money spent for purchase or creating of long-term assetsSelect the correct alternative from the following:- a)Both Assertion (A) and Reason (R) are true.
- b)Both Assertion (A) and Reason (R) are false.
Correct answer is option 'B'. Can you explain this answer?
Direction: Read the following passage and answer the question that follows:
Jordan Cement Factories Company was set up in December 1951 as a share holding company. In March 1954, the company commenced business with the first bag of cement.
In order to ascertain the cost of products for a particular period of time, the company prepares cost sheet, the cost sheet data are collected from various statements of accounts which have been written in cost accounts either on day to day or regular records. The main elements of cost sheet are prime cost,work cost and cost of production.
The main principle that underlines the cost classifications of main elements of the cost is fixed and variable cost basis. The company does not consider any others basis like direct and indirect costs or revenue and capital cost or functional classification for cost classification. Fixed and variable cost is based on the changes in activity or volume. Fixed cost or period cost remain unchanged in spite of changes in volume or activity.
Variable cost or product cost vary in complete proportion to the volume of output. Capital and revenue basis depends on the purpose of expenditure. Any cost incurred in purchasing assets either to earn income or increasing the earning capacity of the business is known as capital cost. But any cost incurred for the purpose of maintaining the earning capacity of the business it is revenue expenditure.
Q. Read the following statements - Assertion (A) and Reason (R)
Assertion (A): Revenue Expenditure is incurred for the purpose of increasing the earning capacity of the business.
Reason (R): Revenue expenditure can be easily defined as money spent for purchase or creating of long-term assets
Select the correct alternative from the following:
a)
Both Assertion (A) and Reason (R) are true.
b)
Both Assertion (A) and Reason (R) are false.

|
Puja Kaur answered |
Understanding Assertion (A) and Reason (R)
The question presents two statements: Assertion (A) and Reason (R), related to revenue expenditure and its purpose.
Assertion (A): Revenue Expenditure is incurred for the purpose of increasing the earning capacity of the business.
- This statement is false.
- Revenue expenditure refers to costs incurred for the day-to-day functioning of a business, aimed at maintaining its earning capacity rather than increasing it.
- Examples include costs for repairs, maintenance, and operational expenses.
Reason (R): Revenue expenditure can be easily defined as money spent for purchase or creating of long-term assets.
- This statement is also false.
- Money spent on purchasing or creating long-term assets is classified as capital expenditure, not revenue expenditure.
- Capital expenditures are intended to enhance the earning capacity of a business by acquiring or improving assets.
Conclusion
Given that both Assertion (A) and Reason (R) are incorrect, the correct answer is option 'B': Both Assertion (A) and Reason (R) are false.
- Revenue expenditure does not increase earning capacity; instead, it maintains it.
- Capital expenditure is what involves long-term asset creation or purchase.
Understanding these distinctions is crucial for accurate financial analysis and reporting in any business context.
Direction: Read the following passage and answer the question that follows:Agricultural Development Bank of Pakistan uses the production function approach to measuring bank outputs and costs, a trans log cost function is estimated to provide an assessment of the bank’s scale and scope efficiency, and to quantify the extent to which its production costs are sensitive to size and output mix. Results shows that the bank enjoys both overall and product-specific economies of scale and, therefore, there exists scope for the bank to expand its operations at declining average cost.Even though bank branches in all size categories enjoy economies of scale, the extent of such economies is larger for branches operating at a smaller scale of production. This implies that as the bank branches grow larger in size in terms of both loan and deposit accounts, they move closer to attaining increasing returns to a factor. It is also shown that the marginal costs of servicing both loan and deposit accounts decline as bank branches grow larger in size in terms of either the number of loans or the number of deposits. This confirms that branches operating at a larger scale of production have attained greater cost efficiency in terms of servicing the loan and deposit accounts.Q. Economies of scale is larger for which type of bank.- a)Larger branches
- b)Smaller branches
- c)Medium Branches
- d)None of the above
Correct answer is option 'A'. Can you explain this answer?
Direction: Read the following passage and answer the question that follows:
Agricultural Development Bank of Pakistan uses the production function approach to measuring bank outputs and costs, a trans log cost function is estimated to provide an assessment of the bank’s scale and scope efficiency, and to quantify the extent to which its production costs are sensitive to size and output mix. Results shows that the bank enjoys both overall and product-specific economies of scale and, therefore, there exists scope for the bank to expand its operations at declining average cost.
Even though bank branches in all size categories enjoy economies of scale, the extent of such economies is larger for branches operating at a smaller scale of production. This implies that as the bank branches grow larger in size in terms of both loan and deposit accounts, they move closer to attaining increasing returns to a factor. It is also shown that the marginal costs of servicing both loan and deposit accounts decline as bank branches grow larger in size in terms of either the number of loans or the number of deposits. This confirms that branches operating at a larger scale of production have attained greater cost efficiency in terms of servicing the loan and deposit accounts.
Q. Economies of scale is larger for which type of bank.
a)
Larger branches
b)
Smaller branches
c)
Medium Branches
d)
None of the above
|
|
Priyanka Khatri answered |
When more units of a good or service can be produced on a larger scale, yet with (on average) fewer input costs, economies of scale are said to be achieved. Alternatively, this means that as a company grows and production units increase, a company will have a better chance to decrease its costs.
Direction: Read the following passage and answer the question that follows:Agriculture provides livelihood to almost three fourth of population of India. Indian agriculture is highly dependent on spatial and temporal distribution of rainfall. Climate extremes such as drought and flood affect agriculture severely. An account of impact of climate extremes viz. drought and flood, on Indian food-grain production has been presented in this paper. There are temporal fluctuations in food grain production and area under the food-grain. In secular terms, both of them increased up to mid-eighties.After mid-eighties there is decline in the area of food grain while maintaining an increase in production of food-grain suggesting the improvement in agricultural technology and policy. There is more temporal fluctuation in the production of food grain than the area under food grain. The analysis reveals that impact of drought on Indian agriculture is more than that of flood. Rabi food grain production depicts better adaptability to drought than Kharif food grain production mostly due to better access to irrigation infrastructure. Among the various food crops analysed all except jowar can effectively face flood events. Wheat and jowar perform relatively better during drought events.Rice is most sensitive crop to the extreme climate events. Since rice is staple food in the sub-continent, management of rice productions against climate extremes needs special attention for food security and sustainability.Q. What has caused the increase in the supply of food grains.- a)Improvement of technology
- b)Increase in production
- c)Better agricultural policy
- d)All of the above
Correct answer is option 'D'. Can you explain this answer?
Direction: Read the following passage and answer the question that follows:
Agriculture provides livelihood to almost three fourth of population of India. Indian agriculture is highly dependent on spatial and temporal distribution of rainfall. Climate extremes such as drought and flood affect agriculture severely. An account of impact of climate extremes viz. drought and flood, on Indian food-grain production has been presented in this paper. There are temporal fluctuations in food grain production and area under the food-grain. In secular terms, both of them increased up to mid-eighties.
After mid-eighties there is decline in the area of food grain while maintaining an increase in production of food-grain suggesting the improvement in agricultural technology and policy. There is more temporal fluctuation in the production of food grain than the area under food grain. The analysis reveals that impact of drought on Indian agriculture is more than that of flood. Rabi food grain production depicts better adaptability to drought than Kharif food grain production mostly due to better access to irrigation infrastructure. Among the various food crops analysed all except jowar can effectively face flood events. Wheat and jowar perform relatively better during drought events.
Rice is most sensitive crop to the extreme climate events. Since rice is staple food in the sub-continent, management of rice productions against climate extremes needs special attention for food security and sustainability.
Q. What has caused the increase in the supply of food grains.
a)
Improvement of technology
b)
Increase in production
c)
Better agricultural policy
d)
All of the above

|
Amar Jain answered |
Improvement of technology, Increase in production, Better agricultural policy
Improvement of technology:
- The increase in supply of food grains can be attributed to the continuous improvement in agricultural technology.
- Advancements in farming techniques, machinery, and irrigation systems have helped farmers increase their productivity.
Increase in production:
- The production of food grains has steadily increased over the years due to various factors such as improved seeds, fertilizers, and farming practices.
- Farmers are now able to produce more food grains per unit of land, leading to higher overall production.
Better agricultural policy:
- The implementation of better agricultural policies has also played a significant role in increasing the supply of food grains.
- Government initiatives to support farmers, provide subsidies, and improve infrastructure have helped boost food grain production.
All of the above
- Ultimately, it is the combination of improved technology, increased production, and better agricultural policies that have led to the increase in the supply of food grains in India.
Direction: In the following questions, a statement of Assertion (A) is followed by a statement of Reason (R). Mark the correct choice as:Assertion (A): When MR is positive, TR tends to increase.Reason (R): As under monopoly, more of the commodity can be sold by lowering down the price of the commodity. Hence AR curve is downward sloping from left to right.- a)Both Assertion (A) and Reason (R) are true, and Reason (R) is the correct explanation of the Assertion (A).
- b)Both Assertion (A) and Reason (R) are true, but Reason (R) is not the correct explanation of the Assertion (A).
- c)Assertion (A) is true, but Reason (R) is false.
- d)Assertion (A) is false, but Reason (R) is true.
Correct answer is option 'B'. Can you explain this answer?
Direction: In the following questions, a statement of Assertion (A) is followed by a statement of Reason (R). Mark the correct choice as:
Assertion (A): When MR is positive, TR tends to increase.
Reason (R): As under monopoly, more of the commodity can be sold by lowering down the price of the commodity. Hence AR curve is downward sloping from left to right.
a)
Both Assertion (A) and Reason (R) are true, and Reason (R) is the correct explanation of the Assertion (A).
b)
Both Assertion (A) and Reason (R) are true, but Reason (R) is not the correct explanation of the Assertion (A).
c)
Assertion (A) is true, but Reason (R) is false.
d)
Assertion (A) is false, but Reason (R) is true.
|
|
Kiran Mehta answered |
When MR is positive and constant, average and total revenue will both increase at constant rate. False; because when MR is positive and constant, AR will also be positive and constant. However, TR will increase at constant rate.
Direction: In the following questions, a statement of Assertion (A) is followed by a statement of Reason (R). Mark the correct choice as:Assertion (A): With increase in the subsidy, the supply curve shifts to the left.Reason (R): The government subsidy makes the goods more profitable for the producers to produce them.- a)Both Assertion (A) and Reason (R) are true, and Reason (R) is the correct explanation of the Assertion (A).
- b)Both Assertion (A) and Reason (R) are true, but Reason (R) is not the correct explanation of the Assertion (A).
- c)Assertion (A) is true, but Reason (R) is false.
- d)Assertion (A) is false, but Reason (R) is true.
Correct answer is option 'A'. Can you explain this answer?
Direction: In the following questions, a statement of Assertion (A) is followed by a statement of Reason (R). Mark the correct choice as:
Assertion (A): With increase in the subsidy, the supply curve shifts to the left.
Reason (R): The government subsidy makes the goods more profitable for the producers to produce them.
a)
Both Assertion (A) and Reason (R) are true, and Reason (R) is the correct explanation of the Assertion (A).
b)
Both Assertion (A) and Reason (R) are true, but Reason (R) is not the correct explanation of the Assertion (A).
c)
Assertion (A) is true, but Reason (R) is false.
d)
Assertion (A) is false, but Reason (R) is true.
|
|
Amita Das answered |
A subsidy occurs when the government pays a firm directly or reduces the firm's taxes if the firm carries out certain actions. From the firm's perspective, taxes or regulations are an additional cost of production that shifts supply to the left, leading the firm to produce a lower quantity at every given price.
The elasticity of supply measures- a)The degree of responsiveness of quantity supplied at a particular price
- b)The initial quantity supplied at the initial price
- c)The quantity supplied at a price
- d)The difference in quantity supplied when price fall
Correct answer is option 'A'. Can you explain this answer?
The elasticity of supply measures
a)
The degree of responsiveness of quantity supplied at a particular price
b)
The initial quantity supplied at the initial price
c)
The quantity supplied at a price
d)
The difference in quantity supplied when price fall
|
|
Maya Bose answered |
The elasticity of supply measures the degree of responsiveness of quantity supplied at a particular price. It indicates how much the quantity supplied changes in response to a change in price. Elasticity of supply helps us understand the sensitivity of producers to changes in market conditions.
- Definition of Elasticity of Supply:
Elasticity of supply is a measure of how the quantity supplied of a good or service changes in response to a change in its price. It shows the responsiveness of producers to changes in price.
- Formula for Elasticity of Supply:
The formula to calculate the elasticity of supply is:
Elasticity of Supply = (Percentage change in quantity supplied) / (Percentage change in price)
- Interpretation of Elasticity of Supply:
The elasticity of supply can be interpreted as follows:
1. Elastic Supply: If the elasticity of supply is greater than 1, it indicates that the quantity supplied is highly responsive to changes in price. This means that even a small change in price will lead to a relatively large change in the quantity supplied.
2. Inelastic Supply: If the elasticity of supply is less than 1, it indicates that the quantity supplied is not very responsive to changes in price. This means that a change in price will result in a relatively smaller change in the quantity supplied.
3. Unit Elastic Supply: If the elasticity of supply is exactly equal to 1, it indicates that the percentage change in quantity supplied is equal to the percentage change in price. This means that the quantity supplied changes proportionally with the change in price.
- Importance of Elasticity of Supply:
The elasticity of supply is important for several reasons:
1. Production Planning: It helps producers in planning their production levels based on the expected changes in price. If the supply is elastic, producers can easily adjust their production to meet the changes in demand.
2. Price Determination: It plays a crucial role in determining the equilibrium price in the market. If the supply is elastic, a small change in demand will result in a large change in price, and vice versa.
3. Policy Implications: It helps policymakers in understanding the impact of taxes, subsidies, and other government interventions on the supply of goods and services. By analyzing the elasticity of supply, policymakers can design more effective policies to achieve desired outcomes.
In conclusion, the elasticity of supply measures the degree of responsiveness of quantity supplied at a particular price. It provides valuable insights into how producers react to changes in market conditions and helps in decision-making regarding production planning and price determination.
Average Revenue(AR) is- a)Total cost per unit produced
- b)Total Revenue per unit of output
- c)Total revenue per unit of inputs used
- d)Sum of Total Revenue and price
Correct answer is option 'B'. Can you explain this answer?
Average Revenue(AR) is
a)
Total cost per unit produced
b)
Total Revenue per unit of output
c)
Total revenue per unit of inputs used
d)
Sum of Total Revenue and price

|
Gaurav Saini answered |
Explanation:
Average Revenue (AR) is a concept in economics that refers to the total revenue earned by a firm per unit of output sold. It is calculated by dividing the total revenue by the quantity of output sold.
Definition:
Average Revenue (AR) can be defined as the total revenue per unit of output sold.
Calculation:
AR = Total Revenue / Quantity of Output
Meaning:
Average Revenue represents the amount of revenue a firm receives for each unit of output sold. It helps in understanding the pricing and revenue generation of a business.
Importance:
Average Revenue is an important measure for businesses as it helps in determining the revenue generated per unit of output. It is useful for decision-making related to pricing strategies and revenue forecasting.
Example:
For example, if a company sells 100 units of a product and earns a total revenue of $10,000, then the Average Revenue would be $100 ($10,000 / 100 units). This means that the company receives $100 for each unit of the product sold.
Interpretation:
The Average Revenue value helps in understanding the relationship between the price charged for a product and the quantity of output sold. If the AR is high, it indicates that the company is able to charge a higher price for its products, resulting in higher revenue per unit sold. Conversely, if the AR is low, it suggests that the company is charging a lower price, resulting in lower revenue per unit sold.
Conclusion:
In conclusion, Average Revenue (AR) is the total revenue earned by a firm per unit of output sold. It is an important measure for businesses to understand their pricing and revenue generation. It is calculated by dividing the total revenue by the quantity of output sold.
The difference you find between fixed and variable costs- a)Fixed cost changes with output but variable cost does not
- b)Both change with output
- c)Both do not change with output
- d)Fixed cost does not change with output but variable cost does
Correct answer is option 'D'. Can you explain this answer?
The difference you find between fixed and variable costs
a)
Fixed cost changes with output but variable cost does not
b)
Both change with output
c)
Both do not change with output
d)
Fixed cost does not change with output but variable cost does

|
Jyoti Mukherjee answered |
Fixed and Variable Costs
Fixed costs and variable costs are two types of costs that businesses incur. Understanding the difference between these two types of costs is essential for businesses to make informed decisions about pricing, production levels, and profitability.
Fixed Costs
Fixed costs are expenses that do not change regardless of the level of output. These costs are typically associated with the overhead of the business and include items like rent, salaries, and insurance premiums. Fixed costs are a necessary expense for businesses, regardless of whether they produce goods or services.
Variable Costs
Variable costs are expenses that vary with the level of output. These costs are typically associated with the cost of producing a product or providing a service. Variable costs may include the cost of raw materials, labor, or shipping costs. As production levels increase, variable costs will increase, and as production levels decrease, variable costs will decrease.
Difference between Fixed and Variable Costs
The primary difference between fixed and variable costs is the way in which they change with output levels. Fixed costs do not change with output levels, while variable costs do. This means that regardless of how much a business produces, fixed costs remain the same. On the other hand, as a business produces more, it will incur more variable costs.
For example, consider a manufacturing company that produces widgets. The rent for the factory, the salaries of the administrative staff, and the cost of utilities are all fixed costs. These costs do not change regardless of the number of widgets produced. However, the cost of raw materials, labor, and shipping are all variable costs. As the manufacturing company produces more widgets, it will incur more variable costs.
Conclusion
In summary, fixed costs and variable costs are two types of costs that businesses incur. Fixed costs do not change with output levels, while variable costs do. Understanding the difference between these two types of costs is essential for businesses to make informed decisions about pricing, production levels, and profitability.

How is TPP derived from MPP- a)Cumulative addition
- b)Cumulative division
- c)Cumulative product
- d)Cumulative subtraction
Correct answer is option 'A'. Can you explain this answer?
How is TPP derived from MPP
a)
Cumulative addition
b)
Cumulative division
c)
Cumulative product
d)
Cumulative subtraction

|
Sparsh Sen answered |
Marginal physical product (MPP) is the change in the level of output due to a change in the level of variable input; restated, the MPP is the change in TPP for each unit of change in quantity of variable input.
Total physical product (TPP) -- Quantity of output that is produced from a firm's fixed inputs and a specified level of variable inputs.
So, by adding all the MPP, TPP can be derived.
Total physical product (TPP) -- Quantity of output that is produced from a firm's fixed inputs and a specified level of variable inputs.
So, by adding all the MPP, TPP can be derived.
Direction: In the following questions, a statement of Assertion (A) is followed by a statement of Reason (R). Mark the correct choice as:Assertion (A): The supply of food grains is inelastic.Reason (R): The supply of food grain is not responsive to the price of the food grain.- a)Both Assertion (A) and Reason (R) are true, and Reason (R) is the correct explanation of the Assertion (A).
- b)Both Assertion (A) and Reason (R) are true, but Reason (R) is not the correct explanation of the Assertion (A).
- c)Assertion (A) is true, but Reason (R) is false.
- d)Assertion (A) is false, but Reason (R) is true.
Correct answer is option 'A'. Can you explain this answer?
Direction: In the following questions, a statement of Assertion (A) is followed by a statement of Reason (R). Mark the correct choice as:
Assertion (A): The supply of food grains is inelastic.
Reason (R): The supply of food grain is not responsive to the price of the food grain.
a)
Both Assertion (A) and Reason (R) are true, and Reason (R) is the correct explanation of the Assertion (A).
b)
Both Assertion (A) and Reason (R) are true, but Reason (R) is not the correct explanation of the Assertion (A).
c)
Assertion (A) is true, but Reason (R) is false.
d)
Assertion (A) is false, but Reason (R) is true.
|
|
Arun Yadav answered |
The price elasticity of demand is a measure of the responsiveness of demand to a change in price. A food is said to be price inelastic, not responsive to price when its own-price elasticity is greater than -1.0. A food is said to be price elastic responsive to price when its own-price elasticity is less than -1.0.
Direction: In the following questions, a statement of Assertion (A) is followed by a statement of Reason (R). Mark the correct choice as:Assertion (A): The supply curve of a good shift to the right when prices of other goods fall.Reason (R): When price of other good falls, it becomes less profitable to produce them in place of the given good.- a)Both Assertion (A) and Reason (R) are true, and Reason (R) is the correct explanation of the Assertion (A).
- b)Both Assertion (A) and Reason (R) are true, but Reason (R) is not the correct explanation of the Assertion (A).
- c)Assertion (A) is true, but Reason (R) is false.
- d)Assertion (A) is false, but Reason (R) is true.
Correct answer is option 'A'. Can you explain this answer?
Direction: In the following questions, a statement of Assertion (A) is followed by a statement of Reason (R). Mark the correct choice as:
Assertion (A): The supply curve of a good shift to the right when prices of other goods fall.
Reason (R): When price of other good falls, it becomes less profitable to produce them in place of the given good.
a)
Both Assertion (A) and Reason (R) are true, and Reason (R) is the correct explanation of the Assertion (A).
b)
Both Assertion (A) and Reason (R) are true, but Reason (R) is not the correct explanation of the Assertion (A).
c)
Assertion (A) is true, but Reason (R) is false.
d)
Assertion (A) is false, but Reason (R) is true.
|
|
Kiran Mehta answered |
When the price of a good that complements a good decreases, then the quantity demanded of one increases and the demand for the other increases. When the price of a substitute good decreases, the quantity demanded for that good increases, but the demand for the good that it is being substituted for decreases.
Direction: In the following questions, a statement of Assertion (A) is followed by a statement of Reason (R). Mark the correct choice as:Assertion (A): Increasing returns to a factor is a short run phenomenon.Reason (R): Greater application of the variable factor ensures fully utilization of the fixed factor.- a)Both Assertion (A) and Reason (R) are true, and Reason (R) is the correct explanation of the Assertion (A).
- b)Both Assertion (A) and Reason (R) are true, but Reason (R) is not the correct explanation of the Assertion (A).
- c)Assertion (A) is true, but Reason (R) is false.
- d)Assertion (A) is false, but Reason (R) is true.
Correct answer is option 'B'. Can you explain this answer?
Direction: In the following questions, a statement of Assertion (A) is followed by a statement of Reason (R). Mark the correct choice as:
Assertion (A): Increasing returns to a factor is a short run phenomenon.
Reason (R): Greater application of the variable factor ensures fully utilization of the fixed factor.
a)
Both Assertion (A) and Reason (R) are true, and Reason (R) is the correct explanation of the Assertion (A).
b)
Both Assertion (A) and Reason (R) are true, but Reason (R) is not the correct explanation of the Assertion (A).
c)
Assertion (A) is true, but Reason (R) is false.
d)
Assertion (A) is false, but Reason (R) is true.
|
|
Kiran Mehta answered |
Increasing returns to scale relate to the long run in which all inputs are variable. Increasing marginal returns related to the short run in which one or more input is variable and one or more input is fixed.
Direction: In the following questions, a statement of Assertion (A) is followed by a statement of Reason (R). Mark the correct choice as:Assertion (A): When the price of the goods falls, the supply curve shifts to the right.Reason (R): When price of the goods falls, the producers sell less as there is a positive relation between price and quantity supplied.- a)Both Assertion (A) and Reason (R) are true, and Reason (R) is the correct explanation of the Assertion (A).
- b)Both Assertion (A) and Reason (R) are true, but Reason (R) is not the correct explanation of the Assertion (A).
- c)Assertion (A) is true, but Reason (R) is false.
- d)Assertion (A) is false, but Reason (R) is true.
Correct answer is option 'C'. Can you explain this answer?
Direction: In the following questions, a statement of Assertion (A) is followed by a statement of Reason (R). Mark the correct choice as:
Assertion (A): When the price of the goods falls, the supply curve shifts to the right.
Reason (R): When price of the goods falls, the producers sell less as there is a positive relation between price and quantity supplied.
a)
Both Assertion (A) and Reason (R) are true, and Reason (R) is the correct explanation of the Assertion (A).
b)
Both Assertion (A) and Reason (R) are true, but Reason (R) is not the correct explanation of the Assertion (A).
c)
Assertion (A) is true, but Reason (R) is false.
d)
Assertion (A) is false, but Reason (R) is true.
|
|
Amita Das answered |
New technology: When a firm discovers a new technology that allows it to produce at a lower cost, the supply curve will shift to the right as well. ... A technological improvement that reduces costs of production will shift supply to the right, causing a greater quantity to be produced at any given price.
Direction: In the following questions, a statement of Assertion (A) is followed by a statement of Reason (R). Mark the correct choice as:Assertion (A): Increasing returns to a factor is a short run phenomenon.Reason (R): Greater application of the variable factor ensures fully utilization of the fixed factor.- a)Both Assertion (A) and Reason (R) are true, and Reason (R) is the correct explanation of the Assertion (A).
- b)Both Assertion (A) and Reason (R) are true, but Reason (R) is not the correct explanation of the Assertion (A).
- c)Assertion (A) is true, but Reason (R) is false.
- d)Assertion (A) is false, but Reason (R) is true.
Correct answer is option 'B'. Can you explain this answer?
Direction: In the following questions, a statement of Assertion (A) is followed by a statement of Reason (R). Mark the correct choice as:
Assertion (A): Increasing returns to a factor is a short run phenomenon.
Reason (R): Greater application of the variable factor ensures fully utilization of the fixed factor.
a)
Both Assertion (A) and Reason (R) are true, and Reason (R) is the correct explanation of the Assertion (A).
b)
Both Assertion (A) and Reason (R) are true, but Reason (R) is not the correct explanation of the Assertion (A).
c)
Assertion (A) is true, but Reason (R) is false.
d)
Assertion (A) is false, but Reason (R) is true.
|
|
Baishali Chakraborty answered |
Assertion (A): Increasing returns to a factor is a short-run phenomenon.
Reason (R): Greater application of the variable factor ensures fully utilization of the fixed factor.
The correct answer is option B: Both Assertion (A) and Reason (R) are true, but Reason (R) is not the correct explanation of the Assertion (A).
Explanation:
To understand the relationship between increasing returns to a factor and the utilization of fixed and variable factors, let's first define these terms.
- Increasing returns to a factor: This concept refers to a situation where increasing the use of a particular input (factor of production) leads to a more than proportionate increase in output. In other words, it implies that the marginal product of the input increases as more of it is employed.
- Fixed factor: A fixed factor of production refers to an input that cannot be easily varied in the short run. For example, in the context of a factory, the size of the building and the machinery installed may be considered fixed factors.
- Variable factor: A variable factor of production is an input that can be easily adjusted in the short run to increase or decrease production. For example, labor can be considered a variable factor as it can be readily hired or laid off depending on the level of output required.
Now, let's analyze the Assertion (A) and Reason (R) given in the question.
Assertion (A): Increasing returns to a factor is a short-run phenomenon.
This assertion is true. Increasing returns to a factor typically occur in the early stages of production when additional units of a variable factor of production are added to a fixed factor. As more of the variable factor is employed, there is often an improvement in efficiency, specialization, and division of labor, leading to higher productivity and increasing returns.
Reason (R): Greater application of the variable factor ensures fully utilization of the fixed factor.
This reason is also true. When the variable factor is increased, it allows for the better utilization of the fixed factor. As more units of the variable factor are employed, the fixed factor is fully utilized, which leads to economies of scale and increased output.
However, Reason (R) does not provide a correct explanation of Assertion (A). The reason simply states that greater application of the variable factor ensures the full utilization of the fixed factor but does not explain why increasing returns to a factor is a short-run phenomenon.
In conclusion, both Assertion (A) and Reason (R) are true, but Reason (R) does not explain Assertion (A) correctly. Therefore, the correct answer is option B.
Reason (R): Greater application of the variable factor ensures fully utilization of the fixed factor.
The correct answer is option B: Both Assertion (A) and Reason (R) are true, but Reason (R) is not the correct explanation of the Assertion (A).
Explanation:
To understand the relationship between increasing returns to a factor and the utilization of fixed and variable factors, let's first define these terms.
- Increasing returns to a factor: This concept refers to a situation where increasing the use of a particular input (factor of production) leads to a more than proportionate increase in output. In other words, it implies that the marginal product of the input increases as more of it is employed.
- Fixed factor: A fixed factor of production refers to an input that cannot be easily varied in the short run. For example, in the context of a factory, the size of the building and the machinery installed may be considered fixed factors.
- Variable factor: A variable factor of production is an input that can be easily adjusted in the short run to increase or decrease production. For example, labor can be considered a variable factor as it can be readily hired or laid off depending on the level of output required.
Now, let's analyze the Assertion (A) and Reason (R) given in the question.
Assertion (A): Increasing returns to a factor is a short-run phenomenon.
This assertion is true. Increasing returns to a factor typically occur in the early stages of production when additional units of a variable factor of production are added to a fixed factor. As more of the variable factor is employed, there is often an improvement in efficiency, specialization, and division of labor, leading to higher productivity and increasing returns.
Reason (R): Greater application of the variable factor ensures fully utilization of the fixed factor.
This reason is also true. When the variable factor is increased, it allows for the better utilization of the fixed factor. As more units of the variable factor are employed, the fixed factor is fully utilized, which leads to economies of scale and increased output.
However, Reason (R) does not provide a correct explanation of Assertion (A). The reason simply states that greater application of the variable factor ensures the full utilization of the fixed factor but does not explain why increasing returns to a factor is a short-run phenomenon.
In conclusion, both Assertion (A) and Reason (R) are true, but Reason (R) does not explain Assertion (A) correctly. Therefore, the correct answer is option B.
Direction: Read the following passage and answer the question that follows:The production function exhibits technological relationships between physical inputs and outputs and is thus said to belong to the domain of engineering. Prof. Stigler does not agree with this commonly held view. The function of management is to sort out the right type of combination of inputs for the quantity of output he desires.For this, he has to know the prices of his inputs and the technique to be used for producing a specified output within a specified period of time. All these technical possibilities are derived from applied sciences but cannot be worked out by technologists or engineers alone. ‘The entrepreneurs also provide productive services, and they are far from standardized.Some men can get gang of workers to do their best, others are better at luring customers, still others at borrowing money, and each will have a different production function. If we take account of activities such as selling, settling strikes and anticipating future styles of product, it is clear that large segments of what we mean by technique are matters of business knowledge and talents, not to be acquired in the best engineering schools.” The production function is, in fact, “the economist’s summary of technological knowledge,” as pointed out by Prof. Stigler.Q. Who all have a productions function?- a)Gang of workers
- b)Luring customers
- c)Borrowers
- d)All of the above
Correct answer is option 'D'. Can you explain this answer?
Direction: Read the following passage and answer the question that follows:
The production function exhibits technological relationships between physical inputs and outputs and is thus said to belong to the domain of engineering. Prof. Stigler does not agree with this commonly held view. The function of management is to sort out the right type of combination of inputs for the quantity of output he desires.
For this, he has to know the prices of his inputs and the technique to be used for producing a specified output within a specified period of time. All these technical possibilities are derived from applied sciences but cannot be worked out by technologists or engineers alone. ‘The entrepreneurs also provide productive services, and they are far from standardized.
Some men can get gang of workers to do their best, others are better at luring customers, still others at borrowing money, and each will have a different production function. If we take account of activities such as selling, settling strikes and anticipating future styles of product, it is clear that large segments of what we mean by technique are matters of business knowledge and talents, not to be acquired in the best engineering schools.” The production function is, in fact, “the economist’s summary of technological knowledge,” as pointed out by Prof. Stigler.
Q. Who all have a productions function?
a)
Gang of workers
b)
Luring customers
c)
Borrowers
d)
All of the above
|
|
Arun Yadav answered |
One very simple example of a production function might be Q = K + L, where Q is the quantity of output, K is the amount of capital, and L is the amount of labor used in production. For example, a firm with five employees will produce five units of output as long as it has at least five units of capital.
Identify the correct pair of items from the following Columns I and II: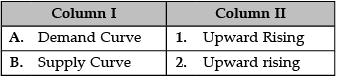
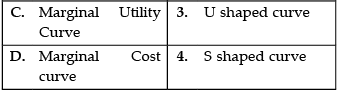
- a)A–1
- b)B–2
- c)C–3
- d)D–4
Correct answer is option 'B'. Can you explain this answer?
Identify the correct pair of items from the following Columns I and II:
a)
A–1
b)
B–2
c)
C–3
d)
D–4
|
|
Kiran Mehta answered |
A. Demand Curve: The demand curve is a graphical representation of the relationship between the price of a good or service and the quantity demanded for a given period of time.
B. Supply Curve: The supply curve is a graphic representation of the correlation between the cost of a good or service and the quantity supplied for a given period.
C. Marginal Utility Curve: Marginal utility is the added satisfaction that a consumer gets from having one more unit of a good or service.
D. Marginal Cost Curve: A curve that graphically represents the relation between the marginal cost incurred by a firm in the short-run product of a good or service and the quantity of output produced.
Identify the correctly matched statements from Column I to that of Column II: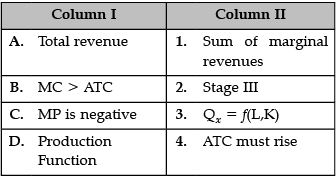
- a)A–1
- b)B–2
- c)C–3
- d)D–4
Correct answer is option 'A'. Can you explain this answer?
Identify the correctly matched statements from Column I to that of Column II:
a)
A–1
b)
B–2
c)
C–3
d)
D–4
|
|
Amita Das answered |
A. Total revenue: Total revenue is the full amount of total sales of goods and services. It is calculated by multiplying the total amount of goods and services sold by the price of the goods and services.
B. MC > ATC: The relationship between the ATC and MC. Whenever MC is less than ATC, ATC is falling. Whenever MC is greater than ATC, ATC is rising. When ATC reaches its minimum point, MC = ATC.
C. MP is negative: MP is that rate. At the point where TP is at its maximum, MP = 0, the point at which it crosses the x- axis. After this point, MP is actually negative, meaning that TP is falling.
D. Production Function: Production function, in economics, equation that expresses the relationship between the quantities of productive factors (such as labour and capital) used and the amount of product obtained.
Which of the following statements correctly describes a short-run production function?- a)All factors of production are variable, allowing constant returns to scale.
- b)It is also called the fixed proportion type of production function.
- c)Some factors of production remain fixed, leading to diminishing marginal product.
- d)It is used only when labour is the sole factor of production.
Correct answer is option 'C'. Can you explain this answer?
Which of the following statements correctly describes a short-run production function?
a)
All factors of production are variable, allowing constant returns to scale.
b)
It is also called the fixed proportion type of production function.
c)
Some factors of production remain fixed, leading to diminishing marginal product.
d)
It is used only when labour is the sole factor of production.
|
|
Sai Kulkarni answered |
Some factors of production remain fixed, leading to diminishing marginal product.
Explanation: In the short run, at least one input is fixed, leading to the law of diminishing marginal returns.
At what point does the Marginal Product (MP) curve intersect the Average Product (AP) curve?- a)When MP is zero
- b)When AP is at its maximum
- c)When MP is less than AP
- d)When TP is at its maximum
Correct answer is option 'B'. Can you explain this answer?
At what point does the Marginal Product (MP) curve intersect the Average Product (AP) curve?
a)
When MP is zero
b)
When AP is at its maximum
c)
When MP is less than AP
d)
When TP is at its maximum
|
|
Sai Kulkarni answered |
The Marginal Product (MP) curve intersects the Average Product (AP) curve at a specific point that is crucial for understanding production efficiency.
Here are the key points regarding this intersection:
- The intersection occurs when AP is at its maximum.
- At this point, the MP is equal to the AP.
- Before this intersection, the MP is greater than the AP, causing the AP to rise.
- After the intersection, the MP becomes less than the AP, leading to a decline in the AP.
Thus, the relationship between MP and AP is essential for analysing production levels and efficiency.
Chapter doubts & questions for Production and Costs - Economics Class 11 2025 is part of Commerce exam preparation. The chapters have been prepared according to the Commerce exam syllabus. The Chapter doubts & questions, notes, tests & MCQs are made for Commerce 2025 Exam. Find important definitions, questions, notes, meanings, examples, exercises, MCQs and online tests here.
Chapter doubts & questions of Production and Costs - Economics Class 11 in English & Hindi are available as part of Commerce exam.
Download more important topics, notes, lectures and mock test series for Commerce Exam by signing up for free.
Economics Class 11
59 videos|222 docs|43 tests
|
|
© EduRev
|
Education Revolution
|


|


Signup on EduRev and stay on top of your study goals
10M+ students crushing their study goals daily