


All questions of Control Systems for Electronics and Communication Engineering (ECE) Exam
Can you explain the answer of this question below:
The sum of the gains of the feedback paths in the signal flow graph shown in fig. is
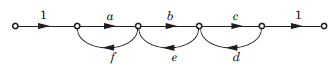 A: af + be + cd
B: af + be + cd+abef + bcdeC: af + be + cd + abef + abcdefD: af + be + cd + cbef + bcde + abcdefThe answer is a.

|
Phanindra Varma N answered |
Answer is B because ut can form only individual loop gains

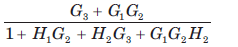
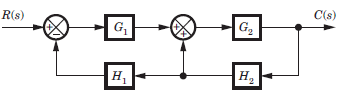
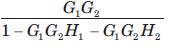
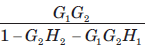
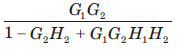
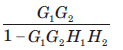
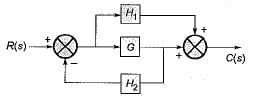
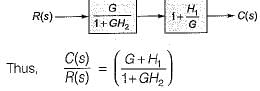
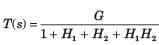
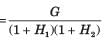
The block diagram of a system is shown in fig.The closed loop transfer function of this system is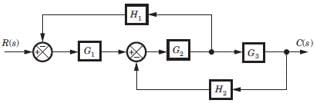
a)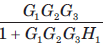 b)
b) 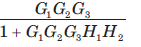 c)
c) 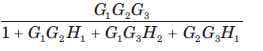
d) 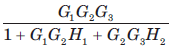
Correct answer is 'D'. Can you explain this answer?
a)
b)
c)
d)
Correct answer is 'D'. Can you explain this answer?
|
|
Nitya Ahuja answered |
Consider the block diagram as SFG. There are two feedback loop -G1G2H1 and -G2G3H2 and one forward path G1G2 G3 . So (D) is correct option.
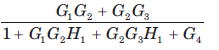
The gain C(s)/R(s) of the signal flow graph shown in fig.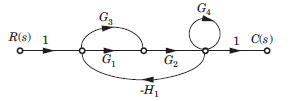
- a)
- b)
- c)
- d)
Correct answer is option 'B'. Can you explain this answer?
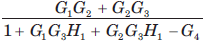
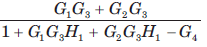
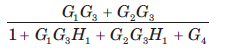
The gain C(s)/R(s) of the signal flow graph shown in fig.
a)
b)
c)
d)

|
Pie Academy answered |
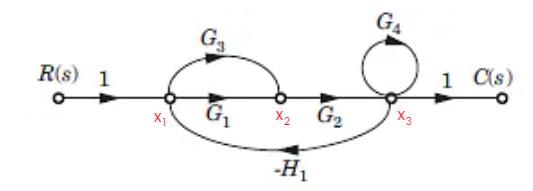
X1 = 1 - H1
X2 = (G1 + G3) X1 - X3H1
X3 = X2G2 + G4
Linear system obeys- a)reciprocity theorem
- b)principle of maximum power transfer
- c)both (a) and (b)
- d)none of the above
Correct answer is option 'C'. Can you explain this answer?
Linear system obeys
a)
reciprocity theorem
b)
principle of maximum power transfer
c)
both (a) and (b)
d)
none of the above
|
|
Sanvi Kapoor answered |
Linear system obeys both reciprocity theorem and principle of maximum power transfer.
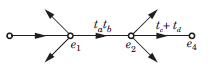
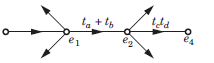
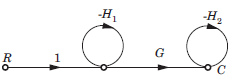
For the signal flow graph shown in fig. an equivalent graph is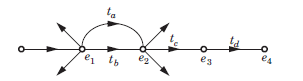
- a)
- b)
- c)
- d)
Correct answer is option 'C'. Can you explain this answer?
For the signal flow graph shown in fig. an equivalent graph is
a)
b)
c)
d)

|
Aim It Academy answered |
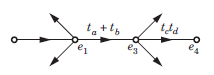
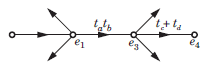
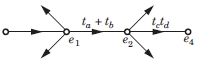
While writing the transfer function of this signal flow graph,
e2= tae1 + tbe1 = (ta+ tb) e1
Then, signal flow graph will lokk like this:
In the signal flow graph of figure y/x equalsa) 3b) 2c) 5/2d) None of the aboveCorrect answer is option 'B'. Can you explain this answer?
|
|
Aditya Deshmukh answered |
The answer is b.
P1 = 5 x 2 x 1 = 10
P1 = 5 x 2 x 1 = 10
L1 = - 4
Y/X = 10/1-(-4) = 2
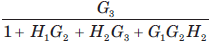
For the system shown in fig. transfer function C(s) R(s) is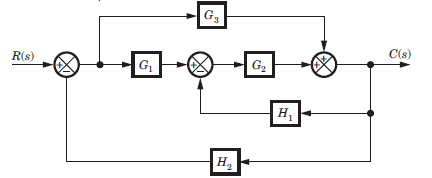
- a)
- b)
- c)
- d)
Correct answer is option 'B'. Can you explain this answer?
For the system shown in fig. transfer function C(s) R(s) is
a)
b)
c)
d)

|
Gate Gurus answered |
Consider the block diagram as a SFG. Two forward path G1G2 and G3 and three loops -G1G2 H2, -G2H1, -G3 H2
There are no nontouching loop. So (B) is correct.
There are no nontouching loop. So (B) is correct.
A Routh table is shown in fig. The location of pole on RHP, LHP and imaginary axis are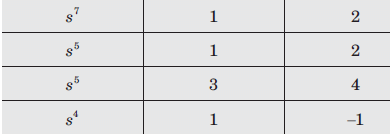
- a)1, 2, 4
- b)1, 6, 0
- c)1, 0, 6
- d)None of the above
Correct answer is 'A'. Can you explain this answer?
A Routh table is shown in fig. The location of pole on RHP, LHP and imaginary axis are
a)
1, 2, 4
b)
1, 6, 0
c)
1, 0, 6
d)
None of the above

|
Jaya Yadav answered |
If the system is given with the unbounded input then nothing can be clarified for the stability of the system.
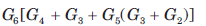
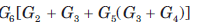
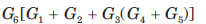
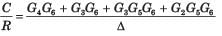
For the block diagram shown in fig. the numerator of transfer function is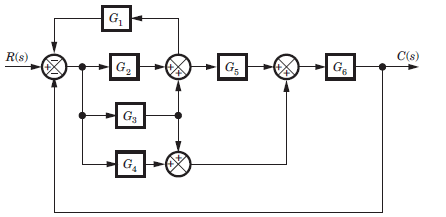
- a)
- b)
- c)
- d)none of these
Correct answer is option 'A'. Can you explain this answer?
For the block diagram shown in fig. the numerator of transfer function is
a)
b)
c)
d)
none of these
|
|
Zoya Sharma answered |
SFG
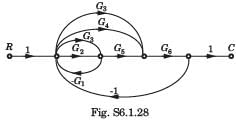
P1 = G2G5G6 , P2 = G3G5G6, P3 = G3G6 , P4 = G4G6
If any path is deleted, there would not be any loop.
Hence Δ1 = Δ2 = Δ3 = Δ4 = 1
P1 = G2G5G6 , P2 = G3G5G6, P3 = G3G6 , P4 = G4G6
If any path is deleted, there would not be any loop.
Hence Δ1 = Δ2 = Δ3 = Δ4 = 1
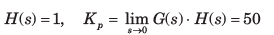
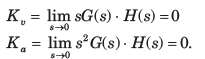
A ufb control system has a forward path transfer function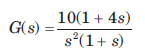 If the system is subjected to an input r(t) = 1 + t + 1/2 t2 , t > 0the steady state error of the system will be
- a)0
- b)0.1
- c)10
- d)∞
Correct answer is option 'C'. Can you explain this answer?
A ufb control system has a forward path transfer function
If the system is subjected to an input r(t) = 1 + t + 1/2 t2 , t > 0the steady state error of the system will be
a)
0
b)
0.1
c)
10
d)
∞
|
|
Lekshmi Kulkarni answered |
System is type 2. Therefore error due to 1+t would be zero and due to  would be
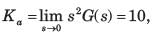
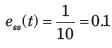
Note that you may calculate error from the formula
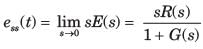
would be Note that you may calculate error from the formula


The principle of homogeneity and superposition are applied to:a)Linear time variant systemsb)Nonlinear time invariant systemsc)Linear time invariant systemsd)Nonlinear time invariant systemsCorrect answer is 'C'. Can you explain this answer?
|
|
Aditya Deshmukh answered |
Superposition theorem states that for two signals, additive and homogeneity property must be satisfied and that is applicable for the Linear time variant (LTI) systems.
Assertion (A): Closed loop control systems are known as feedback control systems.
Reason (R): In closed loop control systems, the control action is dependent on the desired output.- a)Both A and R are true and R is a correct explanation of A.
- b)Both A and R are true but R is not a correct explanation of A.
- c)A is true but R is false.
- d)A is false but R is true.
Correct answer is option 'A'. Can you explain this answer?
Assertion (A): Closed loop control systems are known as feedback control systems.
Reason (R): In closed loop control systems, the control action is dependent on the desired output.
Reason (R): In closed loop control systems, the control action is dependent on the desired output.
a)
Both A and R are true and R is a correct explanation of A.
b)
Both A and R are true but R is not a correct explanation of A.
c)
A is true but R is false.
d)
A is false but R is true.
|
|
Sanvi Kapoor answered |
- In closed loop system there is the presence of a feedback path and this feedback path has connected from output of the system to the input of the system.
- The whole operation is controlled by the output of the system.
The output of the feedback control system must be a function of:
- a)Reference input
- b)Reference output
- c)Output and feedback signal
- d)Input and feedback signal
Correct answer is option 'D'. Can you explain this answer?
The output of the feedback control system must be a function of:
a)
Reference input
b)
Reference output
c)
Output and feedback signal
d)
Input and feedback signal
|
|
Athira Reddy answered |
Explanation: In a feedback control system, the output is determined by a combination of the input signal and the feedback signal. The input signal is the desired output or reference, while the feedback signal is a portion of the actual output that is fed back into the system to compare with the input. This comparison helps the system to adjust its output to minimize the error between the input and the actual output. By considering both the input and feedback signals, the system can continuously adapt and achieve the desired output.
The steady-state error of a feedback control system with an acceleration input becomes finite in a- a)type-3 system
- b)type-2 system
- c)type-1 system
- d)type-0 system
Correct answer is option 'B'. Can you explain this answer?
The steady-state error of a feedback control system with an acceleration input becomes finite in a
a)
type-3 system
b)
type-2 system
c)
type-1 system
d)
type-0 system
|
|
Raj Choudhary answered |
Steady state error with an acceleration input having an amplitude of A is given by

where,
Hence, if the type of the system = 2, then Ka = some non-zero value or finite value due to which we will get some finite vaiue of Ka.
where,
Hence, if the type of the system = 2, then Ka = some non-zero value or finite value due to which we will get some finite vaiue of Ka.
Assertion (A): If the number of zeros are less than the number of poles (i.e. Z < P), we say that there are zeros at infinity and the order of such zeros is P-Z
Reason (R): The value of the transfer function becomes zero for s tends to zero.- a)Both A and R are true and R is a correct explanation of A.
- b)Both A and R are true but R is not a correct explanation of A.
- c)A is true but R is false.
- d)A is false but R is true.
Correct answer is option 'C'. Can you explain this answer?
Assertion (A): If the number of zeros are less than the number of poles (i.e. Z < P), we say that there are zeros at infinity and the order of such zeros is P-Z
Reason (R): The value of the transfer function becomes zero for s tends to zero.
Reason (R): The value of the transfer function becomes zero for s tends to zero.
a)
Both A and R are true and R is a correct explanation of A.
b)
Both A and R are true but R is not a correct explanation of A.
c)
A is true but R is false.
d)
A is false but R is true.

|
Uday Kumar answered |
For Z < P,
∴ Here, number of zeros = 1 and no. of poles = 2
∴ P - Z = 1
When s →∞, transfer function becomes zero. Thus, there is one zero (P - Z = 1) at infinity. Thus, assertion is true.
Since value of transfer function becomes zero as s →∞ therefore, reason is false.
∴ Here, number of zeros = 1 and no. of poles = 2
∴ P - Z = 1
When s →∞, transfer function becomes zero. Thus, there is one zero (P - Z = 1) at infinity. Thus, assertion is true.
Since value of transfer function becomes zero as s →∞ therefore, reason is false.
Consider the List I and List II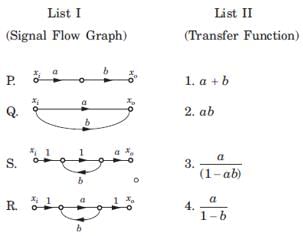 The correct match is
- a)2 1 3 4
- b)2 1 4 3
- c)1 2 4 3
- d)1 2 3 4
Correct answer is option 'B'. Can you explain this answer?
Consider the List I and List II
The correct match is
a)
2 1 3 4
b)
2 1 4 3
c)
1 2 4 3
d)
1 2 3 4

|
Om Pillai answered |
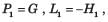
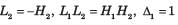
P. P1 = ab, Δ = 1, L = 0 ,T = ab
Q1 P1 = a, P2 = 6 , Δ = 1, L = Δk = 0,T = a+b
R. P1 = a, L1 = b, Δ = 1 - b, Δ1 =1,
S. P1 = a, L1 = ab, Δ = 1 - ab, Δ1 = 1,
Q1 P1 = a, P2 = 6 , Δ = 1, L = Δk = 0,T = a+b
R. P1 = a, L1 = b, Δ = 1 - b, Δ1 =1,
S. P1 = a, L1 = ab, Δ = 1 - ab, Δ1 = 1,
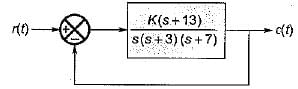
For which of the following values of K, the feedback system shown in the below figure is stable?
- a)K < 0
- b)K > 0
- c)0 < K < 54
- d)0 < K < 70
Correct answer is option 'D'. Can you explain this answer?
For which of the following values of K, the feedback system shown in the below figure is stable?
a)
K < 0
b)
K > 0
c)
0 < K < 54
d)
0 < K < 70
|
|
Rhea Reddy answered |
The characteristic equation is
1 + G (s) H (s) = 0
or,
1 + G (s) H (s) = 0
or,
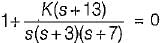
or, s3 + 10s2 + (21 + K )s + 13 K= 0
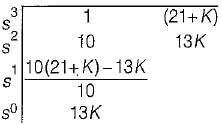
For stability, 13K > 0 or K > 0
Also,
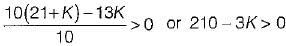
or, K < 70
Hence, 0 < K< 70 (For stability).
The negative feedback closed-loop system was subjected to 15V. The system has a forward gain of 2 and a feedback gain of 0.5. Determine the output voltage and the error voltage.- a)15V, 10V
- b)6V, 5V
- c)15V, 7.5V
- d)5V, 10V
Correct answer is option 'C'. Can you explain this answer?
The negative feedback closed-loop system was subjected to 15V. The system has a forward gain of 2 and a feedback gain of 0.5. Determine the output voltage and the error voltage.
a)
15V, 10V
b)
6V, 5V
c)
15V, 7.5V
d)
5V, 10V

|
Starcoders answered |
The negative feedback closed-loop system, subjected to 15V, has a forward gain of 2 and a feedback gain of 0.5.
- The output voltage is calculated as the product of the forward gain and the effective input voltage.
- The effective input voltage is the difference between the input voltage and the feedback voltage.
To find the output voltage:
- Calculate the feedback voltage: Output Voltage multiplied by Feedback Gain.
- Effective input = Input voltage - Feedback voltage.
- Output voltage = Forward gain x Effective input voltage.
After solving, the output voltage is 15V and the error voltage is 7.5V.

Consider the following statements regarding the characteristic equation of a system given by:
s4 + 5s3 + 25+10 = 0
1. The system is unstable.
2. The system is stable.
3. Number of roots with zero real part - 0
4. Number of roots with positive real part - 4
5. Number of roots with negative real part = 2
Which of the above statements are correct?- a)2 and 3
- b)1 and 3
- c)2, 3 and 4
- d)1, 3 and 5
Correct answer is option 'D'. Can you explain this answer?
Consider the following statements regarding the characteristic equation of a system given by:
s4 + 5s3 + 25+10 = 0
1. The system is unstable.
2. The system is stable.
3. Number of roots with zero real part - 0
4. Number of roots with positive real part - 4
5. Number of roots with negative real part = 2
Which of the above statements are correct?
s4 + 5s3 + 25+10 = 0
1. The system is unstable.
2. The system is stable.
3. Number of roots with zero real part - 0
4. Number of roots with positive real part - 4
5. Number of roots with negative real part = 2
Which of the above statements are correct?
a)
2 and 3
b)
1 and 3
c)
2, 3 and 4
d)
1, 3 and 5
|
|
Anirban Gupta answered |
The Routh’s array is
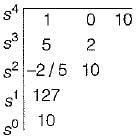
Since there are two sign changes in first column of Routh’s array, therefore the system is unstable.
Number of roots with positive real part = 2
Number of roots with negative real part = 2
Number of roots with zero real part = 0
Since there are two sign changes in first column of Routh’s array, therefore the system is unstable.
Number of roots with positive real part = 2
Number of roots with negative real part = 2
Number of roots with zero real part = 0
If the constant 'k' is negative, then what would be its contribution to the phase plot:- a)90 degrees
- b)45 degrees
- c)180 degrees
- d)0 degree
Correct answer is option 'C'. Can you explain this answer?
If the constant 'k' is negative, then what would be its contribution to the phase plot:
a)
90 degrees
b)
45 degrees
c)
180 degrees
d)
0 degree
|
|
Kunal Yadav answered |
Explanation:
When analyzing the phase plot of a system, we consider the effect of each component separately and then combine them to determine the overall phase shift. In this case, we are considering the effect of a negative constant, denoted as k, on the phase plot.
Effect of a Negative Constant on the Phase Plot:
When the constant k is negative, it means that it has a negative value. This negative value contributes a phase shift to the overall phase plot.
Contribution of a Negative Constant to the Phase Plot:
The contribution of a negative constant to the phase plot can be determined by considering the properties of the complex plane and the concept of complex numbers.
In the complex plane, the negative real axis is oriented at an angle of 180 degrees with respect to the positive real axis. This means that any negative value on the real axis will have a phase shift of 180 degrees.
Since the constant k is negative, its contribution to the phase plot is a phase shift of 180 degrees.
Therefore, the correct answer is option 'C' - 180 degrees.
Summary:
- When the constant k is negative, it contributes a phase shift to the phase plot.
- The contribution of a negative constant to the phase plot is a phase shift of 180 degrees.
- Therefore, the correct answer is option 'C' - 180 degrees.
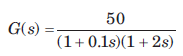
The transfer function of a system is 
The system is then which one of the following?- a)Non-minimum phase function
- b)Low-pass system
- c)Second-order system
- d)None of the above
Correct answer is option 'D'. Can you explain this answer?
The transfer function of a system is
The system is then which one of the following?
The system is then which one of the following?
a)
Non-minimum phase function
b)
Low-pass system
c)
Second-order system
d)
None of the above
|
|
Ashutosh Majumdar answered |
Since one pole (s .= 1) lies in RH s-plane, therefore the system is unstable.
Which of the following is the correct statement?
A minimum phase network is one whose transfer function has- a)zeros in the right hand s-plane and poles in the left hand s-plane.
- b)zeros and poles in the left hand s-plane.
- c)zeros in the left hand s-plane and poles in the right hand s-plane.
- d)arbitrary distribution of zeros and poles in the S-plane.
Correct answer is option 'B'. Can you explain this answer?
Which of the following is the correct statement?
A minimum phase network is one whose transfer function has
A minimum phase network is one whose transfer function has
a)
zeros in the right hand s-plane and poles in the left hand s-plane.
b)
zeros and poles in the left hand s-plane.
c)
zeros in the left hand s-plane and poles in the right hand s-plane.
d)
arbitrary distribution of zeros and poles in the S-plane.
|
|
Anjali Choudhury answered |
Explanation:
Minimum Phase Network:
A minimum phase network is a type of linear time-invariant (LTI) system in which all the zeroes and poles of the transfer function lie in the left-half of the s-plane. The transfer function of a minimum phase network is a causal and stable function that can be factored into a product of two terms: a minimum phase term and a delay term. The minimum phase term has all its zeroes and poles in the left-half of the s-plane, while the delay term has a pole at the origin.
Transfer Function:
The transfer function of a minimum phase network is given by:
H(s) = e^(-Ds) * G(s)
where D is a positive constant, G(s) is the minimum phase transfer function, and e^(-Ds) is the delay term. The transfer function H(s) can be expressed as a product of the minimum phase term G(s) and the delay term e^(-Ds). The minimum phase term G(s) is a causal and stable function that has all its zeroes and poles in the left-half of the s-plane. The delay term e^(-Ds) is a non-causal and unstable function that has a pole at the origin.
Properties of Minimum Phase Network:
The following are some of the properties of a minimum phase network:
- All the zeroes and poles of the transfer function lie in the left-half of the s-plane.
- The step response of a minimum phase network is faster than that of a non-minimum phase network with the same magnitude response.
- The phase response of a minimum phase network is always less than or equal to the phase response of a non-minimum phase network with the same magnitude response.
- The impulse response of a minimum phase network decays faster than that of a non-minimum phase network with the same magnitude response.
Answer:
Option 'B' is the correct statement. A minimum phase network is one whose transfer function has zeros and poles in the left-hand s-plane.
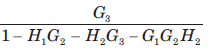
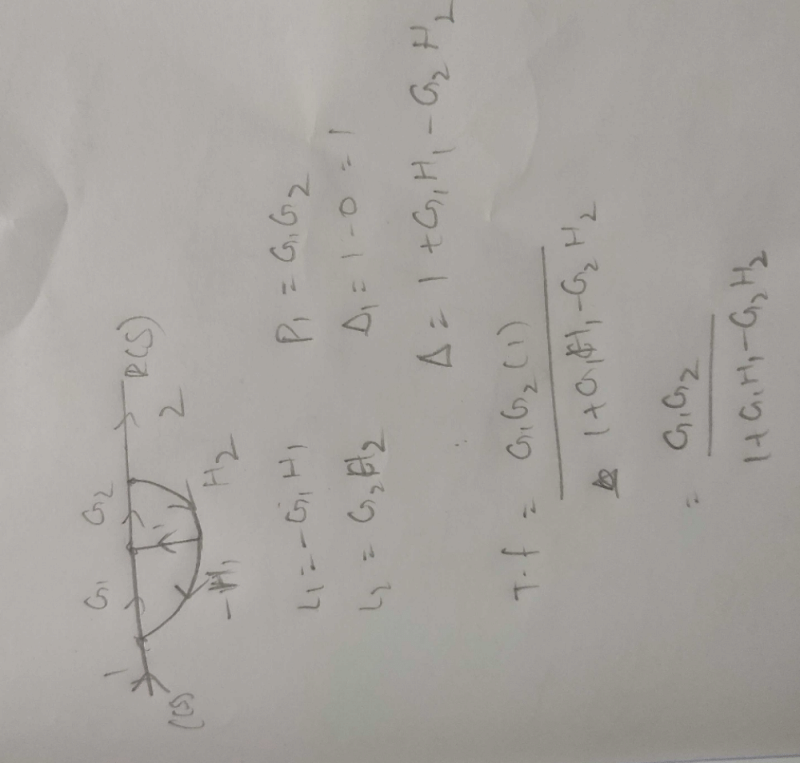
The transfer function C(s)/R(s) for the system described by the block diagram shown below is given by:
- a)

- b)

- c)

- d)None of these
Correct answer is option 'C'. Can you explain this answer?
The transfer function C(s)/R(s) for the system described by the block diagram shown below is given by:
a)
b)
c)
d)
None of these
|
|
Rhea Reddy answered |
On shifting the take-off point beyond block G, we have the reduced block diagram as shown below:
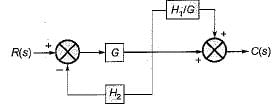
On further reducing the above block diagram, we get the block diagram as shown below.
On further reducing the above block diagram, we get the block diagram as shown below.


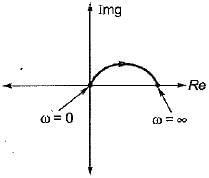
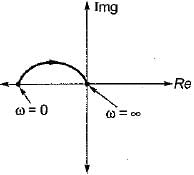
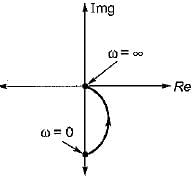
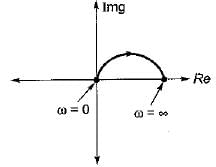
The inverse polar plot of the open loop transfer function, 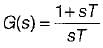 will be re presented by
- a)
- b)
- c)
- d)
Correct answer is option 'A'. Can you explain this answer?
The inverse polar plot of the open loop transfer function, will be re presented by
will be re presented bya)
b)
c)
d)
|
|
Lavanya Menon answered |
Given, G(s) = (1+sT)/(sT)
The inverse polar plot of G(jω) is the polar plot of 1/G(jω)
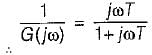
Thus,
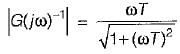
and
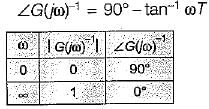
Hence, inverse polar plot will be as show below,
The inverse polar plot of G(jω) is the polar plot of 1/G(jω)
Thus,
and
Hence, inverse polar plot will be as show below,
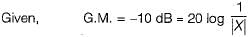
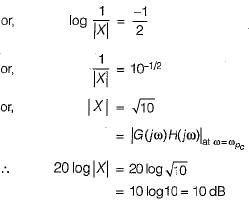
Consider a feedback system with gain margin of about 30. At what point does Nyquist plot crosses negative real axis?- a)-3
- b)-0.3
- c)-30
- d)-0.03
Correct answer is option 'B'. Can you explain this answer?
Consider a feedback system with gain margin of about 30. At what point does Nyquist plot crosses negative real axis?
a)
-3
b)
-0.3
c)
-30
d)
-0.03
|
|
Sharmila Kulkarni answered |
Nyquist Plot and Gain Margin
Nyquist plot is a graphical representation of a system's frequency response. It is used to analyze the stability of a feedback system. The Nyquist plot is a plot of the frequency response of a system in the complex plane. The gain margin of a feedback system is the amount of gain that the system can handle before it becomes unstable. It is defined as the amount of gain that causes the Nyquist plot to cross the negative real axis.
Answer Explanation
Given that the gain margin of the feedback system is about 30, we can determine at what point the Nyquist plot crosses the negative real axis by using the Nyquist stability criterion. The Nyquist stability criterion states that the number of encirclements of the -1 point in the Nyquist plot is equal to the number of unstable poles of the closed-loop transfer function.
Since the gain margin is about 30, the Nyquist plot will cross the negative real axis at a point where the magnitude of the complex number is equal to 1/30. This is because the gain margin is the reciprocal of the point where the Nyquist plot crosses the negative real axis. Therefore, the Nyquist plot will cross the negative real axis at a frequency of -0.3, which corresponds to a magnitude of 1/30.
Thus, the correct answer is option B, -0.3.
The compensator required to improve the steady state response of a system is- a)Lag
- b)Lead
- c)Lag-lead
- d)Zero
Correct answer is option 'A'. Can you explain this answer?
The compensator required to improve the steady state response of a system is
a)
Lag
b)
Lead
c)
Lag-lead
d)
Zero

|
Cstoppers Instructors answered |
Lag compensator:
Transfer function:
Transfer function:
If it is in the form of  then a < 1
then a < 1If it is in the form of  then a > b
Maximum phase lag frequency:
ωm = 1√Ta
Maximum phase lag::
then a > bMaximum phase lag frequency:
ωm = 1√Ta
Maximum phase lag::
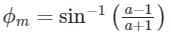
ϕm is negative
Pole zero plot:
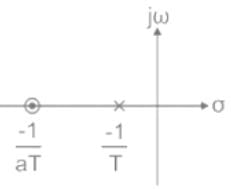
The pole is nearer to the origin.
Filter: It is a low pass filter (LPF)
Effect on the system:
Filter: It is a low pass filter (LPF)
Effect on the system:
- Rise time and settling time increases and Bandwidth decreases
- The transient response becomes slower
- The steady-state response is improved
- Stability decreases
The most commonly used input signal(s) in control system is/are- a)ramp or velocity function
- b)step function
- c)accelerating function
- d)all of the above
Correct answer is option 'B'. Can you explain this answer?
The most commonly used input signal(s) in control system is/are
a)
ramp or velocity function
b)
step function
c)
accelerating function
d)
all of the above
|
|
Sarita Yadav answered |
A step function is commonly used as a input signal in a control system because:
- IF we go through first order system, here we calculate steady-state error by providing input function then we got zero steady-state error.
- Actually in step function, output follows input always that means steady error is minimum.
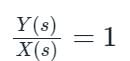
For the system shown in the figure, Y(s)/X(s) = _________. (Answer in integer )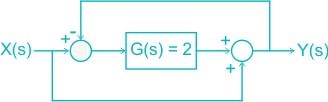
Correct answer is between '0.95,1.05'. Can you explain this answer?
For the system shown in the figure, Y(s)/X(s) = _________. (Answer in integer )
|
|
Cstoppers Instructors answered |
The circuit is redrawn as shown:
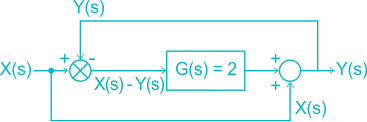
[X(s) – Y(s)] G(s) + X(s) = Y(s)
Given G(s) = 2
(X(s) – Y(s)) 2 + X(s) = Y(s)
= 2 X(s) + X(s) = Y(s) + 2Y(s)
= 3 X(s) = 3 Y(s)
Assuming zero initial condition, the response y(t) of the system given below to a unit step input u(t) is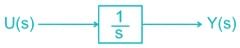
- a)u(t)
- b)t.u(t)
- c)t2/2.u(t)
- d)e-tu(t)
Correct answer is option 'B'. Can you explain this answer?
Assuming zero initial condition, the response y(t) of the system given below to a unit step input u(t) is
a)
u(t)
b)
t.u(t)
c)
t2/2.u(t)
d)
e-tu(t)
|
|
Luminary Institute answered |
Laplace transform of u(t) is given by
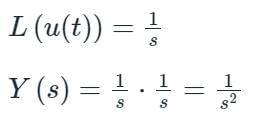
Taking Inverse Laplace transform
y(t) = t.u(t)
Which of the following is not true regarding an open loop control system?- a)Highly affected by non-linearities.
- b)Open loop systems are inaccurate.
- c)These are not reliable.
- d)The effect of parameter variation and internal noise is less.
Correct answer is option 'D'. Can you explain this answer?
Which of the following is not true regarding an open loop control system?
a)
Highly affected by non-linearities.
b)
Open loop systems are inaccurate.
c)
These are not reliable.
d)
The effect of parameter variation and internal noise is less.
|
|
Rahul Banerjee answered |
The effect of parameter variation and internal noise is more in an open loop system.
Consider the following statements related to Routh-Hurwitz criterion of determining the stability of a system:
1. It is applicable if the characteristic equation has real coefficients, complex ternrivS or exponential functions of s.
2. The criterion can be applied to any stability boundaries in complex plane, such as the unit circle in the z-plane.
3. The number of changes of signs in the elements of the first column equals the number of roots with negative real parts.
Which of these statements is/are not correct?- a)2 and 3 oniy .
- b)1, 2 and 3
- c)1 only
- d)1 and 2 only
Correct answer is option 'B'. Can you explain this answer?
Consider the following statements related to Routh-Hurwitz criterion of determining the stability of a system:
1. It is applicable if the characteristic equation has real coefficients, complex ternrivS or exponential functions of s.
2. The criterion can be applied to any stability boundaries in complex plane, such as the unit circle in the z-plane.
3. The number of changes of signs in the elements of the first column equals the number of roots with negative real parts.
Which of these statements is/are not correct?
a)
2 and 3 oniy .
b)
1, 2 and 3
c)
1 only
d)
1 and 2 only
|
|
Athul Banerjee answered |
• Routh-Hurwitz criterion is not applicable if characteristic equation has coefficients which are exponential or complex.
• It is not applied in z-piane because z-piane having unit circle is the stability boundary of discrete-data system.
• Statement-3 is also false because no. of sign change in 1st column of Routh’s array indicates the number of roots with positive real part or roots lying in RH s-plane.
• It is not applied in z-piane because z-piane having unit circle is the stability boundary of discrete-data system.
• Statement-3 is also false because no. of sign change in 1st column of Routh’s array indicates the number of roots with positive real part or roots lying in RH s-plane.
Consider the following statements regarding a control system:(a) Addition of pole to left half of s-plane reduce the relative stability(b) Addition of zero to left half of s-plane increase the damping factor(c) Integral controller reduces the steady state error(d) Derivate controller cannot be used in isolationWhich of the above statements are true?- a)(a) & (c) only
- b)(b) & (d) only
- c)(a), (b), (d) only
- d)All (a), (b), (c), (d)
Correct answer is option 'D'. Can you explain this answer?
Consider the following statements regarding a control system:
(a) Addition of pole to left half of s-plane reduce the relative stability
(b) Addition of zero to left half of s-plane increase the damping factor
(c) Integral controller reduces the steady state error
(d) Derivate controller cannot be used in isolation
Which of the above statements are true?
a)
(a) & (c) only
b)
(b) & (d) only
c)
(a), (b), (d) only
d)
All (a), (b), (c), (d)
|
|
Pooja Patel answered |
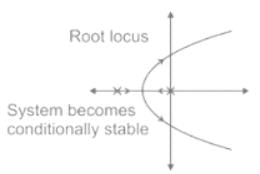
(a) Addition of pole reduces stability
Consider system =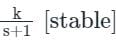
Adding Pole [say at origin]

(b) Addition of zero increase ξ
Consider system with Transfer function
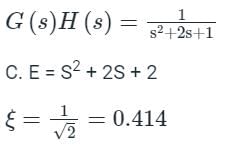
Now add one zero to left half say at -2
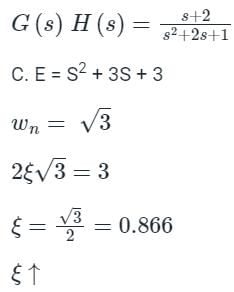
(c) Integral controller adds one pole at origin
Now add one zero to left half say at -2
(c) Integral controller adds one pole at origin
As type of system increase steady state error reduce
(d) Derivative controllers are not used Alone because with sudden changes in the system the derivative controller will compensate the output fast therefore in long term effects the isolated controller will produce huge steady state errors.
The characteristic equation of a second order discrete-data system is given by:
F(z) = z2+ z+ 0.25 = 0
The above system is- a)stable
- b)marginally stable
- c)unstable
- d)asymptotically stable
Correct answer is option 'A'. Can you explain this answer?
The characteristic equation of a second order discrete-data system is given by:
F(z) = z2+ z+ 0.25 = 0
The above system is
F(z) = z2+ z+ 0.25 = 0
The above system is
a)
stable
b)
marginally stable
c)
unstable
d)
asymptotically stable
|
|
Nilesh Joshi answered |
For a second order discrete- data system given by:
F(z) = a2z2 + a1z + a0 = 0
to be stable, the necessary and sufficient conditions are:
F(1) > 0
F(-1) > 0 and |a0| < a2
Here, F(z) = z2 + z + 0.25
So, = 0.25, a1 = 1, a2 = 1
Thus, F(1) - 12+ 1 + 0.25 = 2.25 > 0
F(-1) = 1 -1 + 0.25 = 0.25 > 0
and la0l = 0.25 < a2 = 1 Since ail the conditions are satisfied, therefore given system is stable.
The characteristic equation of a closed loop control system is given by:
s2 + 2s +10 + K(s2 + 6s + 10) = 0
The angle of asymptotes for the root loci for K > 0 are given by- a)180°, 360°
- b)90°, 270°
- c)90°, 180°
- d)none of these
Correct answer is option 'D'. Can you explain this answer?
The characteristic equation of a closed loop control system is given by:
s2 + 2s +10 + K(s2 + 6s + 10) = 0
The angle of asymptotes for the root loci for K > 0 are given by
s2 + 2s +10 + K(s2 + 6s + 10) = 0
The angle of asymptotes for the root loci for K > 0 are given by
a)
180°, 360°
b)
90°, 270°
c)
90°, 180°
d)
none of these
|
|
Saumya Basak answered |
Given, s2 + 2s + 10 + K(s2 + 6s + 10) = 0
or,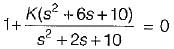
or, 1 + G(s)H(s) = 0
Thus, G(s)H(s) =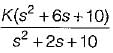
Here, number of open loop poles, P = 2. Number of open loop zero, Z = 2
∴ P - Z = 0.
Angle of asymptotes are given by:
Sines P - Z= 0, therefore there are no angle of asymptotes for the root locus of the given system.
or,
or, 1 + G(s)H(s) = 0
Thus, G(s)H(s) =
Here, number of open loop poles, P = 2. Number of open loop zero, Z = 2
∴ P - Z = 0.
Angle of asymptotes are given by:
Sines P - Z= 0, therefore there are no angle of asymptotes for the root locus of the given system.
Which one of the following options correctly describes the locations of the roots of the equation s4 + s2 + 1 = 0 on the complex plane?- a)Four left half plane (LHP) roots
- b)One right half plane (RHP) root, one LHP root and two roots on the imaginary axis
- c)Two RHP roots and two LHP roots
- d)All four roots are on the imaginary axis
Correct answer is option 'C'. Can you explain this answer?
Which one of the following options correctly describes the locations of the roots of the equation s4 + s2 + 1 = 0 on the complex plane?
a)
Four left half plane (LHP) roots
b)
One right half plane (RHP) root, one LHP root and two roots on the imaginary axis
c)
Two RHP roots and two LHP roots
d)
All four roots are on the imaginary axis
|
|
Shlok Sengupta answered |
The roots of the equation s^4 + s^2 + 1 = 0 on the complex plane can be described as follows:
Explanation:
To find the roots of the equation s^4 + s^2 + 1 = 0, we can rearrange it as follows:
s^4 + s^2 + 1 = 0
(s^2 + 1)^2 - s^2 = 0
(s^2 + 1 + s)(s^2 + 1 - s) = 0
This equation can be further simplified into two quadratic equations:
s^2 + 1 + s = 0 (Equation 1)
s^2 + 1 - s = 0 (Equation 2)
Roots of Equation 1:
To find the roots of Equation 1, we can use the quadratic formula:
s = (-b ± √(b^2 - 4ac)) / (2a)
For Equation 1, a = 1, b = 1, and c = 1. Substituting these values into the quadratic formula, we get:
s = (-1 ± √(1 - 4(1)(1))) / (2(1))
s = (-1 ± √(-3)) / 2
Since the discriminant (√(-3)) is imaginary, the roots of Equation 1 will also be imaginary. Therefore, Equation 1 has two roots on the imaginary axis.
Roots of Equation 2:
Similarly, using the quadratic formula for Equation 2, we get:
s = (1 ± √(1 - 4(1)(1))) / (2(1))
s = (1 ± √(-3)) / 2
Again, since the discriminant (√(-3)) is imaginary, the roots of Equation 2 will also be imaginary. Therefore, Equation 2 has two roots on the imaginary axis.
Conclusion:
In total, the equation s^4 + s^2 + 1 = 0 has four roots on the complex plane. Two of these roots are on the right half plane (RHP) and the other two roots are on the left half plane (LHP).
Which of the following is not true regarding addition of a pole to the forward-path transfer function?- a)Maximum overshoot of the closed-loop system is increased.
- b)Rise time of the step response is increased.
- c)Stability of the system is increased.
- d)Bandwidth of the system is reduced.
Correct answer is option 'C'. Can you explain this answer?
Which of the following is not true regarding addition of a pole to the forward-path transfer function?
a)
Maximum overshoot of the closed-loop system is increased.
b)
Rise time of the step response is increased.
c)
Stability of the system is increased.
d)
Bandwidth of the system is reduced.
|
|
Sandeep Chatterjee answered |
With addition of a pole to the forward-path transfer function, bandwidth will reduce.
Since therefore rise time will increase.
Since rise time therefore stability will decrease.
Since
therefore rise time will increase.Since rise time
therefore stability will decrease.Consider the characteristic equation of a control system given by s3 + (K + 0.5)s2 + 4Ks + 50 = 0. Find the value of the frequency if the system has sustained oscillations for a given K.- a)ω = 50 rad/sec
- b)ω = 25 rad/sec
- c)ω = 3.63 rad/sec
- d)ω = 4.63 rad/sec
Correct answer is option 'C'. Can you explain this answer?
Consider the characteristic equation of a control system given by s3 + (K + 0.5)s2 + 4Ks + 50 = 0. Find the value of the frequency if the system has sustained oscillations for a given K.
a)
ω = 50 rad/sec
b)
ω = 25 rad/sec
c)
ω = 3.63 rad/sec
d)
ω = 4.63 rad/sec
|
|
Adarsh Chauhan answered |
To find the value of the frequency for sustained oscillations, we need to find the roots of the characteristic equation. The characteristic equation is given by:
s^3 + (0.5K)s^2 + 4Ks + 50 = 0
To find the roots, we can use the Routh-Hurwitz stability criterion. The Routh-Hurwitz table for this characteristic equation is as follows:
1 4K
0.5K 50
(-0.5K*50)/(4K) = -12.5K
From the Routh-Hurwitz table, we can see that for sustained oscillations to occur, we must have at least one sign change in the first column of the table. In this case, since the first column has two positive values (1 and 0.5K), there are no sign changes.
Therefore, the system does not have sustained oscillations for any value of K.
Introduction of feedback to a system- a)increases the stability
- b)decreases the stability
- c)has no effect on stability
- d)none of the above
Correct answer is option 'D'. Can you explain this answer?
Introduction of feedback to a system
a)
increases the stability
b)
decreases the stability
c)
has no effect on stability
d)
none of the above
|
|
Pranjal Basu answered |
Introduction of feed back to a system will increase the stability if negative feedback is introduced while it will reduce the stability if positive feedback is introduced.
The characteristic equation of a system is given by s3 + s + 2 - 0.What are the number of roots in the right half s-plane and on the jω-axis respectively?- a)3, 0
- b)2, 1
- c)1,2
- d)2,0
Correct answer is option 'D'. Can you explain this answer?
The characteristic equation of a system is given by s3 + s + 2 - 0.
What are the number of roots in the right half s-plane and on the jω-axis respectively?
a)
3, 0
b)
2, 1
c)
1,2
d)
2,0
|
|
Anushka Khanna answered |
Routh’s array is formed as shown below,

Replacing ε in place of 0 in 1st column, we have:
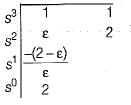
To check for sign change:
Thus, there are two sign changes in 1st column of Routh’s array (+0 to -∞ and -∞ to + 2).
Hence, number of roots in RH s-plane = 2.
Number of roots in LH s-plane = 1.
Number of roots on the jω-axis = 0.
Replacing ε in place of 0 in 1st column, we have:
To check for sign change:
Thus, there are two sign changes in 1st column of Routh’s array (+0 to -∞ and -∞ to + 2).
Hence, number of roots in RH s-plane = 2.
Number of roots in LH s-plane = 1.
Number of roots on the jω-axis = 0.
Due to an addition of pole at origin, the polar plot gets shifted by ___ at ω = 0?- a)-45°
- b)-60°
- c)-90°
- d)-180°
Correct answer is option 'C'. Can you explain this answer?
Due to an addition of pole at origin, the polar plot gets shifted by ___ at ω = 0?
a)
-45°
b)
-60°
c)
-90°
d)
-180°
|
|
Ameya Nambiar answered |
Introduction
In control systems and signal processing, the addition of poles in the transfer function can significantly affect the behavior of the system. A pole at the origin alters the phase response of the system, especially at low frequencies.
Effect of a Pole at the Origin
- A pole at the origin contributes a phase lag of 90 degrees to the system's response.
- This means that for every pole added at the origin, the phase of the output signal will lag behind the input signal by 90 degrees.
Polar Plot Shift
- In a polar plot, the phase shift impacts the angle of the plot as a function of frequency (ω).
- At ω = 0, the introduction of a pole at the origin will shift the plot downwards by 90 degrees.
Conclusion
- Therefore, when a pole is added at the origin, the polar plot is effectively shifted by -90 degrees at ω = 0.
- This shift is crucial for understanding system stability and frequency response.
The correct answer is option C: -90°.
Which of the following is not correct with respect to a phase-lead compensation network?- a)It increases system bandwidth
- b)It increases gain at higher frequencies
- c)It is used when fast transient response is required
- d)It is used when decrease rapidly near crossover frequency
Correct answer is option 'D'. Can you explain this answer?
Which of the following is not correct with respect to a phase-lead compensation network?
a)
It increases system bandwidth
b)
It increases gain at higher frequencies
c)
It is used when fast transient response is required
d)
It is used when decrease rapidly near crossover frequency
|
|
Shivam Das answered |
Understanding Phase-Lead Compensation
Phase-lead compensation is a technique used in control systems to improve stability and performance. Let's analyze why option 'D' is incorrect.
Key Characteristics of Phase-Lead Compensation:
- Increases System Bandwidth:
- Phase-lead compensation increases the bandwidth of the system. This allows the system to respond more quickly to changes in input.
- Increases Gain at Higher Frequencies:
- It provides an increase in gain at higher frequencies, which enhances the system's ability to track fast changes in input signals.
- Fast Transient Response:
- This compensation technique is particularly beneficial when fast transient responses are desired. It reduces the settling time and improves the overall responsiveness of the system.
Why Option 'D' is Incorrect:
- Decrease Rapidly Near Crossover Frequency:
- This statement is misleading. In a phase-lead compensation network, the phase margin is increased, and the gain does not decrease rapidly near the crossover frequency. Instead, the network is designed to maintain or even enhance the gain within the crossover region, leading to a more stable and responsive system.
Conclusion:
In summary, phase-lead compensation is characterized by its ability to enhance system performance. It does not lead to a rapid decrease in gain near the crossover frequency, making option 'D' the incorrect statement.
Assertion (A): Introduction of phase lag network in forward path increases the phase shift.
Reason (R): A phase lag network has pole nearer to the imaginary axis as compared to zero.- a)Both A and R are true and R is a correct explanation of A.
- b)Both A and R are true but R is not a correct explanation of A.
- c)A is true but R is false.
- d)A is false but R is true.
Correct answer is option 'D'. Can you explain this answer?
Assertion (A): Introduction of phase lag network in forward path increases the phase shift.
Reason (R): A phase lag network has pole nearer to the imaginary axis as compared to zero.
Reason (R): A phase lag network has pole nearer to the imaginary axis as compared to zero.
a)
Both A and R are true and R is a correct explanation of A.
b)
Both A and R are true but R is not a correct explanation of A.
c)
A is true but R is false.
d)
A is false but R is true.
|
|
Mira Mukherjee answered |
Understanding Phase Lag Networks
In control systems, the behavior of phase lag networks is crucial for understanding their effects on system stability and response.
Assertion (A)
- The assertion claims that introducing a phase lag network in the forward path increases the phase shift.
- This statement is false because a phase lag network actually decreases the phase shift in a system.
- Phase lag networks introduce a delay in the response, leading to a reduction in the overall phase.
Reason (R)
- The reason states that a phase lag network has a pole nearer to the imaginary axis compared to a zero.
- This statement is true as phase lag networks are characterized by having a specific configuration of poles and zeros that influences the phase response.
- The pole being closer to the imaginary axis signifies that it contributes less to the phase shift than a zero would, validating the nature of phase lag networks.
Conclusion
- Since Assertion (A) is false and Reason (R) is true, the correct option is D: "A is false but R is true."
- Understanding these concepts helps in designing systems with desired stability and performance characteristics.
Key Takeaway
- In control systems, it is essential to recognize the implications of phase lag networks on phase shifts to ensure effective system design and analysis.
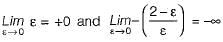
The time required for the response curve to reach and stay within the specified 2-5% of final value is referred to as :- a)Peak time
- b)Rise time
- c)Settling time
- d)Peak overshoot time
Correct answer is option 'C'. Can you explain this answer?
The time required for the response curve to reach and stay within the specified 2-5% of final value is referred to as :
a)
Peak time
b)
Rise time
c)
Settling time
d)
Peak overshoot time

|
Imtiaz Ahmad answered |
The correct answer is option 3): Settling time
Concept:
- The time that is required for the response to reach and stay within the specified range (2% to 5%) of its final value is called the settling time.
- Peak Time. It is the time required for the response to reach the peak value for the first time. It is denoted by tp.
- The time is defined as "the time required for the response to rise from x% to y% of its final value", with 0% to 100% rise time common for underdamped second order systems, 5% to 95% for critically damped and 10% to 90% for overdamped ones.
- Peak time (tp) is simply the time required by response to reach its first peak i.e. the peak of first cycle of oscillation, or first overshoot. On differentiating the expression of c(t)
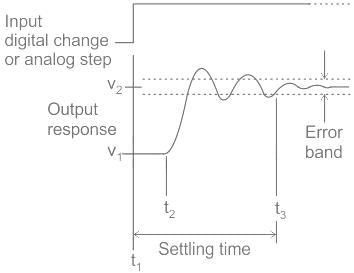
The peak overshoot of step-input response of an underdamped second-order system is an indication of- a)rise time of the system
- b)settling time of the system
- c)damping ratio of the system
- d)natural frequency of the system
Correct answer is option 'C'. Can you explain this answer?
The peak overshoot of step-input response of an underdamped second-order system is an indication of
a)
rise time of the system
b)
settling time of the system
c)
damping ratio of the system
d)
natural frequency of the system
|
|
Avik Iyer answered |
If damping of system increases, peak overshoot Mp decreases and vice-versa.
Chapter doubts & questions for Control Systems - GATE ECE (Electronics) Mock Test Series 2026 2025 is part of Electronics and Communication Engineering (ECE) exam preparation. The chapters have been prepared according to the Electronics and Communication Engineering (ECE) exam syllabus. The Chapter doubts & questions, notes, tests & MCQs are made for Electronics and Communication Engineering (ECE) 2025 Exam. Find important definitions, questions, notes, meanings, examples, exercises, MCQs and online tests here.
Chapter doubts & questions of Control Systems - GATE ECE (Electronics) Mock Test Series 2026 in English & Hindi are available as part of Electronics and Communication Engineering (ECE) exam.
Download more important topics, notes, lectures and mock test series for Electronics and Communication Engineering (ECE) Exam by signing up for free.
GATE ECE (Electronics) Mock Test Series 2026
26 docs|263 tests
|
|
© EduRev
|
Education Revolution
|


|


Signup to see your scores
go up within 7 days!
Access 1000+ FREE Docs, Videos and Tests
Takes less than 10 seconds to signup