


All Exams >
UPSC >
Geography for UPSC CSE >
All Questions
All questions of Population for UPSC CSE Exam
As per the provisional figures of 2011 Census of India, which one of the following States has the highest child sex ratio?- a) Chhattisgarh
- b) Haryana
- c) Uttar Pradesh
- d) Punjab
Correct answer is option 'A'. Can you explain this answer?
As per the provisional figures of 2011 Census of India, which one of the following States has the highest child sex ratio?
a)
Chhattisgarh
b)
Haryana
c)
Uttar Pradesh
d)
Punjab

|
Freedom Institute answered |
Chhattisgarh with sex ratio of 960 and Haryana with 834 are high are lowest among these four states.

Which one of the following states of India has the highest urban density?- a) Maharashtra
- b) Punjab
- c) Tamil Nadu
- d) West Bengal
Correct answer is option 'C'. Can you explain this answer?
Which one of the following states of India has the highest urban density?
a)
Maharashtra
b)
Punjab
c)
Tamil Nadu
d)
West Bengal
|
|
Freedom Institute answered |
Tamil nadu with 48.45% of urban population leads the country w.r.t urban population density.
Consider the following statements and select the correct answer from the codes given below:Assertion (A): The growth rate of population in developingcountries is higher than that of developedcountries.Reason (R): Low level of economic development leads to hightotal fertility rate.Codes:- a) Both A and R are true and R is the correct explanation of A.
- b) Both A and R are true, but R is not the correct explanation of A.
- c) A is true, but R is false.
- d) A is false, but R is true.
Correct answer is option 'A'. Can you explain this answer?
Consider the following statements and select the correct answer from the codes given below:
Assertion (A): The growth rate of population in developing
countries is higher than that of developed
countries.
Reason (R): Low level of economic development leads to high
total fertility rate.
Codes:
a)
Both A and R are true and R is the correct explanation of A.
b)
Both A and R are true, but R is not the correct explanation of A.
c)
A is true, but R is false.
d)
A is false, but R is true.
|
|
Debolina Yadav answered |
Assertion and Reason Explanation:
Low level of economic development is the key reason behind the high total fertility rate in developing countries. This is due to several factors such as lack of access to family planning services, cultural beliefs favoring large families, lack of education and awareness about contraception, and limited economic opportunities for women. As a result, the population growth rate in developing countries tends to be higher than in developed countries.
Analysis of the Statements:
Assertion (A): The growth rate of population in developing countries is higher than that of developed countries.
Reason (R): Low level of economic development leads to high total fertility rate.
Evaluation of the Codes:
- Option A: Both Assertion and Reason are true, and the Reason is the correct explanation of the Assertion. This is the correct choice because the low economic development directly contributes to the high total fertility rate, leading to a higher population growth rate in developing countries compared to developed nations.
When 0-14 and 15-44 age groups population of a country of a country is almost identical, the growth of population would be called—- a) Rapid growth
- b) Slow growth
- c) Zero growth
- d) Negative growth
Correct answer is option 'C'. Can you explain this answer?
When 0-14 and 15-44 age groups population of a country of a country is almost identical, the growth of population would be called—
a)
Rapid growth
b)
Slow growth
c)
Zero growth
d)
Negative growth
|
|
Snehal Kumar answered |
When the population of the 0-14 age group and the 15-44 age group in a country is almost identical, the growth of population is called zero growth. This means that the number of individuals entering the reproductive age group (15-44) is equal to the number of individuals leaving this age group due to aging.
Zero population growth occurs when the birth rate equals the death rate, resulting in no net increase in population size. This can happen when the fertility rate is low and there is a balance between births and deaths.
Let's understand this concept in more detail:
1. Definition of Zero Growth:
Zero population growth refers to a situation where the number of births in a population equals the number of deaths, resulting in no overall increase or decrease in population size. It indicates a stable population size over time.
2. Factors Contributing to Zero Growth:
a. Fertility Rate: When the fertility rate (average number of children born per woman) is at replacement level, which is around 2.1, the population remains stable. This means that each woman, on average, is having enough children to replace herself and her partner in the next generation.
b. Mortality Rate: Similarly, when the mortality rate is low and individuals are living longer, the number of deaths does not significantly impact population size.
3. Age Structure and Zero Growth:
The age structure of a population plays a crucial role in determining its growth rate. When the population has a similar proportion of individuals in the reproductive age group (15-44) as in the younger age group (0-14), it indicates a balance between births and deaths. This leads to zero population growth.
4. Implications of Zero Growth:
a. Economic Implications: Zero population growth can have economic implications as it affects the labor force and dependency ratio. With an equal number of births and deaths, there is limited growth in the labor force, which may impact productivity and economic development.
b. Social Implications: Zero growth can also have social implications, such as an aging population and potential strain on healthcare and social security systems.
In conclusion, when the 0-14 and 15-44 age groups of a country's population are almost identical, it signifies zero growth. This indicates a balance between births and deaths, resulting in a stable population size over time.
The rapid growth phase of Indian population was lying between which of the following time periods?- a) 1901 – 1921
- b) 1921 – 1951
- c) 1951 – 1981
- d) 1981 – 2001
Correct answer is option 'C'. Can you explain this answer?
The rapid growth phase of Indian population was lying between which of the following time periods?
a)
1901 – 1921
b)
1921 – 1951
c)
1951 – 1981
d)
1981 – 2001

|
Aarya Sharma answered |
The correct answer is option 'C' - 1951 to 1981.
Explanation:
The rapid growth phase of Indian population refers to the period when the population of India experienced a significant increase at a fast pace. This growth phase can be attributed to various factors such as improvements in healthcare, reduction in mortality rates, and better living conditions.
Here is a detailed explanation of each time period mentioned in the options:
a) 1901 - 1921:
During this period, India was under British rule, and the population growth rate was relatively slow. The growth rate was affected by various factors such as famines, epidemics, and poor healthcare facilities.
b) 1921 - 1951:
This period witnessed a gradual increase in population, but the growth rate was still not very high. The country was going through significant political and social changes, including the struggle for independence from British rule.
c) 1951 - 1981:
This was the period of rapid population growth in India. Several factors contributed to this growth phase. Firstly, there were advancements in medical science and healthcare facilities, leading to a significant decline in mortality rates. This resulted in a higher number of people surviving and reaching reproductive age. Additionally, there were improvements in living conditions, access to education, and better employment opportunities. This led to an increase in the average life expectancy and higher fertility rates.
d) 1981 - 2001:
While the population growth rate remained high during this period, it started to show signs of stabilization. The government implemented various family planning programs and awareness campaigns to control population growth. The focus shifted towards population control measures and creating awareness about the benefits of smaller families.
Overall, the rapid growth phase of the Indian population occurred between 1951 and 1981, during which the population of the country experienced a significant increase due to improvements in healthcare, living conditions, and other socio-economic factors.
Arrange the following countries of South Asia in descending order of their population density and use the codes to select the correct answer:1. India2. Bangladesh3. Pakistan4. SrilankaCodes:- a) 1, 3, 4, 2
- b) 2, 1, 3, 4
- c) 2, 1, 4, 3
- d) 4, 2, 1, 3
Correct answer is option 'C'. Can you explain this answer?
Arrange the following countries of South Asia in descending order of their population density and use the codes to select the correct answer:
1. India
2. Bangladesh
3. Pakistan
4. Srilanka
Codes:
a)
1, 3, 4, 2
b)
2, 1, 3, 4
c)
2, 1, 4, 3
d)
4, 2, 1, 3
|
|
Kajal Chopra answered |
Population Density of South Asian Countries:
India has the highest population density among the South Asian countries, followed by Bangladesh, Pakistan, and Sri Lanka.
Explanation:
- India: India has a population density of approximately 420 people per square kilometer, making it the most densely populated country in South Asia.
- Bangladesh: Bangladesh comes next with a population density of around 1,265 people per square kilometer, making it the second most densely populated country in the region.
- Pakistan: Pakistan has a population density of about 260 people per square kilometer, placing it third in terms of population density in South Asia.
- Sri Lanka: Sri Lanka has a population density of roughly 341 people per square kilometer, making it the least densely populated country among the four mentioned.
Therefore, the correct arrangement of these countries in descending order of population density is 2, 1, 4, 3 (Bangladesh, India, Sri Lanka, Pakistan).
Which one of the following terms denotes the net population increase of towns and cities?- a) Urban Growth
- b) Population Growth
- c) Urbanisation
- d) Urban Area
Correct answer is option 'A'. Can you explain this answer?
Which one of the following terms denotes the net population increase of towns and cities?
a)
Urban Growth
b)
Population Growth
c)
Urbanisation
d)
Urban Area
|
|
Freedom Institute answered |
Urban growth denotes the net population increase of towns and cities.
Which of the following tribes of Uttarakhand is mainly involved in the sheep rearing?- a) Bhotia
- b) Raji
- c) Tharu
- d) Boksha
Correct answer is option 'A'. Can you explain this answer?
Which of the following tribes of Uttarakhand is mainly involved in the sheep rearing?
a)
Bhotia
b)
Raji
c)
Tharu
d)
Boksha
|
|
Freedom Institute answered |
Bhotia tribe of uttarakhand is mainly involved in the sheep rearing.
A social institution called Dhumkuria belongs to which tribe?- a) Oraon
- b) Ho
- c) Gond
- d) Kol
Correct answer is option 'A'. Can you explain this answer?
A social institution called Dhumkuria belongs to which tribe?
a)
Oraon
b)
Ho
c)
Gond
d)
Kol
|
|
Sagarika Pillai answered |
Dhumkuria Social Institution of Oraon Tribe
Explanation:
The social institution called Dhumkuria belongs to the Oraon tribe.
Who are the Oraon Tribe?
- The Oraon tribe is one of the largest tribal communities in India.
- They are primarily found in the states of Jharkhand, Chhattisgarh, Bihar, Odisha, and West Bengal.
Dhumkuria Social Institution
- Dhumkuria is a significant social institution among the Oraon tribe.
- It plays a crucial role in their social and cultural practices.
- This institution is involved in various community events, rituals, and ceremonies.
- It also serves as a platform for resolving disputes and maintaining social harmony within the tribe.
Significance of Dhumkuria in Oraon Tribe
- Dhumkuria acts as a bonding force among the members of the Oraon tribe.
- It helps in preserving their traditions, customs, and values.
- The institution fosters a sense of unity and cooperation among the tribe members.
- It also serves as a mechanism for social control and governance within the community.
In conclusion, the social institution of Dhumkuria holds immense cultural and social significance for the Oraon tribe, playing a vital role in maintaining their identity and heritage.
Consider the following statements and select the correct answer from the codes given:
Assertion (A): China is the second most populous country of the world.
Reason (R): Its density of population is much lower than that of India.
Codes:
- a)Both A and R are true and R is the correct explanation of A.
- b)Both A and R are true, but R is not the correct explanation of A
- c)A is true, but R is false.
- d)A is false, but R is true.
Correct answer is option 'B'. Can you explain this answer?
Consider the following statements and select the correct answer from the codes given:
Assertion (A): China is the second most populous country of the world.
Reason (R): Its density of population is much lower than that of India.
Codes:
a)
Both A and R are true and R is the correct explanation of A.
b)
Both A and R are true, but R is not the correct explanation of A
c)
A is true, but R is false.
d)
A is false, but R is true.
|
|
Anjana Dey answered |
Assertion (A): China is the second most populous country of the world.
- This statement is true. As of the latest data, India holds the title of the most populous country, while China ranks second.
Reason (R): Its density of population is much lower than that of India.
- This statement is also true. Population density is calculated as the number of people per unit area. While China has a massive population, its land area is also vast, leading to a lower population density compared to India, which has a higher number of people living in a smaller area.
Analysis of Options:
- Option a: Both A and R are true and R is the correct explanation of A.
- This is not entirely accurate because while both statements are true, R does not explain A. The population rank is based on total numbers, not density.
- Option b: Both A and R are true, but R is not the correct explanation of A.
- This is the correct choice. A is about the population ranking, while R discusses density, which is a different aspect.
- Option c: A is true, but R is false.
- This is incorrect since both A and R are true.
- Option d: A is false, but R is true.
- This is incorrect as A is true.
Conclusion:
- The correct answer is Option B because both statements are true independently, but the reason does not explain the assertion regarding population ranking.
Which of the following is/are the stage(s) of demographic transition?1. High death rate and birth rate, low growth rate.2. Rapid decline in death rate, continued low birth rate, very low growth rate.3. Rapid decline in birth rate, continued decline in death rate4. Low death rate and birth rate, low growth rate.Select the correct answer using the codes given below- a) Only 1
- b) 1, 2 and 3
- c) 3 and 4
- d) 1 and 4
Correct answer is option 'D'. Can you explain this answer?
Which of the following is/are the stage(s) of demographic transition?
1. High death rate and birth rate, low growth rate.
2. Rapid decline in death rate, continued low birth rate, very low growth rate.
3. Rapid decline in birth rate, continued decline in death rate
4. Low death rate and birth rate, low growth rate.
Select the correct answer using the codes given below
a)
Only 1
b)
1, 2 and 3
c)
3 and 4
d)
1 and 4
|
|
Nilesh Patel answered |
- Demographic transition (DT) refers to the transition from high birth and death rates to lower birth and death rates as a country or region develops from a pre-industrial to an industrialized economic system.
- The theory was proposed in 1929 by the American demographer Warren Thompson, who observed changes, or transitions, in birth and death rates in industrialized societies over the previous 200 years.
- Most developed countries have completed the demographic transition and have low birth rates; most developing countries are in the process of this transition.
The term ‘demographic gap’ signifies the difference- a) in sex ratio
- b) in age
- c) in child / woman ratio
- d) between the birth and the death rate
Correct answer is option 'D'. Can you explain this answer?
The term ‘demographic gap’ signifies the difference
a)
in sex ratio
b)
in age
c)
in child / woman ratio
d)
between the birth and the death rate
|
|
Freedom Institute answered |
Demographic gap is the difference between birth rate and death rate that develops when a country undergoes demographic transition.
Consider the following statements and select the correct answerby using the codes given below:Assertion (A): There has been some decline in the growth rate ofIndia’s population in recent years.Reason (R): According to 2011 census, about 3/4 of Indian’sthe population is literate.Codes:- a) Both A and R are true and R is the correct explanation of A.
- b) Both A and R are true, but R is not the correct explanation of A.
- c) A is true, but R is false.
- d) A is false, but R is true.
Correct answer is option 'A'. Can you explain this answer?
Consider the following statements and select the correct answer
by using the codes given below:
Assertion (A): There has been some decline in the growth rate of
India’s population in recent years.
Reason (R): According to 2011 census, about 3/4 of Indian’s
the population is literate.
Codes:
a)
Both A and R are true and R is the correct explanation of A.
b)
Both A and R are true, but R is not the correct explanation of A.
c)
A is true, but R is false.
d)
A is false, but R is true.

|
Srsps answered |
According to the 2011 census the growth rate of people has declined as there is a rise in literacy rate i.e. 73%.
Arrange the following states in the descending order of literacy as per census report of 2011 and select the correct answer from the codes given at the end.1. Kerala2. Manipur3. Tamil Nadu4. Himachal PradeshCodes:- a) 1, 4, 3, 2
- b) 4, 1, 3, 2
- c) 2, 4, 1, 3
- d) 1, 2, 3, 4
Correct answer is option 'A'. Can you explain this answer?
Arrange the following states in the descending order of literacy as per census report of 2011 and select the correct answer from the codes given at the end.
1. Kerala
2. Manipur
3. Tamil Nadu
4. Himachal Pradesh
Codes:
a)
1, 4, 3, 2
b)
4, 1, 3, 2
c)
2, 4, 1, 3
d)
1, 2, 3, 4
|
|
Srsps answered |
Kerala has the highest literacy rate of 93.91%, after that Himachal Pradesh with 83.78%, Tamil Nadu with 80.33% and then Manipur with 79.85%.
What is the percentage of literacy in India, as per 2011 census data:- a) 74%
- b) 78%
- c) 70%
- d) 68%
Correct answer is option 'A'. Can you explain this answer?
What is the percentage of literacy in India, as per 2011 census data:
a)
74%
b)
78%
c)
70%
d)
68%

|
Tejas Chaudhary answered |
Percentage of Literacy in India
India has made significant progress in literacy rates over the years. As per the 2011 census data, the percentage of literacy in India was recorded at 74%.
Factors contributing to literacy rate in India
- **Government Initiatives**: The Indian government has taken various initiatives to promote literacy, such as the Sarva Shiksha Abhiyan and the National Literacy Mission.
- **Education Infrastructure**: The establishment of schools, colleges, and other educational institutions has played a crucial role in improving literacy rates in the country.
- **Awareness Programs**: Awareness programs and campaigns have been conducted to emphasize the importance of education and literacy among the masses.
- **Gender Disparities**: Efforts have been made to bridge the gender gap in literacy rates by encouraging education for girls and women.
- **Technological Advancements**: The use of technology in education has also contributed to improving literacy rates in India.
Challenges in achieving universal literacy
- **Rural-Urban Divide**: There is still a significant gap in literacy rates between rural and urban areas in India.
- **Poverty**: Poverty remains a major barrier to education, as many families struggle to afford basic necessities, let alone education.
- **Quality of Education**: Despite the increase in literacy rates, the quality of education in India remains a concern, with many students lacking basic skills.
- **Dropout Rates**: High dropout rates in schools hinder the progress towards universal literacy.
Conclusion
While the literacy rate in India has shown improvement, there is still a long way to go in achieving universal literacy. Continued efforts from the government, NGOs, and other stakeholders are essential to address the challenges and ensure that every individual in India has access to quality education.
According to the Census 2011, the Indian State which had the best Sex (male-female) ratio of 1,084 females for 1000 males is—- a) Chhattisgarh
- b) Tamil Nadu
- c) Kerala
- d) Odisha
Correct answer is option 'C'. Can you explain this answer?
According to the Census 2011, the Indian State which had the best Sex (male-female) ratio of 1,084 females for 1000 males is—
a)
Chhattisgarh
b)
Tamil Nadu
c)
Kerala
d)
Odisha
|
|
Anu Sen answered |
The Indian State with the best Sex Ratio according to Census 2011
Introduction:
The sex ratio is an important demographic indicator that measures the number of females per 1000 males in a given population. It provides insights into the gender balance within a society and is often used to assess the status of women and their overall well-being. In this question, we are asked to identify the Indian state with the best sex ratio based on the data from the Census 2011.
Explanation:
According to the Census 2011, the Indian state with the best sex ratio of 1,084 females for every 1000 males is Kerala. Let's explore the reasons behind this exceptional sex ratio in Kerala.
1. Female Literacy:
Kerala has made significant progress in female literacy over the years. The state has one of the highest literacy rates in India, and this has played a crucial role in empowering women and promoting gender equality. Education has been a key factor in changing societal attitudes and providing women with opportunities for employment and self-reliance.
2. Healthcare Facilities:
Kerala has a well-developed healthcare system that provides accessible and quality healthcare services to its population. The state's focus on healthcare has resulted in improved maternal and child health outcomes, leading to a higher survival rate among females. This, in turn, has contributed to the higher sex ratio in the state.
3. Social Development Indicators:
Kerala has consistently performed well in various social development indicators, such as life expectancy, infant mortality rate, and overall human development index. These indicators are closely linked to the well-being of women and contribute to a positive environment for their growth and development.
4. Empowerment of Women:
Kerala has implemented several policies and programs aimed at empowering women and ensuring their active participation in society. Initiatives like Kudumbashree, a women-oriented poverty eradication program, have provided women with opportunities for entrepreneurship and employment. The involvement of women in decision-making processes at various levels has also contributed to their overall empowerment.
Conclusion:
In conclusion, Kerala has achieved the best sex ratio among Indian states, with 1,084 females for every 1000 males according to the Census 2011. This can be attributed to factors such as female literacy, healthcare facilities, social development indicators, and the empowerment of women. The state's focus on these areas has resulted in a more gender-balanced society, where women have better opportunities for growth and development.
As Per Census 2011, the Total Fertility Rate (TFR) of India is —- a) 3.2
- b) 2.9
- c) 2.6
- d) 2.4
Correct answer is option 'D'. Can you explain this answer?
As Per Census 2011, the Total Fertility Rate (TFR) of India is —
a)
3.2
b)
2.9
c)
2.6
d)
2.4
|
|
Gopal Sen answered |
Total Fertility Rate (TFR) in India
The Total Fertility Rate (TFR) is a critical demographic indicator that reflects the average number of children a woman would have during her lifetime based on current age-specific fertility rates.
Census 2011 Findings
According to the Census of India 2011, the TFR was reported as 2.4. This figure signifies a significant decline in fertility rates compared to previous decades.
Implications of TFR 2.4
- Population Growth Stabilization: A TFR of 2.4 is indicative of a population nearing replacement level, which is approximately 2.1. This suggests that India is moving towards stabilizing its population growth.
- Socio-economic Impact: Lower fertility rates can lead to improved economic conditions, as families may have more resources to invest in each child’s education and health.
Regional Variations
- Diverse Fertility Rates: India exhibits considerable regional diversity in fertility rates. States like Bihar and Uttar Pradesh have higher fertility rates, while states like Kerala and Punjab have rates closer to or below the replacement level.
- Factors Influencing TFR: Education, access to healthcare, and socio-cultural norms significantly influence fertility rates across different regions.
Government Initiatives
- Family Planning Programs: The Indian government has implemented various family planning initiatives aimed at promoting awareness and providing access to contraceptive methods to manage fertility effectively.
- Empowerment of Women: Education and empowerment of women play a crucial role in reducing TFR, as educated women tend to have fewer children and make informed decisions regarding family planning.
In summary, the TFR of 2.4 in India as per the 2011 Census marks a pivotal moment in the country’s demographic transition, with far-reaching implications for its socio-economic landscape.
Which among the following was used as the motto for Census of India 2011?- a) Our Future, Our Country
- b) Our Country, Our Census
- c) People of India, Our Census
- d) Our Census, Our Future
Correct answer is option 'D'. Can you explain this answer?
Which among the following was used as the motto for Census of India 2011?
a)
Our Future, Our Country
b)
Our Country, Our Census
c)
People of India, Our Census
d)
Our Census, Our Future
|
|
Mehul Saini answered |
Our Census, Our Future
The motto for Census of India 2011 was "Our Census, Our Future". This motto emphasizes the importance of the census in shaping the future of the country. Let's break down the significance of this motto:
Importance of the Census:
- The census provides crucial data on the population, demographics, and socio-economic characteristics of the country.
- This data is used for planning and policy-making in various sectors such as health, education, infrastructure, and social welfare.
Ownership and Participation:
- By stating "Our Census", the motto instills a sense of ownership and responsibility among the people towards the census.
- It encourages active participation in the census process, as the data collected directly impacts the future of the nation.
Looking towards the Future:
- The inclusion of "Our Future" in the motto highlights the forward-looking approach of the census.
- It signifies that the data collected will not only reflect the present state of the country but also guide future development and growth.
Community Engagement:
- The motto "Our Census, Our Future" aims to engage communities at all levels in the census process.
- It stresses the collective responsibility of every individual towards ensuring an accurate and comprehensive census.
In conclusion, the motto "Our Census, Our Future" encapsulates the essence of the census as a tool for shaping the future of the nation and underscores the importance of active participation and ownership by the people.
Currently half of the world’s population lives in just six countries. Identify them from the following.- a) India, China, Pakistan, Brazil, Bangladesh, Indonesia.
- b) India, China, Brazil, Pakistan, Bhutan, United States.
- c) China, India, United States, Indonesia, Brazil, Pakistan.
- d) China, India, Bangladesh, United States, Pakistan, Brazil.
Correct answer is option 'C'. Can you explain this answer?
Currently half of the world’s population lives in just six countries. Identify them from the following.
a)
India, China, Pakistan, Brazil, Bangladesh, Indonesia.
b)
India, China, Brazil, Pakistan, Bhutan, United States.
c)
China, India, United States, Indonesia, Brazil, Pakistan.
d)
China, India, Bangladesh, United States, Pakistan, Brazil.
|
|
Raksha Ahuja answered |
Identifying the Six Countries:
a) China, India, United States, Indonesia, Brazil, Pakistan.
Explanation:
China, India, United States, Indonesia, Brazil, and Pakistan are the six countries where half of the world's population currently resides. Here is a breakdown of each country's population and its contribution to the global population:
China:
China is the most populous country in the world, with over 1.4 billion people. It alone accounts for roughly 18% of the global population.
India:
India follows closely behind China, with a population of over 1.3 billion people. India's population accounts for approximately 17% of the world's population.
United States:
The United States is the third most populous country globally, with a population of around 331 million people. It contributes about 4% to the total global population.
Indonesia:
Indonesia is the fourth most populous country, with a population of over 270 million people. It makes up around 3.5% of the world's population.
Brazil:
Brazil is the fifth most populous country, with a population of approximately 213 million people. It contributes around 2.7% to the global population.
Pakistan:
Pakistan is the sixth most populous country, with a population of around 220 million people. It accounts for about 2.8% of the total global population.
Conclusion:
These six countries - China, India, United States, Indonesia, Brazil, and Pakistan - collectively house half of the world's population, making them significant players in global demographics.
Which one of the Indian state/union Territories is having lowest sex ratio in 2011?- a) Haryana
- b) Daman and Diu
- c) Punjab
- d) Dadar and Nagar Haveli
Correct answer is option 'B'. Can you explain this answer?
Which one of the Indian state/union Territories is having lowest sex ratio in 2011?
a)
Haryana
b)
Daman and Diu
c)
Punjab
d)
Dadar and Nagar Haveli
|
|
Srsps answered |
Total Population of Daman and Diu is 2.43 Lakhs as per census 2011. Literacy rate in Daman and Diu is 87.10 percent while sex ratio is 618 females per 1000.
Why South-East Asia has the largest concentration of peasant population at the global scale?- a) The area is dominated by shifting cultivation due to favourable terrain character
- b) Intensive subsistence farming is practised in the region
- c) The region has favourable and healthier climate
- d) The area has a large forested area which is cleared for cultivation of various crops
Correct answer is option 'B'. Can you explain this answer?
Why South-East Asia has the largest concentration of peasant population at the global scale?
a)
The area is dominated by shifting cultivation due to favourable terrain character
b)
Intensive subsistence farming is practised in the region
c)
The region has favourable and healthier climate
d)
The area has a large forested area which is cleared for cultivation of various crops
|
|
Anjana Datta answered |
Intensive subsistence farming:
- South-East Asia has the largest concentration of peasant population globally due to the prevalence of intensive subsistence farming in the region.
- Intensive subsistence farming involves cultivating small plots of land with high labor inputs and output per unit of land.
- Peasants in South-East Asia typically rely on traditional farming methods and techniques to cultivate crops such as rice, maize, and vegetables.
- The region's fertile soil and favorable climate also contribute to the success of intensive subsistence farming practices.
Population density:
- The high population density in South-East Asia also plays a role in the large concentration of peasant population in the region.
- The limited availability of arable land and the increasing demand for food due to population growth have led to a high concentration of peasants engaged in farming activities.
Socio-economic factors:
- Socio-economic factors such as land distribution patterns, access to resources, and government policies also influence the concentration of peasant population in South-East Asia.
- Limited access to modern technology and agricultural inputs further contribute to the predominance of traditional farming methods among peasants in the region.
In conclusion, the combination of intensive subsistence farming practices, high population density, and socio-economic factors has led to South-East Asia having the largest concentration of peasant population at the global scale.
Which factors influence the density distribution of population in India most profoundly?1. Amount of rainfall2. Fertility of soils3. Distribution of minerals4. Cultural factors- a) 1 and 4
- b) 2 and 4
- c) 1 and 2
- d) 1 and 3
Correct answer is option 'C'. Can you explain this answer?
Which factors influence the density distribution of population in India most profoundly?
1. Amount of rainfall
2. Fertility of soils
3. Distribution of minerals
4. Cultural factors
a)
1 and 4
b)
2 and 4
c)
1 and 2
d)
1 and 3
|
|
Bhavya Bajaj answered |
The correct answer is option 'C' - 1 and 2. The factors that influence the density distribution of population in India most profoundly are the amount of rainfall and the fertility of soils. Let's delve into the details:
1. Amount of rainfall:
- Rainfall is a critical factor that determines the availability of water for agriculture, which is the primary occupation for a large portion of the Indian population.
- Regions with adequate rainfall are more suitable for agriculture, leading to higher population density as people settle in these areas to cultivate crops.
- In contrast, areas with low rainfall face water scarcity and are less suitable for agriculture, resulting in lower population density.
2. Fertility of soils:
- Fertile soils play a crucial role in determining the agricultural productivity of a region.
- Areas with fertile soils provide better conditions for crop growth and higher yields, attracting agricultural activities and settlements.
- The fertility of soils is influenced by factors such as the presence of organic matter, nutrient content, and soil composition, which vary across different regions of India.
- Regions with highly fertile soils tend to have higher population density as they offer better agricultural opportunities.
Other factors mentioned in the options, such as the distribution of minerals and cultural factors, do have some influence on the density distribution of population in India but not as profoundly as rainfall and soil fertility.
3. Distribution of minerals:
- The distribution of minerals has an impact on economic activities and industrial development in specific regions.
- However, mineral-rich areas may not necessarily have a high population density as mineral extraction activities often require fewer workers compared to agriculture.
- Moreover, mineral-rich areas may face challenges in terms of accessibility, infrastructure, and environmental concerns, limiting their potential for settlement and population growth.
4. Cultural factors:
- Cultural factors, such as language, religion, and traditions, can influence the settlement patterns and distribution of population to some extent.
- However, cultural factors alone are not the most significant determinants of population density.
- Cultural factors may play a role in shaping regional preferences for settlement but are secondary to environmental factors like rainfall and soil fertility.
In conclusion, while factors like the distribution of minerals and cultural factors do have some influence on the density distribution of population in India, the amount of rainfall and the fertility of soils are the most profound factors. These environmental factors directly affect agricultural productivity and determine the suitability of regions for settlement and agriculture, thereby playing a crucial role in shaping population distribution in the country.
‘Population dividend’ refers to- a) total number of population
- b) youthful age structure of a population
- c) relatively high proportion of experienced aged people
- d) migration from richer region to poorer region
Correct answer is option 'B'. Can you explain this answer?
‘Population dividend’ refers to
a)
total number of population
b)
youthful age structure of a population
c)
relatively high proportion of experienced aged people
d)
migration from richer region to poorer region
|
|
Freedom Institute answered |
Population dividend or Demographic dividend refers to a period - usually 20 to 30 years - when fertility rates fall due to significant reductions in child and infant mortality rates. It occurs when the proportion of working people in the total population is high because this indicates that more people have the potential to be productive and contribute to growth of the economy.
Which one of the following is the correct descending order of the three most populous states of India (2011)?- a) Uttar Pradesh, Maharashtra, Bihar
- b) Maharashtra, Bihar, West Bengal
- c) Uttar Pradesh, Bihar, West Bengal
- d) Uttar Pradesh, West Bengal, Bihar
Correct answer is option 'A'. Can you explain this answer?
Which one of the following is the correct descending order of the three most populous states of India (2011)?
a)
Uttar Pradesh, Maharashtra, Bihar
b)
Maharashtra, Bihar, West Bengal
c)
Uttar Pradesh, Bihar, West Bengal
d)
Uttar Pradesh, West Bengal, Bihar
|
|
Dhruba Choudhary answered |
Explanation:
Population of the three most populous states of India in 2011:
- Uttar Pradesh: 199.8 million
- Maharashtra: 112.4 million
- Bihar: 104.1 million
Descending order of the three most populous states:
1. Uttar Pradesh (199.8 million)
2. Maharashtra (112.4 million)
3. Bihar (104.1 million)
Therefore, the correct descending order of the three most populous states of India in 2011 is Uttar Pradesh, Maharashtra, Bihar.
Consider the following statements:1. As per census 2011, the population growth rate of Nagalandduring 2001–2011 was the lowest among the states of India.2. As per census 2011, the population growth rate of Dadra andNagar Haveli was the highest among the states ofIndia/Union territory.Which of the statements given above is/are correct?- a) 1 only
- b) 2 only
- c) Both 1 and 2
- d) Neither 1 nor 2
Correct answer is option 'C'. Can you explain this answer?
Consider the following statements:
1. As per census 2011, the population growth rate of Nagaland
during 2001–2011 was the lowest among the states of India.
2. As per census 2011, the population growth rate of Dadra and
Nagar Haveli was the highest among the states of
India/Union territory.
Which of the statements given above is/are correct?
a)
1 only
b)
2 only
c)
Both 1 and 2
d)
Neither 1 nor 2
|
|
Arka Kaur answered |
Population Growth Rate of Nagaland
- The statement that the population growth rate of Nagaland during 2001–2011 was the lowest among the states of India is correct.
- As per the 2011 Census, Nagaland recorded a population growth rate of 0.58% during the decade, which was the lowest in the country.
- This low growth rate can be attributed to various factors such as high literacy rates, better healthcare facilities, and effective family planning programs in the state.
Population Growth Rate of Dadra and Nagar Haveli
- The statement that the population growth rate of Dadra and Nagar Haveli was the highest among the states of India/Union territory is correct.
- Dadra and Nagar Haveli recorded a population growth rate of 55.5% during 2001–2011, which was the highest in the country.
- This high growth rate can be attributed to factors such as migration, high fertility rates, and lack of stringent family planning measures in the region.
Therefore, both statements are correct, with Nagaland having the lowest population growth rate and Dadra and Nagar Haveli having the highest population growth rate during the specified period.
Which one of the following years is known as the ‘Year of the Great Divide’ with regard to population, after which there has been a continuous and rapid growth in India’s population?- a) 1911
- b) 1921
- c) 1941
- d) 1951
Correct answer is option 'B'. Can you explain this answer?
Which one of the following years is known as the ‘Year of the Great Divide’ with regard to population, after which there has been a continuous and rapid growth in India’s population?
a)
1911
b)
1921
c)
1941
d)
1951
|
|
Pooja Choudhury answered |
- The year 1921 is a “year of the great divide” in the demographic history of India when mortality started to decline leading to acceleration in the rate of population growth.
- During the next three decades (1921-51) the rate of population growth continued at a level of over one per cent per annum. The slight dip in the growth rate in 1941-51 partly reflects the Bengal famine of 1942-43 and dislocation, due to the partition of India in 1947.
Which of the following are true of matrilineal societies?1. Newly married couple stays with the woman’s parents.2. As per the rules of inheritance, the property passes from mother to daughter.3. Women play a dominant role in the family.4. Examples of matrilineal societies are those of the Khasi and Jaintia tribes of Meghalaya.Select the correct answer using the codes given below- a) 1, 2, 3 and 4
- b) 1 and 3
- c) 2 and 4
- d) 1, 2 and 4
Correct answer is option 'A'. Can you explain this answer?
Which of the following are true of matrilineal societies?
1. Newly married couple stays with the woman’s parents.
2. As per the rules of inheritance, the property passes from mother to daughter.
3. Women play a dominant role in the family.
4. Examples of matrilineal societies are those of the Khasi and Jaintia tribes of Meghalaya.
Select the correct answer using the codes given below
a)
1, 2, 3 and 4
b)
1 and 3
c)
2 and 4
d)
1, 2 and 4
|
|
Freedom Institute answered |
Matrilineal descent is a kinship system where a descent group traces its ancestral lineage via the maternal (uterine) side of the group. The property passes from mother to daughter. Women are dominant in the family. The examples of matrilineal societies are the Khasi and Jaintia tribes of Meghalaya.
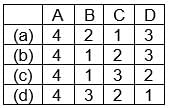
Match List-I with List-II and select the correct answer from the codes given below: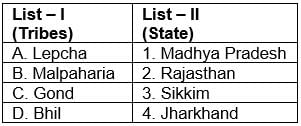 Codes:
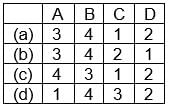
- a) a
- b) b
- c) c
- d) d
Correct answer is option 'A'. Can you explain this answer?
Match List-I with List-II and select the correct answer from the codes given below:
Codes:
a)
a
b)
b
c)
c
d)
d
|
|
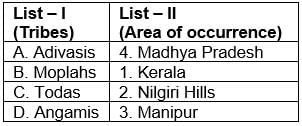
Freedom Institute answered |
- The Lepchas are the aboriginal inhabitants of Sikkim and they are mostly settled in North Sikkim. They are mostly Buddhist but many of them have now adopted Christianity. The lepcha folklore is melodious and contains lots of interesting folk stories.
- The Mal Paharia people are a tribal people of Jharkhand. Paharia Mal or Mal Paharia is listed as a Scheduled Tribe by the Government of Jharkhand. As per 2001 census, the Mal Paharias number is around 115,093 in Jharkhand.
- Gond tribes spread in MP Chhattisgarh.
- Bhils tribes of India are the largest tribe of South Asia. They are commonly found in the states of Rajasthan and Gujarat.
Match the following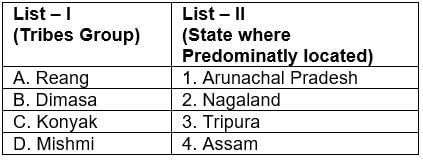 Codes:
- a) a
- b) b
- c) c
- d) d
Correct answer is option 'D'. Can you explain this answer?
Match the following
Codes:
a)
a
b)
b
c)
c
d)
d
|
|
Srsps answered |
- Reang or Riang are one of the 21 scheduled tribes of the Indian state of Tripura. The correct nomenclature for this ethnic group is actually Bru although the name reang was accidentally incorporated by the Indian government during a census count.
- The Dimasa people are a group of people inhabiting Assam states in North eastern India. Dimasa mythology says that they are the children of Bangla Raja (Earthquake God) and the great divine bird Arikhidima.
- The Konyak are a Naga people, and are recognised among other Naga by their tattoos, which they have all over their face and hands; facial tattoos were earned for taking an enemy’s head. They are called the land of Angh’s. They have the largest population among the Nagas.
- The Mishmi or Deng people of Tibet and Arunachal Pradesh are an ethnic group comprising mainly three tribes: Idu Mishmi; Digaro tribe, and Miju Mishmi.
Directions :
In this section, each item consists of six sentences of a passage. The first and sixth sentences are given in the beginning as S1 and S6. The middle four sentences in each have been jumbled up and labeled as P, Q, R, and S. You are required to find the proper sequence of the four sentences and mark your response accordingly on the Answer Sheet.
S1: India’s museums tend to be dreary experiences.
S6: Because it’s better to attract crowds than dust.
P: Even the Louvre that attracted an eye-popping 8.1 million visitors last year compared to India’s 10.18 million foreign tourists, has hooked up with Beyonce and Jay-Z for promotion, where they take a selfie with Mona Lisa.
Q: Our museums need to get cool too.
R: A change of approach is clearly called for.
S: Troops of restless schoolchildren are often the most frequent visitors, endlessly being told to lower their voices and not touch the art.
The correct sequence should be- a)P Q R S
- b)P R S Q
- c)S R P Q
- d)Q S R P
Correct answer is option 'D'. Can you explain this answer?
Directions :
In this section, each item consists of six sentences of a passage. The first and sixth sentences are given in the beginning as S1 and S6. The middle four sentences in each have been jumbled up and labeled as P, Q, R, and S. You are required to find the proper sequence of the four sentences and mark your response accordingly on the Answer Sheet.
S1: India’s museums tend to be dreary experiences.
S6: Because it’s better to attract crowds than dust.
P: Even the Louvre that attracted an eye-popping 8.1 million visitors last year compared to India’s 10.18 million foreign tourists, has hooked up with Beyonce and Jay-Z for promotion, where they take a selfie with Mona Lisa.
Q: Our museums need to get cool too.
R: A change of approach is clearly called for.
S: Troops of restless schoolchildren are often the most frequent visitors, endlessly being told to lower their voices and not touch the art.
The correct sequence should be
a)
P Q R S
b)
P R S Q
c)
S R P Q
d)
Q S R P
|
|
Akshita Kulkarni answered |
Is known for its rich cultural heritage and diversity.
P: It is a land that is home to various religions, languages, and traditions.
Q: This diversity is reflected in the various festivals and celebrations that take place throughout the year.
R: These festivals are not only a time of joy and merriment but also an opportunity to strengthen the bond between communities.
S: Diwali, Holi, Eid, Christmas, and Pongal are some of the major festivals celebrated in India.
S6: They bring people together, irrespective of their differences, and promote unity and harmony.
The proper sequence is:
S1: India is known for its rich cultural heritage and diversity.
P: It is a land that is home to various religions, languages, and traditions.
Q: This diversity is reflected in the various festivals and celebrations that take place throughout the year.
R: These festivals are not only a time of joy and merriment but also an opportunity to strengthen the bond between communities.
S: Diwali, Holi, Eid, Christmas, and Pongal are some of the major festivals celebrated in India.
S6: They bring people together, irrespective of their differences, and promote unity and harmony.
The proper sequence is:
S1: India is known for its rich cultural heritage and diversity.
P: It is a land that is home to various religions, languages, and traditions.
Q: This diversity is reflected in the various festivals and celebrations that take place throughout the year.
R: These festivals are not only a time of joy and merriment but also an opportunity to strengthen the bond between communities.
S: Diwali, Holi, Eid, Christmas, and Pongal are some of the major festivals celebrated in India.
S6: They bring people together, irrespective of their differences, and promote unity and harmony.
The continents with the highest and the lowest density of population are respectively- a) Europe and Africa
- b) Africa and Asia
- c) Asia and Oceania
- d) Europe and Oceania
Correct answer is option 'C'. Can you explain this answer?
The continents with the highest and the lowest density of population are respectively
a)
Europe and Africa
b)
Africa and Asia
c)
Asia and Oceania
d)
Europe and Oceania
|
|
Dhruv Yadav answered |
Continents with the highest and lowest population density
Introduction:
Population density refers to the number of individuals per unit area or volume. It is a measure of how crowded or sparsely populated a specific area is. In the context of continents, population density provides an understanding of the distribution and concentration of people.
Continent with the highest population density - Asia:
- Asia, being the largest continent in terms of land area, also has the highest population density.
- With a population of over 4.6 billion people, Asia is home to approximately 60% of the global population.
- Countries like China and India, which have the highest populations in the world, are located in Asia.
- The high population density in Asia can be attributed to factors such as rapid urbanization, industrialization, and high birth rates.
Continent with the lowest population density - Oceania:
- Oceania, which includes countries like Australia, New Zealand, and several Pacific island nations, has the lowest population density among the continents.
- Oceania has a relatively small population compared to its vast land area.
- The majority of Oceania's land is made up of remote islands and uninhabited regions, leading to low population density.
- Australia, the largest country in Oceania, has a significant portion of its landmass as arid or semi-arid, making it sparsely populated.
- Additionally, the small populations of Pacific island nations contribute to the overall low population density in Oceania.
Comparison:
- Asia has the highest population density due to its large population and relatively smaller land area compared to other continents.
- Oceania has the lowest population density due to its vast land area, remote islands, and small populations in the Pacific island nations.
Conclusion:
Understanding the population density of continents provides insights into the distribution and concentration of people across the world. Asia, with its large population and relatively smaller land area, has the highest population density. On the other hand, Oceania, with its vast land area, remote islands, and small populations, has the lowest population density among the continents.
The percentage of the population in the age group 20 years and above out of the total population of India as per 2011 Census is—- a) 59.29%
- b) 60.81%
- c) 61.05%
- d) 62.17%
Correct answer is option 'A'. Can you explain this answer?
The percentage of the population in the age group 20 years and above out of the total population of India as per 2011 Census is—
a)
59.29%
b)
60.81%
c)
61.05%
d)
62.17%
|
|
Srsps answered |
59.29% percentage of the population in the age group 20 years and above out of the total population of India as per 2011 census.
The most populated desert in the world is- a) Sahara
- b) Gobi
- c) Thar
- d) Kalahari
Correct answer is option 'C'. Can you explain this answer?
The most populated desert in the world is
a)
Sahara
b)
Gobi
c)
Thar
d)
Kalahari
|
|
Rajiv Reddy answered |
Thar in Rajasthan is the most populated desert in the world.
As per 2011 census data, the child sex ratio has come down from 927 to- a) 904
- b) 919
- c) 922
- d) 925
Correct answer is option 'B'. Can you explain this answer?
As per 2011 census data, the child sex ratio has come down from 927 to
a)
904
b)
919
c)
922
d)
925
|
|
Srsps answered |
As per census 2011 the child sex ratio (0-6 years) is 919 and thus a decline from previous census data.
Which state of India tops in literacy?- a) Kerala
- b) Tamil Nadu
- c) Delhi
- d) Uttar Pradesh
Correct answer is option 'A'. Can you explain this answer?
Which state of India tops in literacy?
a)
Kerala
b)
Tamil Nadu
c)
Delhi
d)
Uttar Pradesh
|
|
Srsps answered |
The highest literacy rate was in kerala (93.9%).
Consider the following specific stages of demographic transition associated with economic development:1. Low birth rate with low death rate.2. High birth rate with high death rate.3. High birth rate with low death rate.Select the correct order of the above stages using the codes given below:Codes:- a) 1, 2, 3
- b) 2, 1, 3
- c) 2, 3, 1
- d) 3, 2, 1
Correct answer is option 'C'. Can you explain this answer?
Consider the following specific stages of demographic transition associated with economic development:
1. Low birth rate with low death rate.
2. High birth rate with high death rate.
3. High birth rate with low death rate.
Select the correct order of the above stages using the codes given below:
Codes:
a)
1, 2, 3
b)
2, 1, 3
c)
2, 3, 1
d)
3, 2, 1
|
|
Srsps answered |
In general, impact of economic growth in an economy on the population will show following behaviour, High rate of birth and High rate of deaths - Low population growth (under- developed), High rate of birth and Low rate of deaths - High population growth (developing), Low rate of birth and Low rate of deaths - Low population growth (developed)
The demographic transition model was propounded by- a) J. Clarke
- b) F.W. Notestein
- c) G.T. Trewartha
- d) J.J. Spengler
Correct answer is option 'B'. Can you explain this answer?
The demographic transition model was propounded by
a)
J. Clarke
b)
F.W. Notestein
c)
G.T. Trewartha
d)
J.J. Spengler
|
|
Rahul Desai answered |
- The demographic transition model was propounded by F.W. Notestion.
- Frank Wallace Notestein (August 16, 1902 – February 19, 1983) was an American demographer who contributed significantly to the development of science.
- He was the founding director of the Office of Population Research at Princeton University, and later president of the Population Council. He was also the first director of the Population Division of the United Nations, 1946–1948.
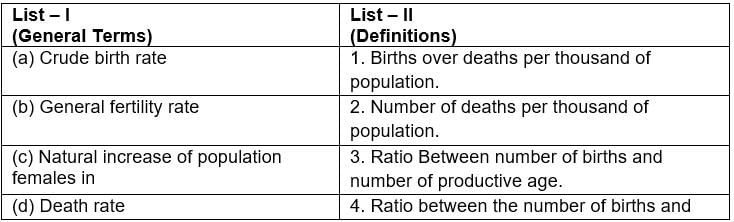
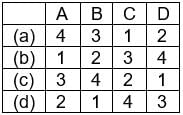
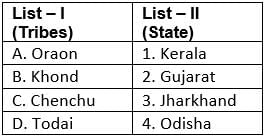
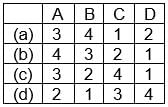
As per 2011 census data, the sex ratio is- a) 943
- b) 940
- c) 925
- d) 920
Correct answer is option 'A'. Can you explain this answer?
As per 2011 census data, the sex ratio is
a)
943
b)
940
c)
925
d)
920
|
|
Srsps answered |
In 2011 the sex ratio was 943 and showed an upward trend from previous data of 933 females per thousand males.
On which one among the following islands, does the Negrito tribe called ‘the Onge’ live?- a) North Andaman
- b) Little Andaman
- c) Little Nicobar
- d) Great Nicobar
Correct answer is option 'B'. Can you explain this answer?
On which one among the following islands, does the Negrito tribe called ‘the Onge’ live?
a)
North Andaman
b)
Little Andaman
c)
Little Nicobar
d)
Great Nicobar
|
|
Srsps answered |
The Onges, a negrito tribe, inhabit the Little Andaman Island in Andaman District. The Onges are pure hunter- gatherers. They are not aware of agriculture
Among the following Union Territories the female literacy is highest according to Census 2011.- a) Puducherry
- b) Chandigarh
- c) Daman and Diu
- d) Lakshadweep
Correct answer is option 'D'. Can you explain this answer?
Among the following Union Territories the female literacy is highest according to Census 2011.
a)
Puducherry
b)
Chandigarh
c)
Daman and Diu
d)
Lakshadweep
|
|
Srsps answered |
Lakshadweep is the U.T. with the highest female literacy rate (88.25%).
Name the state where density of population is the lowest- a) Meghalaya
- b) Mizoram
- c) Arunachal Pradesh
- d) Sikkim
Correct answer is option 'C'. Can you explain this answer?
Name the state where density of population is the lowest
a)
Meghalaya
b)
Mizoram
c)
Arunachal Pradesh
d)
Sikkim
|
|
Rajiv Reddy answered |
Arunachal Pradesh is the least dense populated state (17/km2).
A gradual change in the manner of population growth occurring over a long period of time is known as—- a) Demographic transition
- b) Population explosion
- c) Demographic dynamism
- d) Demographic transformation
Correct answer is option 'A'. Can you explain this answer?
A gradual change in the manner of population growth occurring over a long period of time is known as—
a)
Demographic transition
b)
Population explosion
c)
Demographic dynamism
d)
Demographic transformation
|
|
Freedom Institute answered |
Demographic transition is a gradual change in the manner of population growth occurring over a long period of time.
Directions: Each item in this section has a sentence with three underlined parts labelled as (a), (b) and (c). Read each sentence to find out whether there is an error in any underlined part and indicate your response on the Answer Sheet against the corresponding letter i.e., (a) or (b) or (c). If you find no error, your response should be indicated as (d).Q. The celebrated grammarian Patanjali (a) was (b) a contemporary to Pushyamitra Sunga (c) No error (d)- a)A
- b)B
- c)C
- d)D
Correct answer is option 'C'. Can you explain this answer?
Directions: Each item in this section has a sentence with three underlined parts labelled as (a), (b) and (c). Read each sentence to find out whether there is an error in any underlined part and indicate your response on the Answer Sheet against the corresponding letter i.e., (a) or (b) or (c). If you find no error, your response should be indicated as (d).
Q. The celebrated grammarian Patanjali (a) was (b) a contemporary to Pushyamitra Sunga (c) No error (d)
a)
A
b)
B
c)
C
d)
D
|
|
Advait Singh answered |
The correct phrase is “contemporary of someone” but the part C “to” is used which is wrong. So, the error is in part C. Hence option C is correct.
Match the following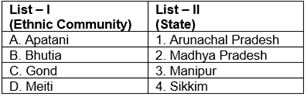 Codes:
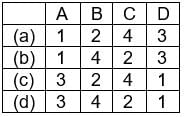
- a)a
- b)b
- c)c
- d)d
Correct answer is option 'B'. Can you explain this answer?
Match the following
Codes:
a)
a
b)
b
c)
c
d)
d
|
|
Srsps answered |
1. The Apatani - are a tribal group of people living in the Ziro valley in the Lower Subansiri district of Arunachal Pradesh.
2. Bhutia people live particularly in Sikkim.
3. Gond people are a Dravidian people of central India spread over the states of Madhya Pradesh, eastern Maharashtra (Vidarbha), Chhattisgarh, Uttar Pradesh,
Telangana and Western Odisha.
4. The Meetei people are an ethnic group of Kangleipak (Manipur).

Chapter doubts & questions for Population - Geography for UPSC CSE 2025 is part of UPSC CSE exam preparation. The chapters have been prepared according to the UPSC CSE exam syllabus. The Chapter doubts & questions, notes, tests & MCQs are made for UPSC CSE 2025 Exam. Find important definitions, questions, notes, meanings, examples, exercises, MCQs and online tests here.
Chapter doubts & questions of Population - Geography for UPSC CSE in English & Hindi are available as part of UPSC CSE exam.
Download more important topics, notes, lectures and mock test series for UPSC CSE Exam by signing up for free.
Geography for UPSC CSE
180 videos|620 docs|192 tests
|
|
© EduRev
|
Education Revolution
|


|


Signup on EduRev and stay on top of your study goals
10M+ students crushing their study goals daily