Physics Exam > Physics Questions > The area of the Carnot cycle on a T-S diagram...
Start Learning for Free
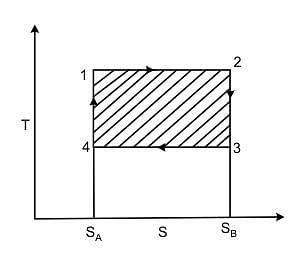
The area of the Carnot cycle on a T-S diagram represents
Select one:
Select one:
- a)Entropy
- b)efficiency of the engine
- c)work done in a cycle
- d)Change in internal energy
Correct answer is option 'C'. Can you explain this answer?
Verified Answer
The area of the Carnot cycle on a T-S diagram representsSelect one:a)E...
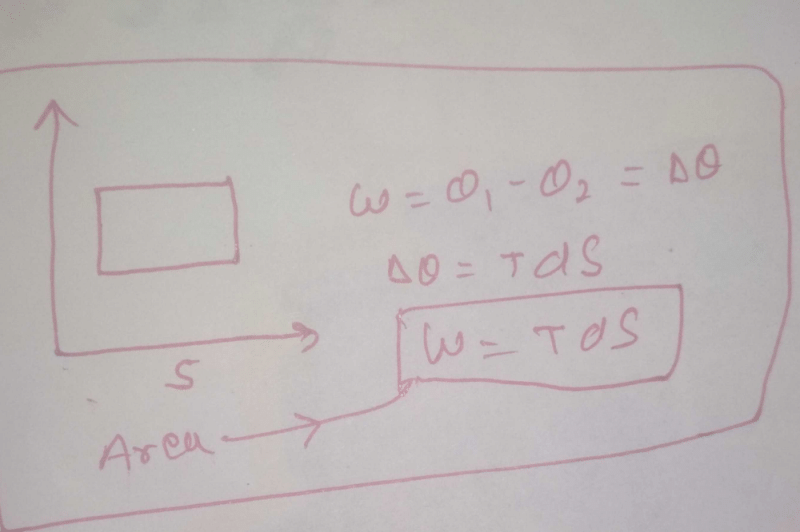
During the reversible process, the energy transfer as heat to the system from the surroundings is given by
Hence the area enclosed by a cycle on a T − S diagram represents the net work done by a system.
It also represents

Hence the area enclosed by a cycle on a T − S diagram represents the net work done by a system.
It also represents

Most Upvoted Answer
The area of the Carnot cycle on a T-S diagram representsSelect one:a)E...

Free Test
FREE
| Start Free Test |
Community Answer
The area of the Carnot cycle on a T-S diagram representsSelect one:a)E...
The area of the Carnot cycle on a T-S (Temperature-Entropy) diagram represents the work done in a cycle. This can be explained by breaking down the Carnot cycle and analyzing the different processes involved.
The Carnot cycle is a theoretical thermodynamic cycle that consists of four reversible processes: isothermal expansion, adiabatic expansion, isothermal compression, and adiabatic compression. These processes are represented on a T-S diagram, where the vertical axis represents entropy and the horizontal axis represents temperature.
1. Isothermal Expansion: In this process, the working substance (usually a gas) expands while being in contact with a high-temperature reservoir. As the gas expands, it absorbs heat from the reservoir and its temperature remains constant. This process is represented by a horizontal line on the T-S diagram. The area under this line represents the heat absorbed from the source, as the heat transferred to the working substance increases its entropy.
2. Adiabatic Expansion: After the isothermal expansion, the working substance undergoes an adiabatic expansion, where no heat is exchanged with the surroundings. During this process, the gas expands further and its temperature decreases. This process is represented by a downward-sloping line on the T-S diagram.
3. Isothermal Compression: In this process, the working substance is compressed while being in contact with a low-temperature reservoir. As the gas is compressed, it releases heat to the reservoir and its temperature remains constant. This process is represented by a horizontal line on the T-S diagram. The area under this line represents the heat rejected to the sink, as the heat transferred from the working substance decreases its entropy.
4. Adiabatic Compression: After the isothermal compression, the working substance undergoes an adiabatic compression, where no heat is exchanged with the surroundings. During this process, the gas is further compressed and its temperature increases. This process is represented by an upward-sloping line on the T-S diagram.
The Carnot cycle is a closed loop on the T-S diagram, and the area enclosed by this loop represents the net work done by the system. This is because the area under the isothermal expansion line represents the work done by the system, while the area under the isothermal compression line represents the work done on the system. The net work done is equal to the difference between these two areas.
Therefore, the area of the Carnot cycle on a T-S diagram represents the work done in a cycle.

|
Explore Courses for Physics exam
|

|
Similar Physics Doubts
The area of the Carnot cycle on a T-S diagram representsSelect one:a)Entropyb)efficiency of the enginec)work done in a cycled)Change in internal energyCorrect answer is option 'C'. Can you explain this answer?
Question Description
The area of the Carnot cycle on a T-S diagram representsSelect one:a)Entropyb)efficiency of the enginec)work done in a cycled)Change in internal energyCorrect answer is option 'C'. Can you explain this answer? for Physics 2025 is part of Physics preparation. The Question and answers have been prepared according to the Physics exam syllabus. Information about The area of the Carnot cycle on a T-S diagram representsSelect one:a)Entropyb)efficiency of the enginec)work done in a cycled)Change in internal energyCorrect answer is option 'C'. Can you explain this answer? covers all topics & solutions for Physics 2025 Exam. Find important definitions, questions, meanings, examples, exercises and tests below for The area of the Carnot cycle on a T-S diagram representsSelect one:a)Entropyb)efficiency of the enginec)work done in a cycled)Change in internal energyCorrect answer is option 'C'. Can you explain this answer?.
The area of the Carnot cycle on a T-S diagram representsSelect one:a)Entropyb)efficiency of the enginec)work done in a cycled)Change in internal energyCorrect answer is option 'C'. Can you explain this answer? for Physics 2025 is part of Physics preparation. The Question and answers have been prepared according to the Physics exam syllabus. Information about The area of the Carnot cycle on a T-S diagram representsSelect one:a)Entropyb)efficiency of the enginec)work done in a cycled)Change in internal energyCorrect answer is option 'C'. Can you explain this answer? covers all topics & solutions for Physics 2025 Exam. Find important definitions, questions, meanings, examples, exercises and tests below for The area of the Carnot cycle on a T-S diagram representsSelect one:a)Entropyb)efficiency of the enginec)work done in a cycled)Change in internal energyCorrect answer is option 'C'. Can you explain this answer?.
Solutions for The area of the Carnot cycle on a T-S diagram representsSelect one:a)Entropyb)efficiency of the enginec)work done in a cycled)Change in internal energyCorrect answer is option 'C'. Can you explain this answer? in English & in Hindi are available as part of our courses for Physics.
Download more important topics, notes, lectures and mock test series for Physics Exam by signing up for free.
Here you can find the meaning of The area of the Carnot cycle on a T-S diagram representsSelect one:a)Entropyb)efficiency of the enginec)work done in a cycled)Change in internal energyCorrect answer is option 'C'. Can you explain this answer? defined & explained in the simplest way possible. Besides giving the explanation of
The area of the Carnot cycle on a T-S diagram representsSelect one:a)Entropyb)efficiency of the enginec)work done in a cycled)Change in internal energyCorrect answer is option 'C'. Can you explain this answer?, a detailed solution for The area of the Carnot cycle on a T-S diagram representsSelect one:a)Entropyb)efficiency of the enginec)work done in a cycled)Change in internal energyCorrect answer is option 'C'. Can you explain this answer? has been provided alongside types of The area of the Carnot cycle on a T-S diagram representsSelect one:a)Entropyb)efficiency of the enginec)work done in a cycled)Change in internal energyCorrect answer is option 'C'. Can you explain this answer? theory, EduRev gives you an
ample number of questions to practice The area of the Carnot cycle on a T-S diagram representsSelect one:a)Entropyb)efficiency of the enginec)work done in a cycled)Change in internal energyCorrect answer is option 'C'. Can you explain this answer? tests, examples and also practice Physics tests.

|
Explore Courses for Physics exam
|

|
Signup for Free!
Signup to see your scores go up within 7 days! Learn & Practice with 1000+ FREE Notes, Videos & Tests.


