GMAT Exam > GMAT Questions > The table above gives information about the v...
Start Learning for Free
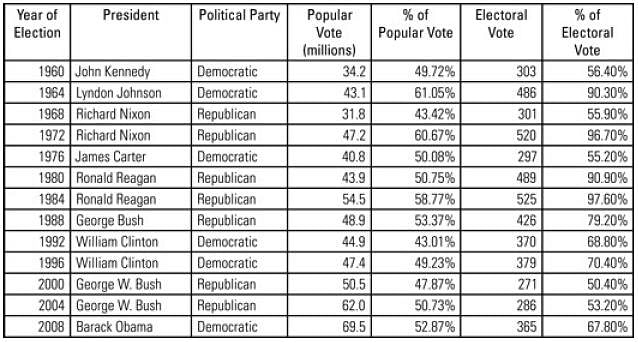
The table above gives information about the voting patterns in United States presidential elections from 1960 to 2008. In addition to giving the name and the political party of the President elected in each year, the table provides the total popular vote and electoral vote that the winner received in that election, as well as the percentage of the total vote that each figure represents.

Each column of the table can be sorted in ascending order by clicking on the word “Select” above the table and choosing, from the dropdown menu, the heading of the column on which you want the table to be sorted.
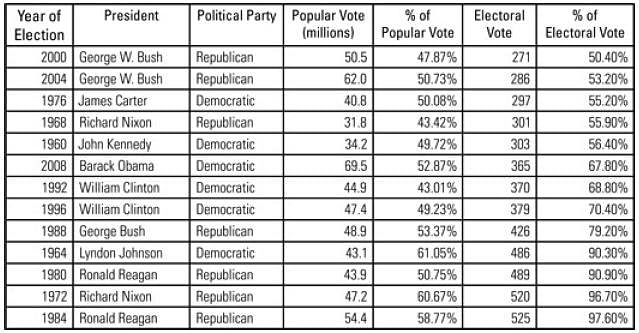
Alternate Sort 1: Electoral Vote

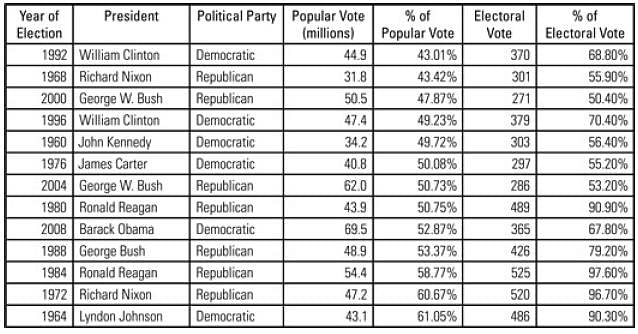
Alternate Sort 2: Percent of Popular Vote

Q. Consider each of the following statements. Does the information contained in the two emails and the memorandum support the inference as stated?
The same President was elected in the two election years in which the winner’s percentage of the popular vote and percent age of the electoral vote were most nearly equal.
- a)True
- b)False
Correct answer is option 'A'. Can you explain this answer?
| FREE This question is part of | Download PDF Attempt this Test |
Most Upvoted Answer
The table above gives information about the voting patterns in United ...
Sort the chart by % of Popular Vote to make it easy to scan down the list. Now compare the % of Popular Vote and the % of Electoral Vote columns for each line in the table. Look for those lines in which the two values are closest together. There are three elections, 2000, 1976, and 2004, in which the two values are within about 5 points of each other. In 1976, the difference was slightly greater than 5, but in 2000 and 2004 it was closer to 3 points difference, (48.87% vs. 50.4% in 2000 and 50.73% to 53.2% in 2004). So 2000 and 2004 are the two years in which the percentages differ the least. Since George W. Bush was elected both years, it is true that the same President was elected in the two years in which the percentages were the closest.
Attention GMAT Students!
To make sure you are not studying endlessly, EduRev has designed GMAT study material, with Structured Courses, Videos, & Test Series. Plus get personalized analysis, doubt solving and improvement plans to achieve a great score in GMAT.

|
Explore Courses for GMAT exam
|

|
Similar GMAT Doubts
The table above gives information about the voting patterns in United States presidential elections from 1960 to 2008. In addition to giving the name and the political party of the President elected in each year, the table provides the total popular vote and electoral vote that the winner received in that election, as well as the percentage of the total vote that each figure represents.Each column of the table can be sorted in ascending order by clicking on the word “Select” above the table and choosing, from the dropdown menu, the heading of the column on which you want the table to be sorted.Alternate Sort 1: Electoral VoteAlternate Sort 2: Percent of Popular VoteQ. Consider each of the following statements. Does the information containedin the two emails and the memorandum support the inference as stated?The same President was elected in the two electionyears in which the winner’s percentage of the popularvote and percent age of the electoral vote were mostnearly equal.a)Trueb)FalseCorrect answer is option 'A'. Can you explain this answer?
Question Description
The table above gives information about the voting patterns in United States presidential elections from 1960 to 2008. In addition to giving the name and the political party of the President elected in each year, the table provides the total popular vote and electoral vote that the winner received in that election, as well as the percentage of the total vote that each figure represents.Each column of the table can be sorted in ascending order by clicking on the word “Select” above the table and choosing, from the dropdown menu, the heading of the column on which you want the table to be sorted.Alternate Sort 1: Electoral VoteAlternate Sort 2: Percent of Popular VoteQ. Consider each of the following statements. Does the information containedin the two emails and the memorandum support the inference as stated?The same President was elected in the two electionyears in which the winner’s percentage of the popularvote and percent age of the electoral vote were mostnearly equal.a)Trueb)FalseCorrect answer is option 'A'. Can you explain this answer? for GMAT 2024 is part of GMAT preparation. The Question and answers have been prepared according to the GMAT exam syllabus. Information about The table above gives information about the voting patterns in United States presidential elections from 1960 to 2008. In addition to giving the name and the political party of the President elected in each year, the table provides the total popular vote and electoral vote that the winner received in that election, as well as the percentage of the total vote that each figure represents.Each column of the table can be sorted in ascending order by clicking on the word “Select” above the table and choosing, from the dropdown menu, the heading of the column on which you want the table to be sorted.Alternate Sort 1: Electoral VoteAlternate Sort 2: Percent of Popular VoteQ. Consider each of the following statements. Does the information containedin the two emails and the memorandum support the inference as stated?The same President was elected in the two electionyears in which the winner’s percentage of the popularvote and percent age of the electoral vote were mostnearly equal.a)Trueb)FalseCorrect answer is option 'A'. Can you explain this answer? covers all topics & solutions for GMAT 2024 Exam. Find important definitions, questions, meanings, examples, exercises and tests below for The table above gives information about the voting patterns in United States presidential elections from 1960 to 2008. In addition to giving the name and the political party of the President elected in each year, the table provides the total popular vote and electoral vote that the winner received in that election, as well as the percentage of the total vote that each figure represents.Each column of the table can be sorted in ascending order by clicking on the word “Select” above the table and choosing, from the dropdown menu, the heading of the column on which you want the table to be sorted.Alternate Sort 1: Electoral VoteAlternate Sort 2: Percent of Popular VoteQ. Consider each of the following statements. Does the information containedin the two emails and the memorandum support the inference as stated?The same President was elected in the two electionyears in which the winner’s percentage of the popularvote and percent age of the electoral vote were mostnearly equal.a)Trueb)FalseCorrect answer is option 'A'. Can you explain this answer?.
The table above gives information about the voting patterns in United States presidential elections from 1960 to 2008. In addition to giving the name and the political party of the President elected in each year, the table provides the total popular vote and electoral vote that the winner received in that election, as well as the percentage of the total vote that each figure represents.Each column of the table can be sorted in ascending order by clicking on the word “Select” above the table and choosing, from the dropdown menu, the heading of the column on which you want the table to be sorted.Alternate Sort 1: Electoral VoteAlternate Sort 2: Percent of Popular VoteQ. Consider each of the following statements. Does the information containedin the two emails and the memorandum support the inference as stated?The same President was elected in the two electionyears in which the winner’s percentage of the popularvote and percent age of the electoral vote were mostnearly equal.a)Trueb)FalseCorrect answer is option 'A'. Can you explain this answer? for GMAT 2024 is part of GMAT preparation. The Question and answers have been prepared according to the GMAT exam syllabus. Information about The table above gives information about the voting patterns in United States presidential elections from 1960 to 2008. In addition to giving the name and the political party of the President elected in each year, the table provides the total popular vote and electoral vote that the winner received in that election, as well as the percentage of the total vote that each figure represents.Each column of the table can be sorted in ascending order by clicking on the word “Select” above the table and choosing, from the dropdown menu, the heading of the column on which you want the table to be sorted.Alternate Sort 1: Electoral VoteAlternate Sort 2: Percent of Popular VoteQ. Consider each of the following statements. Does the information containedin the two emails and the memorandum support the inference as stated?The same President was elected in the two electionyears in which the winner’s percentage of the popularvote and percent age of the electoral vote were mostnearly equal.a)Trueb)FalseCorrect answer is option 'A'. Can you explain this answer? covers all topics & solutions for GMAT 2024 Exam. Find important definitions, questions, meanings, examples, exercises and tests below for The table above gives information about the voting patterns in United States presidential elections from 1960 to 2008. In addition to giving the name and the political party of the President elected in each year, the table provides the total popular vote and electoral vote that the winner received in that election, as well as the percentage of the total vote that each figure represents.Each column of the table can be sorted in ascending order by clicking on the word “Select” above the table and choosing, from the dropdown menu, the heading of the column on which you want the table to be sorted.Alternate Sort 1: Electoral VoteAlternate Sort 2: Percent of Popular VoteQ. Consider each of the following statements. Does the information containedin the two emails and the memorandum support the inference as stated?The same President was elected in the two electionyears in which the winner’s percentage of the popularvote and percent age of the electoral vote were mostnearly equal.a)Trueb)FalseCorrect answer is option 'A'. Can you explain this answer?.
Solutions for The table above gives information about the voting patterns in United States presidential elections from 1960 to 2008. In addition to giving the name and the political party of the President elected in each year, the table provides the total popular vote and electoral vote that the winner received in that election, as well as the percentage of the total vote that each figure represents.Each column of the table can be sorted in ascending order by clicking on the word “Select” above the table and choosing, from the dropdown menu, the heading of the column on which you want the table to be sorted.Alternate Sort 1: Electoral VoteAlternate Sort 2: Percent of Popular VoteQ. Consider each of the following statements. Does the information containedin the two emails and the memorandum support the inference as stated?The same President was elected in the two electionyears in which the winner’s percentage of the popularvote and percent age of the electoral vote were mostnearly equal.a)Trueb)FalseCorrect answer is option 'A'. Can you explain this answer? in English & in Hindi are available as part of our courses for GMAT.
Download more important topics, notes, lectures and mock test series for GMAT Exam by signing up for free.
Here you can find the meaning of The table above gives information about the voting patterns in United States presidential elections from 1960 to 2008. In addition to giving the name and the political party of the President elected in each year, the table provides the total popular vote and electoral vote that the winner received in that election, as well as the percentage of the total vote that each figure represents.Each column of the table can be sorted in ascending order by clicking on the word “Select” above the table and choosing, from the dropdown menu, the heading of the column on which you want the table to be sorted.Alternate Sort 1: Electoral VoteAlternate Sort 2: Percent of Popular VoteQ. Consider each of the following statements. Does the information containedin the two emails and the memorandum support the inference as stated?The same President was elected in the two electionyears in which the winner’s percentage of the popularvote and percent age of the electoral vote were mostnearly equal.a)Trueb)FalseCorrect answer is option 'A'. Can you explain this answer? defined & explained in the simplest way possible. Besides giving the explanation of
The table above gives information about the voting patterns in United States presidential elections from 1960 to 2008. In addition to giving the name and the political party of the President elected in each year, the table provides the total popular vote and electoral vote that the winner received in that election, as well as the percentage of the total vote that each figure represents.Each column of the table can be sorted in ascending order by clicking on the word “Select” above the table and choosing, from the dropdown menu, the heading of the column on which you want the table to be sorted.Alternate Sort 1: Electoral VoteAlternate Sort 2: Percent of Popular VoteQ. Consider each of the following statements. Does the information containedin the two emails and the memorandum support the inference as stated?The same President was elected in the two electionyears in which the winner’s percentage of the popularvote and percent age of the electoral vote were mostnearly equal.a)Trueb)FalseCorrect answer is option 'A'. Can you explain this answer?, a detailed solution for The table above gives information about the voting patterns in United States presidential elections from 1960 to 2008. In addition to giving the name and the political party of the President elected in each year, the table provides the total popular vote and electoral vote that the winner received in that election, as well as the percentage of the total vote that each figure represents.Each column of the table can be sorted in ascending order by clicking on the word “Select” above the table and choosing, from the dropdown menu, the heading of the column on which you want the table to be sorted.Alternate Sort 1: Electoral VoteAlternate Sort 2: Percent of Popular VoteQ. Consider each of the following statements. Does the information containedin the two emails and the memorandum support the inference as stated?The same President was elected in the two electionyears in which the winner’s percentage of the popularvote and percent age of the electoral vote were mostnearly equal.a)Trueb)FalseCorrect answer is option 'A'. Can you explain this answer? has been provided alongside types of The table above gives information about the voting patterns in United States presidential elections from 1960 to 2008. In addition to giving the name and the political party of the President elected in each year, the table provides the total popular vote and electoral vote that the winner received in that election, as well as the percentage of the total vote that each figure represents.Each column of the table can be sorted in ascending order by clicking on the word “Select” above the table and choosing, from the dropdown menu, the heading of the column on which you want the table to be sorted.Alternate Sort 1: Electoral VoteAlternate Sort 2: Percent of Popular VoteQ. Consider each of the following statements. Does the information containedin the two emails and the memorandum support the inference as stated?The same President was elected in the two electionyears in which the winner’s percentage of the popularvote and percent age of the electoral vote were mostnearly equal.a)Trueb)FalseCorrect answer is option 'A'. Can you explain this answer? theory, EduRev gives you an
ample number of questions to practice The table above gives information about the voting patterns in United States presidential elections from 1960 to 2008. In addition to giving the name and the political party of the President elected in each year, the table provides the total popular vote and electoral vote that the winner received in that election, as well as the percentage of the total vote that each figure represents.Each column of the table can be sorted in ascending order by clicking on the word “Select” above the table and choosing, from the dropdown menu, the heading of the column on which you want the table to be sorted.Alternate Sort 1: Electoral VoteAlternate Sort 2: Percent of Popular VoteQ. Consider each of the following statements. Does the information containedin the two emails and the memorandum support the inference as stated?The same President was elected in the two electionyears in which the winner’s percentage of the popularvote and percent age of the electoral vote were mostnearly equal.a)Trueb)FalseCorrect answer is option 'A'. Can you explain this answer? tests, examples and also practice GMAT tests.

|
Explore Courses for GMAT exam
|

|
Suggested Free Tests
Signup for Free!
Signup to see your scores go up within 7 days! Learn & Practice with 1000+ FREE Notes, Videos & Tests.


