GMAT Exam > GMAT Questions > The table below gives information on the tota...
Start Learning for Free
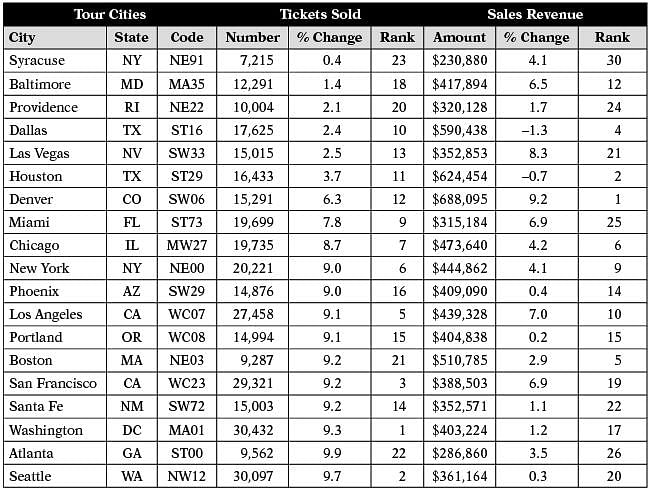
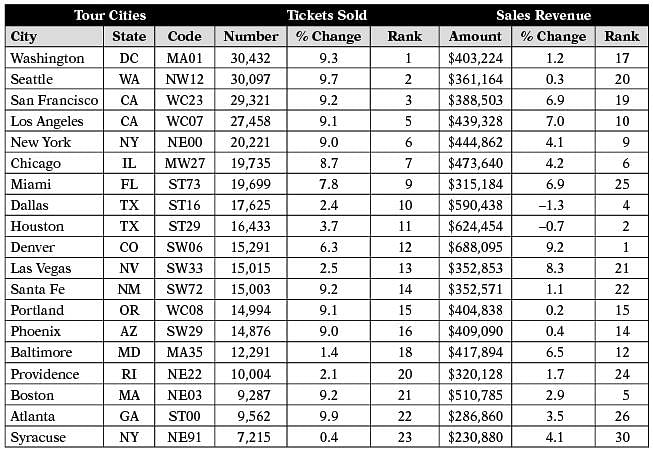
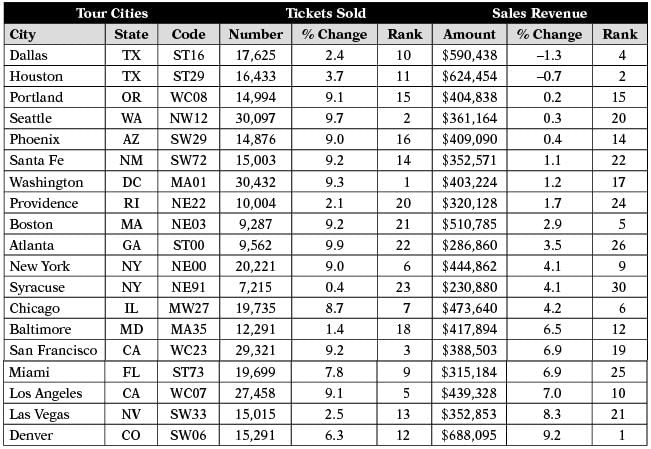
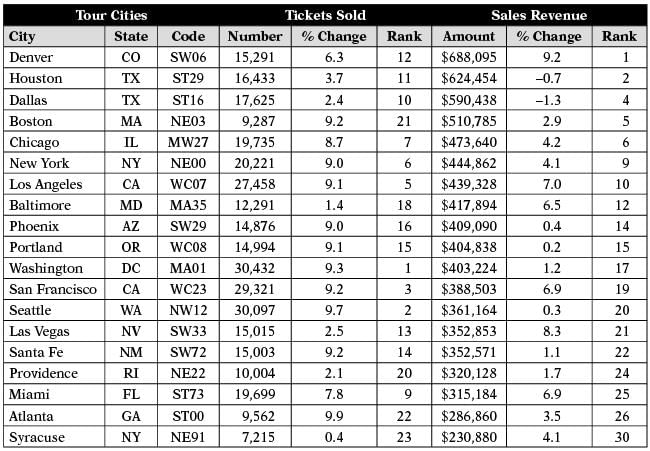
The table below gives information on the total number of tickets sold and the total sales revenue earned by a touring performance act in 2010. The 19 tour cities included in the table were among the top 30 cities on the tour in terms of both total numbers of tickets sold and total sales revenue. In addition to listing the total tickets sold and total sales revenue for each tour city, the table also gives the percent increase or decrease over the 2009 numbers and the rank of each tour city for total tickets sold and total sales revenue.
Sorted by Percent Change in Tickets Sold (Column 5)

Sorted by Rank of Tickets Sold (Column 6)

Sorted by Percent Change in Sales Revenue (Column 8)

Sorted by Rank of Sales Revenue (Column 9)

Q. Review each of the statement below. Based on information provided in the table, indicate whether the statement is true or false.
Approximately 60 percent of the tour cities in the table experienced a percentage decrease in total tickets sold from 2009 to 2010.
- a)True
- b)False
Correct answer is option 'B'. Can you explain this answer?
| FREE This question is part of | Download PDF Attempt this Test |
Most Upvoted Answer
The table below gives information on the total number of tickets sold ...
None of the tour cities in the table experienced a percentage decrease in total tickets sold from 2009 to 2010. All the cities experienced a percentage increase in total tickets sold over this period.
Attention GMAT Students!
To make sure you are not studying endlessly, EduRev has designed GMAT study material, with Structured Courses, Videos, & Test Series. Plus get personalized analysis, doubt solving and improvement plans to achieve a great score in GMAT.

|
Explore Courses for GMAT exam
|

|
Similar GMAT Doubts
The table below gives information on the total number of tickets sold and the total sales revenue earned by a touring performance act in 2010. The 19 tour cities included in the table were among the top 30 cities on the tour in terms of both total numbers of tickets sold and total sales revenue. In addition to listing the total tickets sold and total sales revenue for each tour city, the table also gives the percent increase or decrease over the 2009 numbers and the rank of each tour city for total tickets sold and total sales revenue.Sorted by Percent Change in Tickets Sold (Column 5)Sorted by Rank of Tickets Sold (Column 6)Sorted by Percent Change in Sales Revenue (Column 8)Sorted by Rank of Sales Revenue (Column 9)Q. Review each of the statement below. Based on information provided in the table, indicate whether the statement is true or false.Approximately 60 percent of the tour cities in the table experienced a percentage decrease in total tickets sold from 2009 to 2010.a)Trueb)FalseCorrect answer is option 'B'. Can you explain this answer?
Question Description
The table below gives information on the total number of tickets sold and the total sales revenue earned by a touring performance act in 2010. The 19 tour cities included in the table were among the top 30 cities on the tour in terms of both total numbers of tickets sold and total sales revenue. In addition to listing the total tickets sold and total sales revenue for each tour city, the table also gives the percent increase or decrease over the 2009 numbers and the rank of each tour city for total tickets sold and total sales revenue.Sorted by Percent Change in Tickets Sold (Column 5)Sorted by Rank of Tickets Sold (Column 6)Sorted by Percent Change in Sales Revenue (Column 8)Sorted by Rank of Sales Revenue (Column 9)Q. Review each of the statement below. Based on information provided in the table, indicate whether the statement is true or false.Approximately 60 percent of the tour cities in the table experienced a percentage decrease in total tickets sold from 2009 to 2010.a)Trueb)FalseCorrect answer is option 'B'. Can you explain this answer? for GMAT 2024 is part of GMAT preparation. The Question and answers have been prepared according to the GMAT exam syllabus. Information about The table below gives information on the total number of tickets sold and the total sales revenue earned by a touring performance act in 2010. The 19 tour cities included in the table were among the top 30 cities on the tour in terms of both total numbers of tickets sold and total sales revenue. In addition to listing the total tickets sold and total sales revenue for each tour city, the table also gives the percent increase or decrease over the 2009 numbers and the rank of each tour city for total tickets sold and total sales revenue.Sorted by Percent Change in Tickets Sold (Column 5)Sorted by Rank of Tickets Sold (Column 6)Sorted by Percent Change in Sales Revenue (Column 8)Sorted by Rank of Sales Revenue (Column 9)Q. Review each of the statement below. Based on information provided in the table, indicate whether the statement is true or false.Approximately 60 percent of the tour cities in the table experienced a percentage decrease in total tickets sold from 2009 to 2010.a)Trueb)FalseCorrect answer is option 'B'. Can you explain this answer? covers all topics & solutions for GMAT 2024 Exam. Find important definitions, questions, meanings, examples, exercises and tests below for The table below gives information on the total number of tickets sold and the total sales revenue earned by a touring performance act in 2010. The 19 tour cities included in the table were among the top 30 cities on the tour in terms of both total numbers of tickets sold and total sales revenue. In addition to listing the total tickets sold and total sales revenue for each tour city, the table also gives the percent increase or decrease over the 2009 numbers and the rank of each tour city for total tickets sold and total sales revenue.Sorted by Percent Change in Tickets Sold (Column 5)Sorted by Rank of Tickets Sold (Column 6)Sorted by Percent Change in Sales Revenue (Column 8)Sorted by Rank of Sales Revenue (Column 9)Q. Review each of the statement below. Based on information provided in the table, indicate whether the statement is true or false.Approximately 60 percent of the tour cities in the table experienced a percentage decrease in total tickets sold from 2009 to 2010.a)Trueb)FalseCorrect answer is option 'B'. Can you explain this answer?.
The table below gives information on the total number of tickets sold and the total sales revenue earned by a touring performance act in 2010. The 19 tour cities included in the table were among the top 30 cities on the tour in terms of both total numbers of tickets sold and total sales revenue. In addition to listing the total tickets sold and total sales revenue for each tour city, the table also gives the percent increase or decrease over the 2009 numbers and the rank of each tour city for total tickets sold and total sales revenue.Sorted by Percent Change in Tickets Sold (Column 5)Sorted by Rank of Tickets Sold (Column 6)Sorted by Percent Change in Sales Revenue (Column 8)Sorted by Rank of Sales Revenue (Column 9)Q. Review each of the statement below. Based on information provided in the table, indicate whether the statement is true or false.Approximately 60 percent of the tour cities in the table experienced a percentage decrease in total tickets sold from 2009 to 2010.a)Trueb)FalseCorrect answer is option 'B'. Can you explain this answer? for GMAT 2024 is part of GMAT preparation. The Question and answers have been prepared according to the GMAT exam syllabus. Information about The table below gives information on the total number of tickets sold and the total sales revenue earned by a touring performance act in 2010. The 19 tour cities included in the table were among the top 30 cities on the tour in terms of both total numbers of tickets sold and total sales revenue. In addition to listing the total tickets sold and total sales revenue for each tour city, the table also gives the percent increase or decrease over the 2009 numbers and the rank of each tour city for total tickets sold and total sales revenue.Sorted by Percent Change in Tickets Sold (Column 5)Sorted by Rank of Tickets Sold (Column 6)Sorted by Percent Change in Sales Revenue (Column 8)Sorted by Rank of Sales Revenue (Column 9)Q. Review each of the statement below. Based on information provided in the table, indicate whether the statement is true or false.Approximately 60 percent of the tour cities in the table experienced a percentage decrease in total tickets sold from 2009 to 2010.a)Trueb)FalseCorrect answer is option 'B'. Can you explain this answer? covers all topics & solutions for GMAT 2024 Exam. Find important definitions, questions, meanings, examples, exercises and tests below for The table below gives information on the total number of tickets sold and the total sales revenue earned by a touring performance act in 2010. The 19 tour cities included in the table were among the top 30 cities on the tour in terms of both total numbers of tickets sold and total sales revenue. In addition to listing the total tickets sold and total sales revenue for each tour city, the table also gives the percent increase or decrease over the 2009 numbers and the rank of each tour city for total tickets sold and total sales revenue.Sorted by Percent Change in Tickets Sold (Column 5)Sorted by Rank of Tickets Sold (Column 6)Sorted by Percent Change in Sales Revenue (Column 8)Sorted by Rank of Sales Revenue (Column 9)Q. Review each of the statement below. Based on information provided in the table, indicate whether the statement is true or false.Approximately 60 percent of the tour cities in the table experienced a percentage decrease in total tickets sold from 2009 to 2010.a)Trueb)FalseCorrect answer is option 'B'. Can you explain this answer?.
Solutions for The table below gives information on the total number of tickets sold and the total sales revenue earned by a touring performance act in 2010. The 19 tour cities included in the table were among the top 30 cities on the tour in terms of both total numbers of tickets sold and total sales revenue. In addition to listing the total tickets sold and total sales revenue for each tour city, the table also gives the percent increase or decrease over the 2009 numbers and the rank of each tour city for total tickets sold and total sales revenue.Sorted by Percent Change in Tickets Sold (Column 5)Sorted by Rank of Tickets Sold (Column 6)Sorted by Percent Change in Sales Revenue (Column 8)Sorted by Rank of Sales Revenue (Column 9)Q. Review each of the statement below. Based on information provided in the table, indicate whether the statement is true or false.Approximately 60 percent of the tour cities in the table experienced a percentage decrease in total tickets sold from 2009 to 2010.a)Trueb)FalseCorrect answer is option 'B'. Can you explain this answer? in English & in Hindi are available as part of our courses for GMAT.
Download more important topics, notes, lectures and mock test series for GMAT Exam by signing up for free.
Here you can find the meaning of The table below gives information on the total number of tickets sold and the total sales revenue earned by a touring performance act in 2010. The 19 tour cities included in the table were among the top 30 cities on the tour in terms of both total numbers of tickets sold and total sales revenue. In addition to listing the total tickets sold and total sales revenue for each tour city, the table also gives the percent increase or decrease over the 2009 numbers and the rank of each tour city for total tickets sold and total sales revenue.Sorted by Percent Change in Tickets Sold (Column 5)Sorted by Rank of Tickets Sold (Column 6)Sorted by Percent Change in Sales Revenue (Column 8)Sorted by Rank of Sales Revenue (Column 9)Q. Review each of the statement below. Based on information provided in the table, indicate whether the statement is true or false.Approximately 60 percent of the tour cities in the table experienced a percentage decrease in total tickets sold from 2009 to 2010.a)Trueb)FalseCorrect answer is option 'B'. Can you explain this answer? defined & explained in the simplest way possible. Besides giving the explanation of
The table below gives information on the total number of tickets sold and the total sales revenue earned by a touring performance act in 2010. The 19 tour cities included in the table were among the top 30 cities on the tour in terms of both total numbers of tickets sold and total sales revenue. In addition to listing the total tickets sold and total sales revenue for each tour city, the table also gives the percent increase or decrease over the 2009 numbers and the rank of each tour city for total tickets sold and total sales revenue.Sorted by Percent Change in Tickets Sold (Column 5)Sorted by Rank of Tickets Sold (Column 6)Sorted by Percent Change in Sales Revenue (Column 8)Sorted by Rank of Sales Revenue (Column 9)Q. Review each of the statement below. Based on information provided in the table, indicate whether the statement is true or false.Approximately 60 percent of the tour cities in the table experienced a percentage decrease in total tickets sold from 2009 to 2010.a)Trueb)FalseCorrect answer is option 'B'. Can you explain this answer?, a detailed solution for The table below gives information on the total number of tickets sold and the total sales revenue earned by a touring performance act in 2010. The 19 tour cities included in the table were among the top 30 cities on the tour in terms of both total numbers of tickets sold and total sales revenue. In addition to listing the total tickets sold and total sales revenue for each tour city, the table also gives the percent increase or decrease over the 2009 numbers and the rank of each tour city for total tickets sold and total sales revenue.Sorted by Percent Change in Tickets Sold (Column 5)Sorted by Rank of Tickets Sold (Column 6)Sorted by Percent Change in Sales Revenue (Column 8)Sorted by Rank of Sales Revenue (Column 9)Q. Review each of the statement below. Based on information provided in the table, indicate whether the statement is true or false.Approximately 60 percent of the tour cities in the table experienced a percentage decrease in total tickets sold from 2009 to 2010.a)Trueb)FalseCorrect answer is option 'B'. Can you explain this answer? has been provided alongside types of The table below gives information on the total number of tickets sold and the total sales revenue earned by a touring performance act in 2010. The 19 tour cities included in the table were among the top 30 cities on the tour in terms of both total numbers of tickets sold and total sales revenue. In addition to listing the total tickets sold and total sales revenue for each tour city, the table also gives the percent increase or decrease over the 2009 numbers and the rank of each tour city for total tickets sold and total sales revenue.Sorted by Percent Change in Tickets Sold (Column 5)Sorted by Rank of Tickets Sold (Column 6)Sorted by Percent Change in Sales Revenue (Column 8)Sorted by Rank of Sales Revenue (Column 9)Q. Review each of the statement below. Based on information provided in the table, indicate whether the statement is true or false.Approximately 60 percent of the tour cities in the table experienced a percentage decrease in total tickets sold from 2009 to 2010.a)Trueb)FalseCorrect answer is option 'B'. Can you explain this answer? theory, EduRev gives you an
ample number of questions to practice The table below gives information on the total number of tickets sold and the total sales revenue earned by a touring performance act in 2010. The 19 tour cities included in the table were among the top 30 cities on the tour in terms of both total numbers of tickets sold and total sales revenue. In addition to listing the total tickets sold and total sales revenue for each tour city, the table also gives the percent increase or decrease over the 2009 numbers and the rank of each tour city for total tickets sold and total sales revenue.Sorted by Percent Change in Tickets Sold (Column 5)Sorted by Rank of Tickets Sold (Column 6)Sorted by Percent Change in Sales Revenue (Column 8)Sorted by Rank of Sales Revenue (Column 9)Q. Review each of the statement below. Based on information provided in the table, indicate whether the statement is true or false.Approximately 60 percent of the tour cities in the table experienced a percentage decrease in total tickets sold from 2009 to 2010.a)Trueb)FalseCorrect answer is option 'B'. Can you explain this answer? tests, examples and also practice GMAT tests.

|
Explore Courses for GMAT exam
|

|
Suggested Free Tests
Signup for Free!
Signup to see your scores go up within 7 days! Learn & Practice with 1000+ FREE Notes, Videos & Tests.


