


CLAT Exam > CLAT Questions > Instructions: For the following three questio...
Start Learning for Free
Instructions:
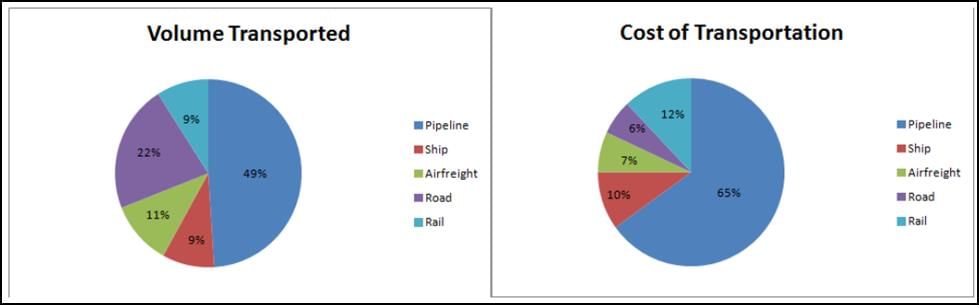
For the following three questions: Answer the questions based on the pie charts given below. Chart 1 shows the distribution of 12 million tonnes of crude oil transported through different modes over a specific period of time. Chart 2 shows the distribution of the cost of transporting this crude oil. The total cost was Rs. 30 million.
Q. If the costs per tonne of transport by ship, air and road are represented by P, Q and R respectively, which of the following is true?
- a)R > Q > P
- b)P > Q > R
- c)P > R > Q
- d)R > P > Q
Correct answer is option 'B'. Can you explain this answer?

Verified Answer
Instructions: For the following three questions: Answer the questions ...
If the costs per tonne of transport by ship, air and road are represented by P, Q and R respectively.
P = 10/9
Q = 7/11
R = 6/22
Q = 7/11
R = 6/22
We can see that P>Q and Q>R and P>R.

|
Explore Courses for CLAT exam
|
|
Top Courses for CLATView all


Question Description
Instructions: For the following three questions: Answer the questions based on the pie charts given below. Chart 1 shows the distribution of 12 million tonnes of crude oil transported through different modes over a specific period of time. Chart 2 shows the distribution of the cost of transporting this crude oil. The total cost was Rs. 30 million.Q. If the costs per tonne of transport by ship, air and road are represented by P, Q and R respectively, which of the following is true?a)R > Q > Pb)P > Q > Rc)P > R > Qd)R > P > QCorrect answer is option 'B'. Can you explain this answer? for CLAT 2025 is part of CLAT preparation. The Question and answers have been prepared according to the CLAT exam syllabus. Information about Instructions: For the following three questions: Answer the questions based on the pie charts given below. Chart 1 shows the distribution of 12 million tonnes of crude oil transported through different modes over a specific period of time. Chart 2 shows the distribution of the cost of transporting this crude oil. The total cost was Rs. 30 million.Q. If the costs per tonne of transport by ship, air and road are represented by P, Q and R respectively, which of the following is true?a)R > Q > Pb)P > Q > Rc)P > R > Qd)R > P > QCorrect answer is option 'B'. Can you explain this answer? covers all topics & solutions for CLAT 2025 Exam. Find important definitions, questions, meanings, examples, exercises and tests below for Instructions: For the following three questions: Answer the questions based on the pie charts given below. Chart 1 shows the distribution of 12 million tonnes of crude oil transported through different modes over a specific period of time. Chart 2 shows the distribution of the cost of transporting this crude oil. The total cost was Rs. 30 million.Q. If the costs per tonne of transport by ship, air and road are represented by P, Q and R respectively, which of the following is true?a)R > Q > Pb)P > Q > Rc)P > R > Qd)R > P > QCorrect answer is option 'B'. Can you explain this answer?.
Instructions: For the following three questions: Answer the questions based on the pie charts given below. Chart 1 shows the distribution of 12 million tonnes of crude oil transported through different modes over a specific period of time. Chart 2 shows the distribution of the cost of transporting this crude oil. The total cost was Rs. 30 million.Q. If the costs per tonne of transport by ship, air and road are represented by P, Q and R respectively, which of the following is true?a)R > Q > Pb)P > Q > Rc)P > R > Qd)R > P > QCorrect answer is option 'B'. Can you explain this answer? for CLAT 2025 is part of CLAT preparation. The Question and answers have been prepared according to the CLAT exam syllabus. Information about Instructions: For the following three questions: Answer the questions based on the pie charts given below. Chart 1 shows the distribution of 12 million tonnes of crude oil transported through different modes over a specific period of time. Chart 2 shows the distribution of the cost of transporting this crude oil. The total cost was Rs. 30 million.Q. If the costs per tonne of transport by ship, air and road are represented by P, Q and R respectively, which of the following is true?a)R > Q > Pb)P > Q > Rc)P > R > Qd)R > P > QCorrect answer is option 'B'. Can you explain this answer? covers all topics & solutions for CLAT 2025 Exam. Find important definitions, questions, meanings, examples, exercises and tests below for Instructions: For the following three questions: Answer the questions based on the pie charts given below. Chart 1 shows the distribution of 12 million tonnes of crude oil transported through different modes over a specific period of time. Chart 2 shows the distribution of the cost of transporting this crude oil. The total cost was Rs. 30 million.Q. If the costs per tonne of transport by ship, air and road are represented by P, Q and R respectively, which of the following is true?a)R > Q > Pb)P > Q > Rc)P > R > Qd)R > P > QCorrect answer is option 'B'. Can you explain this answer?.
Solutions for Instructions: For the following three questions: Answer the questions based on the pie charts given below. Chart 1 shows the distribution of 12 million tonnes of crude oil transported through different modes over a specific period of time. Chart 2 shows the distribution of the cost of transporting this crude oil. The total cost was Rs. 30 million.Q. If the costs per tonne of transport by ship, air and road are represented by P, Q and R respectively, which of the following is true?a)R > Q > Pb)P > Q > Rc)P > R > Qd)R > P > QCorrect answer is option 'B'. Can you explain this answer? in English & in Hindi are available as part of our courses for CLAT.
Download more important topics, notes, lectures and mock test series for CLAT Exam by signing up for free.
Here you can find the meaning of Instructions: For the following three questions: Answer the questions based on the pie charts given below. Chart 1 shows the distribution of 12 million tonnes of crude oil transported through different modes over a specific period of time. Chart 2 shows the distribution of the cost of transporting this crude oil. The total cost was Rs. 30 million.Q. If the costs per tonne of transport by ship, air and road are represented by P, Q and R respectively, which of the following is true?a)R > Q > Pb)P > Q > Rc)P > R > Qd)R > P > QCorrect answer is option 'B'. Can you explain this answer? defined & explained in the simplest way possible. Besides giving the explanation of
Instructions: For the following three questions: Answer the questions based on the pie charts given below. Chart 1 shows the distribution of 12 million tonnes of crude oil transported through different modes over a specific period of time. Chart 2 shows the distribution of the cost of transporting this crude oil. The total cost was Rs. 30 million.Q. If the costs per tonne of transport by ship, air and road are represented by P, Q and R respectively, which of the following is true?a)R > Q > Pb)P > Q > Rc)P > R > Qd)R > P > QCorrect answer is option 'B'. Can you explain this answer?, a detailed solution for Instructions: For the following three questions: Answer the questions based on the pie charts given below. Chart 1 shows the distribution of 12 million tonnes of crude oil transported through different modes over a specific period of time. Chart 2 shows the distribution of the cost of transporting this crude oil. The total cost was Rs. 30 million.Q. If the costs per tonne of transport by ship, air and road are represented by P, Q and R respectively, which of the following is true?a)R > Q > Pb)P > Q > Rc)P > R > Qd)R > P > QCorrect answer is option 'B'. Can you explain this answer? has been provided alongside types of Instructions: For the following three questions: Answer the questions based on the pie charts given below. Chart 1 shows the distribution of 12 million tonnes of crude oil transported through different modes over a specific period of time. Chart 2 shows the distribution of the cost of transporting this crude oil. The total cost was Rs. 30 million.Q. If the costs per tonne of transport by ship, air and road are represented by P, Q and R respectively, which of the following is true?a)R > Q > Pb)P > Q > Rc)P > R > Qd)R > P > QCorrect answer is option 'B'. Can you explain this answer? theory, EduRev gives you an
ample number of questions to practice Instructions: For the following three questions: Answer the questions based on the pie charts given below. Chart 1 shows the distribution of 12 million tonnes of crude oil transported through different modes over a specific period of time. Chart 2 shows the distribution of the cost of transporting this crude oil. The total cost was Rs. 30 million.Q. If the costs per tonne of transport by ship, air and road are represented by P, Q and R respectively, which of the following is true?a)R > Q > Pb)P > Q > Rc)P > R > Qd)R > P > QCorrect answer is option 'B'. Can you explain this answer? tests, examples and also practice CLAT tests.
|
|
Explore Courses for CLAT exam
|
|

Signup for Free!
Signup to see your scores go up within 7 days! Learn & Practice with 1000+ FREE Notes, Videos & Tests.
|
© EduRev
|
Education Revolution
|


|


Signup on EduRev and stay on top of your study goals
10M+ students crushing their study goals daily