Bar Chart: Shortcuts & Tricks | Quantitative Techniques for CLAT PDF Download
Tips and Tricks
- Before you solve any of the questions , first you have to understand what the bar graph is trying to say. Make the habit of scanning the heading firsts.
- You have to understand what is on the x-axis and y-axis and what is the relation between two in terms of length bars.
- These type of questions are pretty easy to solve. Just interpret the data in your mind. Check the length of bars . The answers will come surely.
- Sometimes the calculations of one question will help to calculate the calculations of some other question.
Important Points
- Read the questions along with the instruction carefully.
- Use Approximation in Calculations.
- Effective analysis of given data.
- Do not assume anything other than data provided.
- Skip unnecessary calculations.
- Accuracy is the key factor.
- Clear the fundamentals of DI. DI questions are based on Averages , Percentage and Ratio and Proportion concepts .
Examples
Common Data for Question 1 to 5:
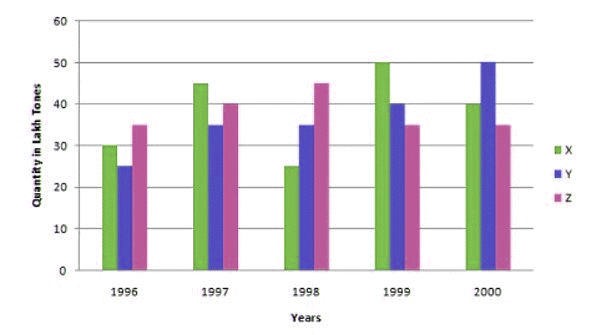
Production of paper (in lakh tonnes) by three companies X, Y and Z owned by Ratan Tata over the years is given below in a graph. Study the graph and answer the questions that follow.
In X- axis year is given and in Y- axis Quantity in Lakh Tones is given.

Sol:
In 1999 Production of Paper X = 50
In 1999 Production of Paper Y = 40
Required Percentage 
Q2: What is the difference between the production of company Z in 1998 and company Y in 1996?
(a) 2,00,000 tons
(b) 20,00,000 tons
(c) 20,000 tons
(d) 2,00,00,000 tons
Ans: b
Sol: Required difference
= [(45 – 25) x 1,00,000] tons
= 20,00,000 tons.
(a) 1:1
Sol:
Average production of company X in the period 1998-2000 =  lakh tons.
Average production of company Y in the period 1998-2000 =  lakh tons.
Required ratio = 
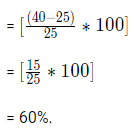
Q4: What is the percentage increase in the production of Company Y from 1996 to 1999?
(a) 30%
(b) 60%
(c) 50%
(d) 45%
Ans: b
Sol: Percentage increase in the production of Company Y from 1996 to 1999

|
49 videos|179 docs|73 tests
|


