Diagram Based Questions: Our Environment | Science Class 10 PDF Download

Q1: Answer the following questions based on the diagram given below: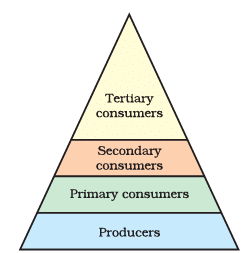
(i) In the trophic levels diagram, what are the primary producers, and what is their main source of energy?
Ans: The primary producers are typically plants or algae, and their main source of energy is sunlight, which they use for photosynthesis.
(ii) What is the role of herbivores in the trophic levels? Give an example of a herbivore.
Ans: Herbivores are consumers that feed on primary producers (plants or algae). An example of a herbivore is a rabbit, which eats plants.
(iii) Explain the concept of a food chain using the trophic levels diagram. Provide an example of a food chain.
Ans: A food chain is a sequence of organisms in which each one is eaten by the next member in the chain. For example, in a grassland ecosystem, a food chain might be: Grass (producer) -> Grasshopper (herbivore) -> Snake (carnivore) -> Hawk (top carnivore).
(iv) What do we call an organism that feeds on both plants and animals in the trophic levels diagram?
Ans: An organism that feeds on both plants and animals in the trophic levels diagram is called an omnivore. Humans are examples of omnivores because we eat both plants and animals.
(v) How does energy flow in the trophic levels diagram? Explain why the number of top carnivores is usually much smaller than the number of primary producers.
Ans: Energy flows from one trophic level to another in the form of food. However, not all energy is transferred; some is lost as heat at each level. This limits the amount of energy available to higher trophic levels. As a result, the number of top carnivores is much smaller because there is less energy available to support a large population of top predators compared to primary producers. This is known as the 10% rule, where only about 10% of the energy is passed on to the next trophic level.
Q2: Answer the following questions based on the diagram given below: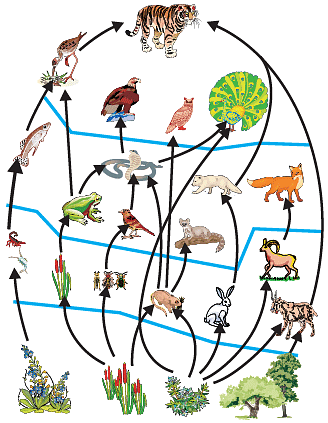
(i) What is a food web, and how does it differ from a food chain?
Ans: A food web is a network of interconnected food chains in an ecosystem, showing how different organisms are linked by their feeding relationships. In contrast, a food chain represents a linear sequence of organisms, where one organism eats another.
(ii) Why are decomposers important in a food web?
Ans: Decomposers are essential in a food web because they break down dead organisms and organic matter, returning nutrients to the soil. This recycling of nutrients ensures that the ecosystem remains healthy and sustainable.
(iii) Explain the role of producers in a food web. Give an example of a producer.
Ans: Producers are organisms that make their own food through photosynthesis, using sunlight to convert carbon dioxide and water into glucose. An example of a producer is a green plant.
(iv) What happens when a predator in a food web becomes extinct?
Ans: When a predator in a food web becomes extinct, it can have a cascading effect on the entire ecosystem. The population of its prey may increase, leading to overgrazing or overpopulation, which can disrupt the balance in the ecosystem.
(v) How does the energy flow in a food web?
Ans: Energy flows through a food web in a unidirectional manner, starting with the producers (plants) that capture sunlight energy. Herbivores eat the producers, and then carnivores eat the herbivores. As each organism consumes the one below it, some energy is lost as heat at each level, making the energy pyramid narrower as it goes up the food chain.
Q3: Answer the following questions based on the diagram given below:
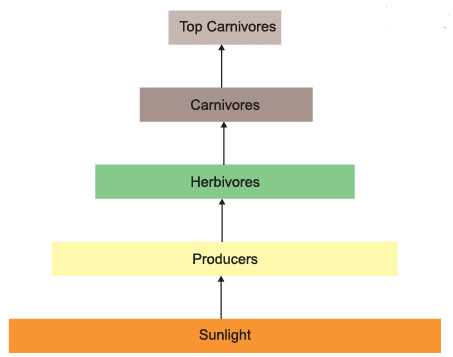
(i) In the energy flow diagram of an ecosystem, what is usually represented at the bottom of the diagram, and why is it placed there?
Ans: The producers, such as plants, are typically shown at the bottom of the energy flow diagram because they are the primary source of energy in an ecosystem. They capture energy from the sun through photosynthesis and serve as the foundation of the food chain.
(ii) How is energy transferred from one trophic level to another in an ecosystem, as shown in the diagram?
Ans: Energy is transferred from one trophic level to another through the consumption of organisms. Herbivores eat plants, and carnivores eat herbivores. This transfer of energy occurs as organisms are eaten and digested, with some energy being passed along to the next trophic level.
(iii) Explain the role of decomposers in the energy flow within an ecosystem based on the diagram.
Ans: Decomposers, such as bacteria and fungi, play a crucial role in recycling nutrients and energy in an ecosystem. They break down dead organisms and organic matter, releasing nutrients back into the environment. This process allows energy to be returned to the ecosystem, completing the energy flow cycle.
(iv) What happens to the amount of energy as it moves up the trophic levels in the ecosystem, as depicted in the diagram?
Ans: As energy moves up the trophic levels in an ecosystem, it decreases. This is because some energy is lost as heat during metabolic processes, and only a portion of the energy from one trophic level is transferred to the next. As a result, there is less energy available to higher trophic levels.
(v) How does the concept of a food chain relate to the energy flow in an ecosystem, as illustrated in the diagram?
Ans: A food chain is a simplified representation of the energy flow within an ecosystem. It shows the sequence of organisms where each one is consumed by the next in line. The energy flows from producers to primary consumers (herbivores), then to secondary consumers (carnivores), and so on. The diagram represents these relationships and the transfer of energy from one organism to another in a linear fashion.
|
80 videos|567 docs|80 tests
|
FAQs on Diagram Based Questions: Our Environment - Science Class 10
| 1. What are some important diagrams related to our environment? |  |
| 2. How does the carbon cycle diagram explain the movement of carbon in our environment? | |
| 3. What does the water cycle diagram depict and how does it work? | |
| 4. How does the food chain diagram represent the flow of energy in an ecosystem? | |
| 5. What does the pollution diagram illustrate and what are its main components? | |


Sample Paper
,Objective type Questions
,Diagram Based Questions: Our Environment | Science Class 10
,MCQs
,Viva Questions
,practice quizzes
,past year papers
,Important questions
,mock tests for examination
,video lectures
,ppt
,Previous Year Questions with Solutions
,Exam
,Summary
,Extra Questions
,shortcuts and tricks
,Free
,study material
,Semester Notes
,Diagram Based Questions: Our Environment | Science Class 10
,Diagram Based Questions: Our Environment | Science Class 10
;


Diagram Based Questions: Our Environment Free PDF Download
Importance of Diagram Based Questions: Our Environment
Diagram Based Questions: Our Environment Notes
Diagram Based Questions: Our Environment Class 10
Study Diagram Based Questions: Our Environment on the App
|
© EduRev
|
Education Revolution
|


|


