Disparities in Education | Sociology Optional for UPSC (Notes) PDF Download
Education in India
- Education has been assigned high priority in the development policy of India. The provision of free and compulsory education to all children in the age group 6-14 years is also a fundamental right guaranteed by the Constitution of India. The National Policy on Education (1986) was an important landmark in the journey towards this Constitutional commitment. The policy discourse in this context received a renewed impetus with the adoption of Millennium Development Goals in 2000. The demand for universalisation of elementary education was finally endorsed with the enactment of the Right of Children to Free and Compulsory Education Act in 2009.
- However, India has not shown appreciable progress in education sector. In the last ten years, school enrolment has increased and more adults have been declared (functionally) literate than ever before; yet more than one third of the population continues to remain deprived of education. The age -old disparities stemming from class, caste and gender also manifest in the educational attainments among people across the country. In fact, unequal access to educational opportunities for people from the vulnerable sections has emerged as a major challenge for the policymakers in the country.
 Gaps in literacy rate across gender and social groups has declined substantially over time, but sizable differences still remain.
Public Provisioning for Education: An Instrument to Address Inequality
- Provisioning for education, both for its coverage as well as quality, requires significant amount of financial resources. Given the crucial importance that education plays in the development of a society and a country’s economy, public provisioning for education has been recognised as an effective strategy for ensuring inclusive education.
- In 1966 the Kothari Commission report was probably the first of its kind to review the country’s policies recognising the significance of adequate public investment in education; and it also made an attempt to quantify the level of investment that would achieve the target of universalisation of education by 1986.
- The total public expenditure (Centre and States combined) on Education as a proportion of GDP in India was around 3 percent in the year 2004-05. It has increased over the last decade, but the pace of increase has been very modest. The present level of total public spending on education (including the expenditure of all Education departments at the Centre and the States and also the other departments that spend on education) works out to 4 percent of GDP in 2012-13 BE.
- This proportion of 4 percent of GDP falls much short of the 6 percent of GDP recommended by the Kothari Commission, as a benchmark for total public spending on education to be reached by 1986.
Figure 1b: Public Expenditure on Education as % of GDP in BRICSAM countries and Indonesia (2011)
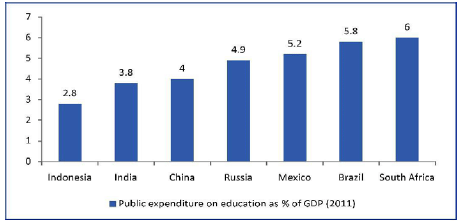
The picture looks more dismal, if the figures for India are compared with the rest of the BRICSAM1 countries. Except for Indonesia, all other BRICSAM countries spend much higher amounts as public spending on education. Brazil, one of the examples among developing countries having achieved universal education, spends nearly 6 percent of GDP on education.
Educational Achievements of India: An Inter and Intra Country Comparison
- One of the reasons for the relatively lower level of educational achievement in India is its lower base in terms of literacy. Figure 2 shows that the position of India among BRICS countries (Brazil, Russia, India, China and South Africa) in terms of adult literacy rate is not very impressive.
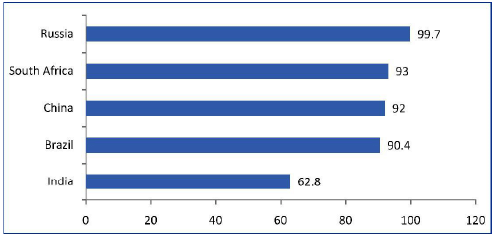 Figure 2: Adult Literacy Rate for BRICS Countries
- Figure 2 clearly shows that Russia has achieved universal adult literacy. China with the largest population, has adult literacy rate of over 92 percent; whereas India ranks last in the literacy ladder. Further, the literacy gap between India and the rest of the BRICS countries is 30 percentage points or higher.
Figure 4: Literacy Rate by Social Group, Gender and Place of Residence in India, 2011 (in %)
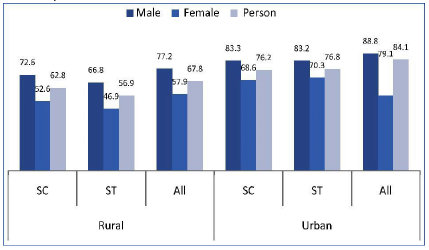
- Aggregated literacy figures at the national level give us a partial picture. It does not reveal the different levels and types of disparities that exist in this vast country. The disparity is stark at the State level where the gap between the lowest (Bihar) and the highest (Kerala) literacy State is substantial.
- Gaps in literacy rate across gender and social groups has declined substantially over time. Yet a gender gap of 20 percentage points in rural India and about 10 percentage points in urban India still persist (Figure 4). Again, the literacy rate for urban female is 20 percentage points higher than rural female. The disparities are wider for girls belonging to SC/ST communities. Clearly, the literacy statistics portray various dimension of inequality—ruralurban, male-female, SC-ST. It also reveals that differences in literacy growth rates across these categories of the population are reducing at a slow pace.
Education: A Progress Report
- India has made notable progress in increasing the Gross Enrolment Ratio (GER). It has achieved universal enrolment in primary (I-V) education (116 percent) and near universal enrolment (85.5 percent) in upper primary education (VI-VIII) both for boys and girls. While these are significant achievements, the anomaly is that GER starts falling with increase in the level of education. It is evident from the fact that at t he secondary level (IXX) the GER is 65 percent, and at higher secondary (XI-XII) level it is only 39 percent (MHRD, 2013).
- The figures for access, attendance, retention and school completion rate are much lower than enrolment and it significantly varies between a range of sub groups like girls and boys, upper caste and lower caste, urban poor and urban rich, Scheduled Castes and Scheduled Tribes, etc. Despite the strong argument that returns to education increase with rising education levels, there exists a paradoxical situation in India where participation at the secondary and higer level of education has been declining.
- Out of every 100 children who enroll in grade I, about 30 drop out before reaching grade V and more than 40 before reaching grade VIII. It is also important to note that the rate of dropout is less among girls in primary education but at the upper primary level, it is higher compared to the dropout rates for boys. Nearly 45 percent of SC children and 55 percent of ST children drop out from school before completing grade VIII and this proportion increases to 60 percent for SC children and 70 percent for ST children before reaching Grade X (Figure 5).
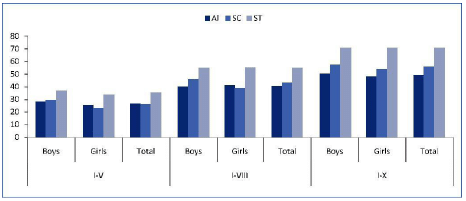 Figure 5: Dropout Rates in School Education in India, 2010-11 (in %)
Why do Children Drop out from Schools?
An analysis of the determinants of participation (or non-participation) in schooling reveals three sets of influencing factors: (a) household economic factors (b) school environment (including quality of physical and human infrastructure and quality of instruction) and (c) social and cultural/traditional factors (Tilak, 20023).
Economic Constraints
Economic factors constitute the singlemost important reason for children not attending or dropping out of school. The need to spend on education necessarily constrain poor families in sending their children to schools. Further, even in case of governments offering free education, children are kept out of school to supplement household income. Boys, in particular, are withdrawn from school for wage work and for participation in other economic activities, whereas girls are withdrawn to attend to and perform domestic activities (NSSO, 2010).
Persistence of Quality Gap in Physical Infrastructure of Government Schools:
- Inspite of significant expansion of schooling facilities, some basic deficiencies continue to affect Indian schooling system. A large number of government schools do not have some of the basic infrastructural facilities like school buildings, additional classrooms, drinking water, toilets, ramps, electricity and so on. Sometimes, even when the infrastructure is in place, they are not functional. Only eight percent schools comply with all the infrastructure norms mentioned under the RTE Act.
- The infrastructure bottlenecks, especially, inadequate number of upper primary and secondary schools in the vicinity and absence of girls’ toilets are the two major reasons for school dropouts especially among girls. There are also concerns relating to quality of curriculum, assessment of learning achievement, efficacy of school management and above all shortage of trained teachers and teacher absenteeism.
Shortage of Qualified Teachers
At present there are 8.3 percent primary schools with single teachers. Under the SSA 19.8 lakh posts for teachers were sanctioned till 2012-13; but only over 14 lakh were recruited up to 2013. Among the existing teachers in government schools, about 20 percent teachers are untrained and the proportion of trained and qualified teachers has been almost stagnant for the last five years (RTE State Report, MHRD, 2013).
Contractual vs. Regular Teachers: Debate over Quality of Education
- With an objective of universalisation of elementary education within a limited resource envelope, the Central Government as well as many States have carried out major changes in teacher recruitment policy over the last decade. Launching of the District Primary Education Programme (DPEP) in the 1990s and subsequently the Sarva Shiksha Abhiyan (SSA) brought in this new dimension to the discourse as well as practices related to teacher management in school education. Instead of regular cadre teachers, the policy reform veered towards recruitment of contractual teachers, popularly known as ‘para teachers’, with significantly reduced salaries and benefits.
- In the last 15 years, there has been an enormous expansion in the cadre of para teachers in many States. According to District Information System for Education (DISE) data, in 2013-14, total number of contractual teachers at the elementary level stood at 5.01 lakh. Among them merely 56 percent have professional teacher training.
- The significant presence of contract teachers has raised questions about the impact on the quality of education being imparted. This concern is largely due to the lower educational qualifications required for someone to become a contract teacher and the little or no preservice and in-service training that they receive. On the other hand, weak accountability of regular teachers as reflected in their high absence rates and low teaching activity when present in schools, have also been an issue of serious concern.
- There is also a debate around the issue of the impact of performance-based contracts that para teachers are given. Such contracts can be cancelled if their performance is adjudged dissatisfactory by the village education committee or other local community bodies, which also have the authority to hire them. One view is that such contracts provide stronger motivation to perform. The other view holds that lack of job security and lesser salary can actually decrease motivation and lead to absenteeism. On the whole, whatever be the debate on regular vs. contractual teacher, it is clear that the government’s short term cost efficient policy measures have not led to any improvement in learning outcome.
Quality Gap in Learning Achievements
- Attending classes and being promoted in the educational ladder do not necessarily translate into equal participation in the education process. Even after five years of implementation of the RTE Act, it has been argued that children are still dropping out of school, not for labour, but because they are not learning anything in schools (UNICEF report)4.
- Learning outcomes in India are dismal both when compared globally as well as when compared across years. Programme for International Student Assessment (PISA) result (Figure 6) shows the two most educationally advanced States of India, Himachal Pradesh and Tamil Nadu, ranked lowest in both reading and mathematical ability among the BRICSAM countries (72nd and 73rd out of a total of 74 tested entities for which results were reported).
- According to Annual Status of Education Report (ASER) 2013, only 41 percent of the children in standard V in government schools can read the texts of standard II.
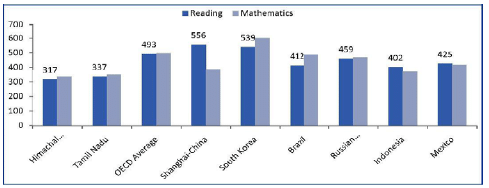 Figure 6: Performance of BRICSAM Countries and Indonesia in Learning Ability (Score in Mean value) - 2009
Bias towards Private Schools
- The deteriorating quality of learning in government schools is currently one of the most discussed issues in the realm of public provisioning for the education sector. This has also created a bias towards private schooling with the perception that quality of learning would be better in private schools. However, as per the ASER data, the quality of learning in private schools is also deteriorating. Inspite of this, parents continue to send their children to private schools that charge fees instead of public schools which are free of cost (Muralidharan).
- As a result, thousands of private schools have sprung up across rural India in every State in the last decade and the share of children going to private elementary schools has increased from 19 percent in 2006 to 31 percent in 2014 (ASER, 2014).
- Average expenditure on education in private aided schools is almost 5 times higher than expenditure in government schools or schools run by the local bodies. This disparity becomes 7 times higher in case of private unaided schools (NSS, 2010). The existence of pre-primary classes- a distinctive feature of private schools- is another factor that draw parents to private school (PROBE Revisited Report, 2006).
- However, due to unsustainable financial implications, children are offen pulled out of school within a short period. Considering such high cost of schooling, private school education is often provided to the male child rather than the female child so that the boys are enrolled in private schools and girls in government schools (PROBE Revisited Report, 2006). Thus, the surge in private schooling suggests not only aggravating inequality in terms of quality of education but also severe socio-economic inequalities.
- Further, the prevailing policy itself has promoted inequity among different kinds of governments schools. The inbuilt differences in the Model Schools and Kendriya Vidyalaya, Sarvodaya Schools and Kasturba Gandhi Balika Vidyalaya, has ingrained a hierarchy of high and low achieving schools; the government spends substantially higher amount in the special/higher category schools as compared to normal government run schools.
- In the context of inequality in both educational opportunities and outcomes, Civil Society Organisations (CSO) can play a greater role by undertaking appropriate policy research and advocacy in support of universal, free, compulsory, quality schooling and extending opportunities for lifelong learning. At the same time, CSOs can also play a significant role in promoting transparency and accountability measures in schools.
|
120 videos|427 docs
|


