Economic Development - 4 | Current Affairs & Hindu Analysis: Daily, Weekly & Monthly - UPSC PDF Download

Celebrating 10 Years of 'Make in India'
The 'Make in India' initiative, launched on September 25, 2014, has recently completed a decade of promoting Indian manufacturing and attracting foreign investment.
Make in India has completed 10 years, showcasing India's commitment to boosting manufacturing and attracting global investors. The initiative aims to transform India into a global manufacturing hub and has seen significant progress in various sectors.
About 'Make in India'
Aim: To transform India into a global design and manufacturing hub.
Objectives:
- Increase the growth rate of Indian industry to 12-14% per year.
- Create 100 million industrial jobs by 2022.
- Raise the manufacturing sector's share to 25% of GDP by 2022 (revised to 2025).
Sectors: Currently focuses on 27 sectors under 'Make in India 2.0,' launched in 2021.
Pillars of 'Make in India'
- New Processes: Emphasis on 'Ease of Doing Business' to promote entrepreneurship.
- New Infrastructure: Development of industrial corridors and smart cities with advanced technology and communication.
- New Sectors: Opening up Foreign Direct Investment (FDI) in sectors like Defence Production, Insurance, Medical Devices, Construction, and Railway infrastructure.
- New Mindset: The government acts as a facilitator for businesses.
Major Achievements under 'Make in India'
- Manufacturing Growth: India is now the second-largest mobile manufacturer globally, producing 99% of smartphones domestically.
- Renewable Energy: India is the 4th largest renewable energy producer in the world.
- Improved Ease of Doing Business: India improved its ranking from 142nd in 2014 to 63rd in the World Bank's Doing Business Report (DBR) 2020.
- Corporate Tax Rates: India now has one of the lowest corporate tax rates in Asia, boosting its global competitiveness.
- Increased FDI Inflows: FDI inflows rose from approximately $45 billion in 2015 to $85 billion in 2022.
- Merchandise Exports: Exports reached around $437 billion in 2024, with significant growth in high-end products like pharmaceuticals and vaccines.
- Defence Exports: Major defence platforms such as the Dhanush Artillery Gun, MBT Arjun, and LCA Tejas have been developed and exported.
- Global Innovation Index: India improved its ranking by 42 spots since 2015, currently ranked 39th, reflecting enhanced competitiveness in research and development.
- Sustainable Growth Initiatives: Initiatives like the National Green Hydrogen Mission aim to create jobs and reduce reliance on imported natural gas and ammonia.
Concerns with 'Make in India'
- Manufacturing Sector Contribution: The manufacturing sector's contribution to GDP remains stagnant at 17.7% as of 2023, falling short of the 25% target.
- Job Creation: The manufacturing workforce has declined from 51 million in 2017 to 35 million in 2023, despite the goal of creating 100 million jobs.
- Real GVA Slowdown: The growth rate of manufacturing real gross value added (GVA) has slowed from approximately 8% in 2012 to 5.5% in 2023.
- Declining Investment Rates: The rate of productive investment (Gross Capital Formation) has decreased from 39.1% in 2008 to 32.2% in 2023.
- Limited Success of FDI-Driven Development: FDI as a percentage of GDP has averaged around 1.8% from 2015 to 2023, down from 2.1% in the previous decade.
- Concentration of FDI: The majority of FDI has been concentrated in nine sectors, primarily services, while manufacturing sectors have received only 30% of total FDI.
- Weakening Export Performance: Merchandise exports have fallen from approximately 10% of GDP in 2013-14 to 8% in 2022-23, despite substantial FDI inflows.
- Viability of PLI Schemes: The growing costs of Production-Linked Incentive (PLI) schemes, such as the Micron microprocessor factory in Gujarat, raise concerns about their sustainability.
Way Forward
- Improving Capabilities: Emphasizing the adoption of new technologies, rapid skill development, and strengthening the education ecosystem.
- Encouraging Entrepreneurial Spirit: Creating conditions that foster entrepreneurship among well-educated individuals, leveraging the large pool of STEM graduates in India.
- Enhancing Innovation Ecosystem: Promoting collaboration between academia, industry, and government to translate knowledge into economic value. Establishing institutions dedicated to scouting early-stage intellectual property from academia.
- Strengthening Research Foundations: Initiatives like the Anushandhan National Research Foundation (ANRF) to provide strategic direction for scientific research in the country.
Conclusion
The completion of 10 years of the 'Make in India' initiative marks a significant milestone in India's journey towards becoming a global manufacturing hub. While there have been notable achievements in various sectors, challenges remain that need to be addressed for sustained growth and development. The focus on improving capabilities, fostering innovation, and encouraging entrepreneurship will be crucial in the coming years to realize the full potential of 'Make in India'.
Periodic Labour Force Survey (PLFS) Report 2023-24
The Periodic Labour Force Survey (PLFS) report for 2023-24 presents an overview of employment and unemployment indicators in India, highlighting trends in labour force participation, worker population ratios, and unemployment rates across various demographics and regions.
PLFS: Origin and Objective
- Initiation: The PLFS was launched by the National Statistical Office in 2017 to gather frequent and detailed labour force data.
- Inaugural Report: The first annual report was released in 2019, based on data collected from July 2017 to June 2018.
- Objectives: The main goals of the PLFS include:
- Estimating key employment and unemployment indicators, such as the Labour Force Participation Rate (LFPR), every three months in urban areas.
- Providing annual estimates for both rural and urban regions.
- Using a current weekly status approach to define unemployment, where individuals are considered unemployed if they did not work for at least one hour during the week but actively sought work.
Key Indicators of PLFS
- Labour Force Participation Rate (LFPR): This measures the percentage of people in the labour force (those working, seeking, or available for work) relative to the entire population.
- Worker Population Ratio (WPR): This is the percentage of employed individuals in the total population.
- Unemployment Rate (UR): The UR indicates the percentage of unemployed individuals within the labour force. According to the International Labour Organisation (ILO), unemployment refers to being jobless while actively seeking work, distinguishing it from mere joblessness.
Activity Status
- Usual Status: This is based on the activity status of individuals over the past 365 days leading up to the survey.
- Current Weekly Status (CWS): CWS considers the average number of employed or unemployed individuals in the week prior to the survey.
- Comparison: Usual status unemployment rates are typically lower than CWS rates because there is a higher likelihood of finding work over a year compared to a week.
Findings of Annual Report
Labour Force Participation Rate (LFPR)
- Rural Areas: Increased significantly from 50.7% in 2017-18 to 63.7% in 2023-24.
- Urban Areas: Rose from 47.6% to 52.0% during the same period.
- Males: LFPR for males improved from 75.8% in 2017-18 to 78.8% in 2023-24.
- Females: Increased from 23.3% to 41.7% over the years.
- Muslim Women: LFPR for Muslim women rose from 15% in 2021-22 to 21.4% in 2023-24.
- Hindu Women: Increased from 26.1% in 2021-22 to 33.3% in 2023-24.
Worker Population Ratio (WPR)
- Rural Areas: Increased from 48.1% in 2017-18 to 62.1% in 2023-24.
- Urban Areas: Improved from 43.9% to 49.4% during the same period.
- Males: WPR for males increased from 71.2% in 2017-18 to 76.3% in 2023-24.
- Females: WPR for females rose from 22.0% to 40.3% over the years.
Unemployment Rate
- Overall Unemployment: No significant improvement in the overall unemployment scenario, with the rate remaining at 3.2%, similar to the previous year.
- Youth Unemployment: No notable improvement in youth unemployment rates.
- Unpaid Family Labour: Increased participation in unpaid family labour.
- Agriculture: Rising trend in workers’ participation in agriculture observed for the fourth consecutive time.
GDP Base Year Revision
Why in the News?
- The government has established a 26-member Advisory Committee on National Accounts Statistics (NAS) to update the GDP base year from the current 2011-12 to 2022-23.
More on the News
- The NAS, chaired by Biswanath Goldar, aims to identify new data sources and refine the methodology for compiling National Accounts Statistics.
- The Central Statistics Office (CSO) publishes NAS annually, which includes GDP estimates from various approaches.
- The Advisory Committee on NAS will review data sources to align GDP with inflation and industrial indices.
- The previous base year revision in 2015 changed the base year from 2004-05 to 2011-12.
- In the new series, the CSO replaced Gross Domestic Product (GDP) at factor cost with Gross Value Added (GVA) at basic prices, following international practice.
What is Base Year?
Base Year is a reference year used to calculate real growth in national income by adjusting for inflation. It serves as a benchmark for GDP calculation. For instance, if 2011-12 is the base year, GDP for other years is adjusted to reflect 2011-12 prices. Revising the base year is also important for other metrics like the Index of Industrial Production (IIPs), Wholesale Price Index (WPI), and Consumer Price Index (CPI).
Need to Update the GDP Base Year
- Removing Inflation Effects: Outdated base years can overestimate GDP by ignoring rising prices.
- Enhances Data Quality: Includes new data from digitization, enhancing the reliability of data used.
- Global Comparison: Aids in comparing GDP with other countries.
- Other Reasons: Adapts to post-pandemic dynamics and supports effective policymaking.
About GDP
Measurements of GDP
- Nominal GDP: Measured at current market prices, ignoring inflation.
- Real GDP: Adjusted for inflation using base year prices, reflecting true economic growth.
Limitations of GDP
- Excludes non-market activities such as household work.
- Ignores income inequality among different segments of the population.
- Overlooks environmental damage caused by economic activities.
- Misses contributions from the informal economy, which may not be captured in official statistics.
- Does not measure overall welfare or living standards of the population.
Chain-based GDP Calculation
- Involves measuring GDP by linking short-term changes in economic activity using a rolling base year.
- Updates the base year periodically, often annually, allowing for a continuous series of growth rates.
- Common in advanced countries like the US, Australia, Canada, and EU nations.
GDP Accounting Standard
- Countries follow the System of National Accounts (SNA) evolved by the UN for global standardization and comparability.
- The latest version, SNA 2008, is an update of the earlier 1993 SNA and was adopted by the United Nations Statistical Commission in 2009.
- SNA 2008 serves as the international statistical standard for national accounts, ensuring consistency and comparability across countries.
Basic Animal Husbandry Statistics 2024
- Why in News? Recently, the Ministry of Fisheries, Animal Husbandry & Dairying released the Basic Animal Husbandry Statistics 2024 (BAHS) on the occasion of National Milk Day (26th November).
- It is based on the outcomes of the Integrated Sample Survey (ISS) (March 2023–February 2024) and shows trends in major livestock products like milk, eggs, meat, and wool.
- ISS is an annual, large-scale survey conducted by the Department of Animal Husbandry and Dairying.
- It covers 15% of the villages across the country and estimates livestock numbers and production data for major products, including milk, meat, wool, and eggs.
- Note: National Milk Day is celebrated on the birth anniversary of Verghese Kurien who made India self-sufficient in milk output through the white revolution.
What are Key Highlights of the BAHS 2024?
- Milk Production: India’s total milk production for 2023-24 is estimated at 239.30 million tonnes, reflecting a 3.78% increase over 2022-23. India is the largest producer of milk in the world. Top 3 producers are Uttar Pradesh, Rajasthan and Madhya Pradesh.
- Per Capita Milk Availability increased to 471 grams per day in 2023-24 from 459 grams per day in 2022-23.
- Egg Production: Total egg production for 2023-24 is estimated at 142.77 billion numbers, a 3.18% increase from 2022-23. India ranked 2nd globally in egg production. Top 3 producers are Andhra Pradesh, Tamil Nadu, and Telangana.
- Meat Production: India’s total meat production for 2023-24 is estimated at 10.25 million tonnes, reflecting a 4.95% growth over 2022-23. Top 3 producers are West Bengal, Uttar Pradesh, and Maharashtra.
- Wool Production: India’s total wool production for 2023-24 is estimated at 33.69 million kg, showing a 0.22% increase from the previous year. Top 3 producers are Rajasthan, Jammu & Kashmir, and Gujarat.
- Livestock Growth: From 2014-15 to 2022-23, the sector grew at a compound annual growth rate (CAGR) of 7.38% (at constant prices). The share of livestock in agriculture Gross Value Added (GVA) increased from 24.32% (2014-15) to 30.38% (2022-23).
21st Livestock Census
- About: The 21st Livestock Census was recently launched by the Ministry of Fisheries, Animal Husbandry and Dairying. The census is carried out every five years to gather data on the number of domesticated animals, poultry, and stray animals across the country. A total of 20 livestock censuses have been conducted since 1919. The 20th Census was conducted in 2019.
- Data Collection: The data will include information about the species, breed, age, sex, and ownership status of animals. Animals Included in the Census:
- Animals: The census will cover 16 animal species, including Cattle, buffalo, mithun, yak, sheep, goat, pig, camel, horse, ponies, mule, donkey, dog, rabbit, and elephant. 219 indigenous breeds recognized by the ICAR-National Bureau of Animal Genetic Resources (NBAGR) will be included.
- Poultry Birds: The census will also count poultry birds, including Fowl, chicken, duck, turkey, geese, quail, ostrich, and emu.
Underutilization of Operation Greens Scheme
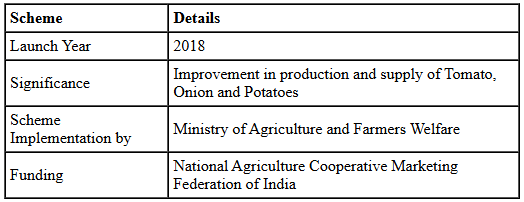
The Operation Green Scheme, initiated by the Government of India in 2018, aims to enhance the value chain of tomatoes, onions, and potatoes through both short-term and long-term interventions. The scheme seeks to boost the production and supply of these and other perishable agricultural commodities. It is implemented in two parts: one under the Atmanirbhar Bharat Package and the other under Operation Flood, focusing on the development of farmer producer organizations, agri-logistics, processing facilities, and professional management.
Overview of Operation Green Scheme
The Operation Green Scheme was launched in 2018 with the objective of improving the production, supply, and marketing of horticulture produce in India, particularly focusing on tomatoes, onions, and potatoes. The scheme is implemented by the Ministry of Agriculture and Farmers Welfare and is funded by the National Agricultural Cooperative Marketing Federation of India (NAFED).
Highlights of the Operation Green Scheme
Objectives of Operation Green Scheme
- Price Stabilization: To stabilize the prices of tomatoes, onions, and potatoes through better management of production and supply chains.
- Farmer Income: To double farmers' income by linking farmer producer organizations with retail markets.
- Post-Harvest Loss Reduction: To reduce post-harvest losses and create a robust value chain for these crops.
- Infrastructure Development: To develop necessary infrastructure, including transportation and storage systems, to connect production clusters with consumption centers.
- Supply Chain Improvement: To improve the supply chain for tomatoes, onions, and potatoes by interconnecting processing facilities with production clusters.
- Data Collection: To collect data for analyzing demand, supply, and prices of these crops.
Features of Operation Green Scheme
- Short-term Price Stabilization: The scheme aims to stabilize prices of tomatoes, onions, and potatoes in the short term while developing integrated value chains for long-term benefits.
- Target Beneficiaries: The scheme targets various stakeholders involved in the processing and marketing of these crops, including food processors, Farmer Producer Organizations (FPOs), cooperative societies, individual farmers, licensed commission agents, exporters, state marketing federations, and retailers.
- Subsidy Provisions: The scheme offers a 50% subsidy on transportation and storage costs for eligible crops, with specific caps and conditions for different beneficiaries.
- Pattern of Assistance: The scheme provides a 50% subsidy on eligible project costs, with higher grants for FPOs acting as project implementation agencies.
- Demand-Driven Funding: Funds are allocated based on applications received, without predefined allocations for specific crops or states.
- Implementation Agency: The Ministry of Food Processing Industries (MoFPI) implements the scheme to enhance market infrastructure, stabilize prices, and develop sustainable supply chains for key perishable crops.
Benefits of Operation Green Scheme
Benefits for Farmers
- Reduction in Post-Harvest Losses: The scheme aims to provide robust infrastructure and enhanced storage facilities to minimize wastage of tomatoes, onions, and potatoes after harvest.
- Fair Price Realization: Farmers and Farmer Producer Organizations (FPOs) will be linked with platforms like e-NAM (National Agriculture Market) to ensure they receive fair prices for their produce, preventing distress sales.
- Price Stabilization:. market intelligence network will be used to provide real-time data on demand and supply, helping farmers make informed decisions and stabilizing market prices.
Benefits for Food Processors
- Capacity Building: The scheme will facilitate the efficient linking of farmers and FPOs with value chain production clusters for tomatoes, onions, and potatoes, boosting the capacity for food processing.
- Market Intelligence: Food processors will be able to access real-time data on demand and supply, allowing for better production planning and alignment with market needs.
Overall, the Operation Greens Scheme aims to create a sustainable and resilient agricultural ecosystem by improving the value chain for tomatoes, onions, and potatoes, benefiting both farmers and food processors.
Strategies Implemented under Operation Green Scheme
Short-Term Price Stabilization Measures
- Nodal Agency: The National Agricultural Cooperative Marketing Federation of India (NAFED) is responsible for implementing price stabilization initiatives under the Operation Greens Scheme.
- Subsidy Support:The Ministry of Food Processing Industries offers a 50% subsidy for the following:
- Transportation of tomato, onion, and potato (TOP) crops from surplus production clusters to storage facilities.
- Hiring of appropriate storage facilities for TOP crops.
Long-Term Integrated Value Chain Development
- Capacity Building: Strengthening Farmer Producer Organizations (FPOs) and their consortiums to enhance their capacity and effectiveness in managing the supply chain.
- Production Quality Improvement: Enhancing the quality and quantity of TOP crop production through better farming practices and technologies.
- Post-Harvest Facilities Establishment: Setting up processing units to reduce post-harvest losses and improve value addition for TOP crops.
- Agri-Logistics Development: Developing efficient logistics and transportation systems to improve supply chain management for TOP crops.
- Market Development: Identifying and enhancing marketing and consumption points for TOP crops to ensure better market access and sales.
- Digital Platforms Creation: Establishing an e-platform for effective demand-supply management of TOP crops, facilitating better coordination and information sharing among stakeholders.
55th GST Council Meeting
- The 55th Goods and Services Tax (GST) Council meeting took place in Jaisalmer, Rajasthan.
- During this meeting, several important decisions were made regarding tax rate changes, trade facilitation, and compliance streamlining under GST.
Key Recommendations by the GST Council
- Full exemption of GST on gene therapy.
- Exemption of GST on contributions by general insurance companies from third-party motor vehicle premiums for the Motor Vehicle Accident Fund.
- Reduction in the GST rate on Fortified Rice Kernel (FRK) to 5%.
Other Discussions
- Pepper. Fresh green or dried pepper and raisins supplied by an agriculturist are not liable to GST.
- Popcorn. When popcorn is mixed with sugar (e.g., caramel popcorn), it would attract 18% GST.
|
38 videos|5288 docs|1117 tests
|


MCQs
,shortcuts and tricks
,Semester Notes
,Economic Development - 4 | Current Affairs & Hindu Analysis: Daily
,Extra Questions
,Sample Paper
,video lectures
,Economic Development - 4 | Current Affairs & Hindu Analysis: Daily
,Weekly & Monthly - UPSC
,past year papers
,Exam
,Economic Development - 4 | Current Affairs & Hindu Analysis: Daily
,practice quizzes
,Weekly & Monthly - UPSC
,Important questions
,Summary
,study material
,Weekly & Monthly - UPSC
,Previous Year Questions with Solutions
,Free
,mock tests for examination
,Objective type Questions
,Viva Questions
,ppt
;


Economic Development - 4 Free PDF Download
Importance of Economic Development - 4
Economic Development - 4 Notes
Economic Development - 4 UPSC Questions
Study Economic Development - 4 on the App
|
© EduRev
|
Education Revolution
|


|


within 7 days!