Economic Development: January 2025 Current Affairs | General Test Preparation for CUET UG - CUET Commerce PDF Download

Privatisation of Power DISCOMs
Why in News?
In December 2024, the Supreme Court upheld the Punjab and Haryana High Court's decision, supporting the government's intent to privatize the power distribution companies (DISCOMs) in Chandigarh.
Key Takeaways
- High AT&C Losses: India’s Aggregate Technical and Commercial losses are at 17.6% in FY24, indicating issues of electricity theft and unbilled supply.
- Systemic Inefficiencies: Billing efficiency is at 87% and collection efficiency is at 97.3%, showing operational inefficiencies that impact revenue generation.
- Escalating Financial Strain: The gap between average cost of supply and average realizable revenue widened from 33 paise per unit in FY22 to 55 paise per unit in FY23.
- Subsidy Burden on States: The financial deficit in the power distribution sector increased to at least Rs 79,000 crore in FY23.
- Rising Power Demand and Costs: An 8% rise in power demand in FY23 along with costly coal imports increased average power purchase costs by 71 paise/kWh.
- Demonstrated Success in Private Models: In Delhi, privatization reduced AT&C losses from over 50% in 2002 to single-digit levels.
- Ineffectiveness of Current Public-Sector Reforms: Initiatives like the UDAY scheme have shown limited success.
Challenges of Privatisation of DISCOMs
- Employee Resistance to Privatisation: Employees fear job losses and adverse conditions, as seen in Delhi’s voluntary retirement scheme.
- Complex Legal and Regulatory Environment: Compliance with the Electricity Act, 2003 poses challenges and can delay privatization processes.
- Tariff Concerns for Consumers: Necessary tariff increases post-privatization may lead to consumer backlash.
- Lack of Transitional Support: Past failures, like Odisha's privatization in the 1990s, highlight the importance of financial and operational support.
Government Steps to Support State DISCOMs
- Ujwal DISCOM Assurance Yojana (UDAY): Launched in 2015 to rescue financially strained DISCOMs, allowing states to take over 75% of liabilities.
- Revamped Distribution Sector Scheme (RDSS): A budget of Rs. 3,03,758 crore aims to reduce nationwide losses by 12-15% by FY 2024-25.
- Integrated Power Development Scheme (IPDS): Focuses on strengthening urban power distribution infrastructure and improving reliability.
- Integrated Ratings: Annual ratings evaluate operational and financial parameters, promoting accountability.
- Financial Assistance and Subsidies: State governments disbursed 108% of tariff subsidies booked to maintain operations despite losses.
- Regulatory Reforms: Late Payment Surcharge Rules have eased liquidity pressures by reducing payable and receivable days.
- Privatisation in Union Territories (UTs): Initiatives in UTs like Dadra and Nagar Haveli have shown progress despite challenges.
Way Forward
- Collaborative Stakeholder Engagement: Engage with employees, consumers, and political groups to address concerns and build consensus.
- Focus on Regulatory Strengthening: Empower state electricity regulatory commissions to ensure transparent tariff determination.
- Gradual Tariff Rationalisation: Phase tariff adjustments with subsidies for vulnerable consumers to maintain affordability.
- Emphasis on Infrastructure Upgradation: Prioritize modernizing grids and leveraging technology for better service delivery.
- Encouraging Retail Competition in Phases: Explore phased retail competition to improve service quality.
- Learning from Best Practices: Apply lessons from successful and unsuccessful models to design effective policies.
Future of Jobs Report 2025

Why in News?
The World Economic Forum (WEF) has released its 'Future of Jobs Report 2025,' highlighting key findings and anticipated changes that are expected to shape the global job market by 2030. The report is based on insights from 55 economies and predicts a net increase of 78 million jobs by 2030. It emphasizes how technology, economic shifts, and the green transition will impact jobs and skills.
Key Takeaways
- The fastest-growing roles include frontline jobs (farmworkers, delivery), positions in the care economy, tech roles, and jobs related to the green transition.
- Clerical roles such as cashiers, data entry clerks, and bank tellers are projected to decline significantly.
- Automation and investments in renewable energy will displace jobs but also create new tech and machine management roles, with a prediction of 1.6 million jobs lost globally due to slower economic growth.
- Technological advancements, particularly in digital access, are forecasted to reshape businesses, with demand for skills in AI, robotics, and energy technologies.
- The green transition is driving demand for roles in engineering, environmental science, and electric vehicles.
- Aging populations are affecting labor supply, increasing demand for healthcare in high-income economies while boosting demand for educators in low-income regions.
- Geopolitical tensions are leading to business model transformations and increased demand for security and cybersecurity roles.
Additional Details
- India's Position: India is leading in AI skills enrollments, significantly boosted by corporate sponsorship for GenAI training. Employers in India aim to outpace global tech adoption, anticipating a shift towards semiconductors, computing technologies, quantum, and encryption.
- India and Sub-Saharan African nations are expected to supply nearly two-thirds of new workforce entrants in the coming years.
- Challenges in Employment: Job displacement in sectors like manufacturing and services is due to automation. There's a significant skill mismatch as many workers lack expertise in emerging fields like AI, cybersecurity, and data science.
- The informal sector faces challenges as workers may struggle to transition to technology-driven jobs due to limited access to training and education.
- The WEF’s 'Future of Jobs Report 2025' underscores the critical need for upskilling, adapting to technological changes, and prioritizing diversity in the workforce. To create resilient labor markets, collaboration between governments and businesses is essential to invest in skills, AI, and inclusive growth strategies that meet future job demands.
Mains Question
Q: Discuss the impact of technological advancements and economic conditions on global labor markets by 2030.
8th Edition of the National Programme for Organic Production

Why in News?
The 8th edition of the National Programme for Organic Production (NPOP) was launched in New Delhi, emphasizing India's potential in organic farming. The Union Minister of Commerce & Industry announced that exports could reach Rs 20,000 crore in the next three years.
Key Takeaways
- The NPOP, initiated in 2001, is implemented by the Agricultural and Processed Food Products Export Development Authority (APEDA) under the Ministry of Commerce & Industries.
- New initiatives and technological advancements were introduced to enhance organic farming and strengthen India's position in the global market.
Additional Details
- What is the National Programme for Organic Production: The NPOP focuses on accreditation, organic production standards, and the promotion of organic farming, enhancing India's global competitiveness in this sector.
- Recognition for Organic Grower Groups: Simplified certification requirements and granting legal status to grower groups replaced the previous Internal Control System (ICS).
- Technological Advancements: The NPOP Portal enhances visibility for stakeholders, while the Organic Promotion Portal connects farmers with global buyers.
- TraceNet 2.0: An upgraded system ensuring transparency, traceability, and compliance from farm to market.
- AgriXchange Portal: Facilitates data analysis and connects international buyers and sellers.
- Organic farming emphasizes the health of soils, ecosystems, and people by avoiding synthetic chemicals and relying on natural processes. It combines tradition, innovation, and science to promote environmental benefits.
Status of Organic Farming
- India is the world leader in organic producers, with around 2.3 million farmers.
- As of 2023-24, approximately 4.5 million hectares (2.5% of total agricultural land) are under organic certification.
- The top four states—Madhya Pradesh (26%), Maharashtra (22%), Gujarat (15%), and Rajasthan (13%)—account for nearly 76% of India's organically cultivated area.
Key Organic Products in India
- Major organic exports include flax seeds, sesame, soybeans, tea, medicinal plants, rice, and pulses.
- India is a global leader in organic cotton production.
Types of Organic Farmers in India
- Traditional Organic Farmers: Located in low-input zones, practicing organic farming traditionally without certification.
- Reactive Organic Farmers: Transitioning to organic due to soil degradation and food toxicity issues, including certified and uncertified farmers.
- Commercial Organic Farmers: Engaging in organic farming for market opportunities, most of whom are certified.
Progress of Organic Farming in India
- National Project on Organic Farming (NPOF): Launched in 2004 to promote organic farming through training and development of organic inputs.
- Participatory Guarantee System (PGS): Introduced in 2011 to simplify certification procedures.
- Paramparagat Krishi Vikas Yojana (PKVY): Promotes traditional organic practices through farmer clusters and financial assistance.
- Mission Organic Value Chain Development for Northeastern Region (MOVCDNER): Focuses on creating a value chain for organic farming in Northeastern states.
- FSSAI Organic Foods Regulation: In 2024, launched the “Unified India Organic” logo to standardize organic regulations.
Challenges in Organic Farming in India
- High Certification Costs: The cost of obtaining organic certification deters small farmers.
- Lack of Infrastructure: Inadequate facilities lead to post-harvest losses.
- Limited Awareness: Misleading labels erode consumer trust and limit demand.
- Low Productivity: Lower yields during the transition phase and limited bio-input availability.
- Market Access and Premium Pricing: Competition from cheaper conventional goods hampers profitability.
- Global Trade Barriers: Non-tariff barriers complicate exports.
- Climate and Pest Challenges: Vulnerability to climate variability and pests due to limited chemical use.
- Lack of R&D and Training: Insufficient research hinders development of effective organic farming techniques.
Way Forward
- Strengthening Certification Systems: Simplify certification processes and reduce costs for small farmers.
- Promoting Market Linkages: Strengthen Farmer Producer Organisations (FPOs) to create direct market access.
- Research and Development: Invest in developing high-yield, pest-resistant organic crop varieties.
- Consumer Awareness: Promote the India Organic brand through influencers and ensure widespread use of the Unified India Organic logo.
- Policy Support: Introduce risk mitigation strategies and provide tax incentives for organic production.
- The growth of organic farming in India presents both challenges and opportunities. Addressing these challenges through strategic initiatives can enhance the sector's sustainability and profitability.
Chhattisgarh Links Forest Ecosystem to Green GDP
Why in News?
Chhattisgarh has become the first state in India to connect its forest ecosystem to the Green Gross Domestic Product (Green GDP). This innovative approach emphasizes the economic and environmental significance of forests while promoting biodiversity conservation and climate change mitigation. It aligns with broader goals of achieving sustainable development and economic growth.
Key Takeaways
- Chhattisgarh is the first Indian state to link its forest ecosystem with Green GDP.
- This initiative underscores the economic and ecological importance of forests.
- It aims to foster sustainable development while promoting economic growth.
Additional Details
- Green Gross Domestic Product (Green GDP): A modified version of traditional GDP that includes the environmental costs associated with economic activities. It provides a more accurate representation of a nation's wealth by factoring in natural resource depletion, environmental degradation, and pollution.
- Traditional GDP: Measures the annual value of goods and services produced within a country but fails to reflect true welfare as it ignores environmental and social factors.
- Need for Green GDP: Traditional GDP overlooks sustainability and environmental health, focusing solely on economic output without considering long-term impacts.
- Formula: Green GDP = NDP (Net Domestic Product) - (Cost of Natural Resource Depletion + Cost of Ecosystem Degradation).
- Chhattisgarh's forests cover 44.2% of the state's geographical area and play a crucial role in carbon dioxide absorption, contributing significantly to climate change mitigation.
- These forests also support the livelihoods of millions, with products such as tendu leaves, lac, honey, and medicinal plants being essential to the rural economy. Furthermore, they are integral to tribal traditions and cultural heritage.
Implications of Linking Forests with Green GDP
- Highlights the economic and ecological value of forests.
- Aims to create a balance between development and sustainability.
- Ensures long-term environmental health for future generations.
How Does Green GDP Promote Sustainable Development?
- Sustainable Resource Use: Encourages responsible consumption and production, aligning with SDG 12.
- Climate Change Mitigation: Supports renewable energy adoption and reduces fossil fuel reliance, contributing to SDG 13.
- Biodiversity Conservation: Promotes environmental preservation and ecosystem protection, aligning with SDG 15 and SDG 14.
- Incentivizes Green Investments: Encourages investment in sustainable practices, supporting SDG 8 for inclusive economic growth.
What Challenges Does the Green GDP Framework Face?
- Forest Cover Definition: The term "forest" in the India State of Forest Report includes plantations that may not provide the same ecological benefits as natural forests.
- Political Agendas: States may manipulate data for funding, prioritizing plantations over natural forests, which can harm ecological health.
- Local Body Integration: Engaging local bodies in the Green GDP framework is challenging due to low awareness and literacy levels.
- Lack of Clarity on Benefits: Uncertainty on how financial benefits will reach local communities, particularly tribes and forest dwellers.
- Methodological Differences: The absence of a universally accepted method for calculating Green GDP complicates comparisons across regions.
Way Forward
- A Clear Standard Framework: Establish consistent methodologies for calculating Green GDP.
- Public Scrutiny: Ensure data transparency and allow for independent analysis.
- Prioritize Quality Over Quantity: Focus on restoring native ecosystems for better environmental outcomes.
- Public Awareness: Educate communities about Green GDP benefits to enhance sustainability efforts.
- Green GDP is crucial for countries like India as it aligns economic growth with environmental sustainability, ensuring that development does not compromise ecological health and social welfare.
Logistics Ease Across Different States (LEADS) 2024

Why in News?
Recently, the Union Minister of Commerce & Industry unveiled the "Logistics Ease Across Different States (LEADS) 2024" report in New Delhi, marking a significant development in evaluating logistics performance in India.
Key Takeaways
- This is the 6th edition of the LEADS report.
- The report was based on the Logistics Performance Index of the World Bank, initiated in 2018 by the Department for Promotion of Industry and Internal Trade (DPIIT), Ministry of Commerce and Industry.
- It assesses logistics performance through four key pillars:
- Logistics Infrastructure
- Logistics Services
- Operating and Regulatory Environment
- Sustainable Logistics
- The report emphasizes the various initiatives undertaken by States and Union Territories (UTs) across these pillars and focuses on state-specific opportunities for informed decision-making.
Additional Details
- Key Achievers in Coastal Group:
- Gujarat
- Karnataka
- Maharashtra
- Odisha
- Tamil Nadu
- Fast Movers: Andhra Pradesh, Goa
- Aspirers: Kerala, West Bengal
- Landlocked Group Leaders:
- Haryana
- Telangana
- Uttar Pradesh
- Uttarakhand
- Bihar
- Himachal Pradesh
- Madhya Pradesh
- Punjab
- Rajasthan
- Chhattisgarh
- Jharkhand
- North-Eastern Group Achievers:
- Assam
- Arunachal Pradesh
- Meghalaya
- Mizoram
- Nagaland
- Sikkim
- Tripura
- Manipur
- Union Territories:
- Chandigarh
- Delhi
- Dadra and Nagar Haveli and Daman and Diu
- Jammu and Kashmir
- Lakshadweep
- Puducherry
- Andaman and Nicobar Islands
- Ladakh
- Sustainable Logistics: This concept involves enhancing the sustainability of logistics, goods, and transportation to minimize environmental impacts while balancing operational efficiency with environmental responsibility.
- The LEADS 2024 report is a crucial tool for understanding the logistics landscape across different states and UTs in India, providing insights that can drive improvements and strategic decisions in logistics performance.
Farmer’s Demand for Legalizing MSP

Why in News?
The Supreme Court (SC) of India has recently criticized the Central Government for not engaging effectively with protesting farmers and addressing their grievances. The court urged the Centre to consider the farmers' demands while responding to a new plea for a legal guarantee of Minimum Support Price (MSP). This situation arises amid ongoing protests by farmer groups at the Punjab-Haryana border.
Key Takeaways
- The Supreme Court's intervention emphasizes the need for a legal resolution to farmer grievances.
- The petition demands MSP be legally guaranteed to stabilize farmers' incomes.
- Farmers are protesting due to historical economic issues exacerbated by recent agricultural policies.
Additional Details
- Petition for MSP Guarantee: This petition seeks to ensure that MSP on crops is a legal right, derived from promises made during the 2021 farmers' protests that followed the repeal of controversial farm laws. The goal is to secure stable incomes for agricultural producers.
- Reasons for Protests: Protests are rooted in longstanding grievances that date back to India’s 1991 economic liberalization, which favored industrialization over agriculture. Consequently, farmers face low crop returns and high input costs.
- Key Demands: Farmers demand a law to guarantee MSP for all crops, based on the Swaminathan Commission Report, which recommends a profit margin of 50% over the comprehensive cost of production.
- The central government argues that a legal guarantee for MSP is impractical due to logistical challenges and potential economic strain.
- In summary, the ongoing demands for legalizing MSP highlight critical issues in India’s agricultural sector, emphasizing the need for a structured response to ensure the economic stability of farmers.
Mains Question
Q: Discuss the implications of legalizing the Minimum Support Price for all crops in India. Should it be considered a sustainable solution to address agricultural distress?
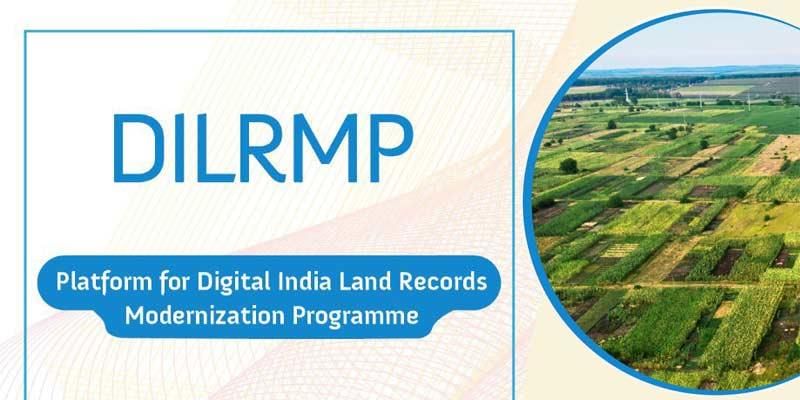
DILRMP and Digitalisation of Land Records
Why in News?
As of 2024, India has achieved a remarkable milestone with 98.5% of rural land records digitized. This progress is part of the Digital India Land Records Modernization Programme (DILRMP), initiated in 2008, aimed at modernizing agricultural land records to increase accessibility and reduce disputes.
Key Takeaways
- The DILRMP was revamped from the National Land Record Modernization Programme (NLRMP) in 2016, becoming a central sector scheme funded entirely by the government.
- Key initiatives include the implementation of the Unique Land Parcel Identification Number (ULPIN), National Generic Document Registration System (NGDRS), and e-Court integration.
Additional Details
- Unique Land Parcel Identification Number (ULPIN): Also known as "Bhu-Aadhar," this 14-digit alphanumeric code is assigned to each land parcel based on its geo-coordinates, aiding in real estate transactions and dispute resolution.
- National Generic Document Registration System (NGDRS): This system standardizes the registration process of deeds across India, allowing for online transactions and document searches.
- e-Court Integration: This links land records with electronic courts to provide accurate land information for judiciary purposes, facilitating faster case resolution.
- Transliteration of Land Records: To address language barriers, land records are being transliterated into 22 languages as per the Indian Constitution.
- Bhoomi Samman: This initiative has awarded "Platinum Grading" to 168 districts across 16 states for achieving over 99% completion of core components of the program.
- The digitization of land records is critical for India, where over 45% of the workforce is employed in agriculture. The DILRMP enhances the land management system by ensuring equity, reducing litigation, promoting development, and improving transparency.
Advantages of DILRMP
- Improves the quality of land records, making them more accurate and reliable.
- Reduces litigation and fraud by establishing a conclusive land-titling system with government-backed guarantees.
- Promotes development by facilitating efficient land markets and reducing transaction risks.
Challenges Associated with Land Record Digitisation
- Language and Dialect Barriers: Linguistic diversity can complicate understanding of digital systems, especially in rural areas.
- Community Shareholdings: Traditional community-based land ownership in some regions may conflict with formal titling systems.
- Lack of Awareness: Many stakeholders are unaware of the benefits and procedures of DILRMP.
- Quality of Land Records: Outdated maps and unclear titles can hinder accurate records.
- Lack of Resources: Insufficient funds and infrastructure challenge the effective implementation of DILRMP.
Way Forward
- Integrate land records with property registration, tax payments, and government subsidies for seamless access.
- Conduct routine audits and utilize technology for accurate land record updates.
- Engage local communities in the surveying and updating of land records.
- Implement public awareness campaigns to educate stakeholders on the benefits of digitization.
- Establish online platforms for efficient land dispute resolution.
In conclusion, the DILRMP represents a significant step towards modernizing India's land records system, addressing challenges, and promoting transparency and equity in land management.
Tapping Renewable Energy Potential in India

Why in News?
Recently, the Ministry of New and Renewable Energy has urged states to facilitate land availability for renewable energy initiatives, particularly focusing on wind power. With a current capacity of 47.95 GW, the government aims to double this to 100 GW and enhance land access to achieve a target of 500 GW of non-fossil energy by 2030.
Key Takeaways
- Current renewable energy capacity in India stands at 158.55 GW.
- Wind power capacity accounts for 47.96 GW, with 2.07 GW added in FY 2024-25.
- Solar power leads with 94.17 GW, including 15.16 GW from grid-connected rooftop and 4.10 GW from off-grid solar solutions.
- Hydro power contributes 5.08 GW from small hydro projects.
- Biomass energy totals 10.72 GW, with 9.80 GW from bagasse-based cogeneration.
- Waste-to-energy contributes 0.61 GW.
Additional Details
- Solar Energy: With over 300 sunny days annually, the National Institute of Solar Energy (NISE) estimates a potential of 748 GW, considering 3% of wasteland covered by solar PV modules. States like Rajasthan, Gujarat, and Tamil Nadu are leading in solar energy development.
- Wind Energy: India’s wind energy potential exceeds 300 GW, mainly in Maharashtra, Andhra Pradesh, and Karnataka. Emerging offshore wind projects in coastal regions such as Gujarat and Tamil Nadu could significantly enhance capacity.
- Hydro Energy: India has over 148 GW of hydroelectric potential, with 46 GW untapped. Small hydropower plants.
- Geothermal Energy: Significant geothermal potential exists in Ladakh, Himachal Pradesh, and Jharkhand, with projects in Puga Valley illustrating this untapped resource.
- Ocean Energy: India can harness 40 GW of wave energy, with tidal energy potential along coastal areas such as the Gulf of Kutch and Sundarbans.
Challenges in Expanding Renewable Energy
- Land Scarcity and Use Conflicts: Accessing suitable land for wind energy projects is difficult, especially in densely populated or ecologically sensitive areas, with resistance from local communities.
- Financing and Investment Issues: High upfront capital requirements and uncertainty in returns deter private investment.
- Grid Integration and Curtailments: The intermittent nature of wind power causes supply instability, leading to curtailments that reduce profitability.
- Exhaustion of High-Quality Sites: Prime locations for wind farms are already occupied, limiting new projects to less viable areas.
- Approval Delays and Policy Gaps: Prolonged delays in obtaining necessary clearances and lack of consistent financial incentives reduce investor confidence.
- Offshore Wind Challenges: High installation costs and limited government support hinder the development of offshore wind potential.
Way Forward
- Improving Land Access: Establish transparent policies for acquiring unused government land and streamline processes through digitized records.
- Strengthening Transmission Infrastructure: Develop green energy corridors and invest in hybrid systems to stabilize power output.
- Harmonizing Policies: Create a unified national renewable energy policy to provide long-term incentives and attract investment.
- Focusing on Offshore Wind: Pilot projects and financial incentives to promote offshore wind development.
- Financing and R&D: Establish green banks for affordable financing and invest in research for improving efficiency.
- Environmental Sustainability and Skill Development: Conduct environmental assessments and community engagement programs.
Household Consumption Expenditure Survey 2023-24

Why in News?
The Ministry of Statistics and Programme Implementation (MoSPI) has released the factsheet of the Household Consumption Expenditure Survey (HCES) 2023-24, providing key insights into consumption patterns and economic well-being in India.
Household Consumption Expenditure Survey
- The HCES collects data on household spending patterns to assess living standards, well-being, and consumption behavior.
- HCES has been conducted by the National Statistical Office (NSO) since 1951 as part of the National Sample Survey (NSS) under the MoSPI.
- Significance: Provides inputs for calculating Consumer Price Indices (CPI) and revising the base year for macroeconomic indicators like Gross Domestic Product (GDP).
- HCES helps to measure poverty, inequality, and social well-being.
What are the Key Findings of the HCES 2023-24?
Rising Consumption:
- Rural: Average monthly per capita expenditure (MPCE) rose to Rs 4,122 (up 9.3% from Rs 3,773 in 2022-23).
- Urban: MPCE increased to Rs 6,996 (up 8.3% from Rs 6,459 in 2022-23).
- Rural-Urban Gap: The gap narrowed from 83.9% in 2011-12 to 69.7% in 2023-24, indicating faster rural consumption growth.
- Imputed Values: Imputed values for free benefits under welfare schemes marginally increased MPCE estimates. Rural MPCE with imputation is Rs 4,247, and Urban is Rs 7,078.
Regional Disparities:
- Sikkim: Highest MPCE (rural Rs 9,377 and urban Rs 13,927).
- Chhattisgarh: Lowest MPCE (rural Rs 2,739 and urban Rs 4,927).
- Higher-than-Average States: Maharashtra, Punjab, Tamil Nadu, Telangana, Kerala.
- Lower-than-Average States: West Bengal, Bihar, Uttar Pradesh, Madhya Pradesh.
- Union Territories: Highest in Chandigarh (Rural Rs. 8,857 and Urban Rs. 13,425); Lowest in Dadra and Nagar Haveli and Daman and Diu (Rs. 4,311) and Jammu and Kashmir (Rs. 6,327).
Consumption Inequality:
- Gini Coefficient: Decreased in both rural (from 0.266 to 0.237) and urban (from 0.314 to 0.284) areas, indicating reduced consumption inequality.
- Food Expenditure: Increased in both rural (47.04%) and urban (39.68%) areas. Highest expenditure on beverages, refreshments, and processed food, followed by milk, milk products, and vegetables.
Non-Food Expenditure:
- Rural: 52.96% (high spending on conveyance, medical expenses, and clothing).
- Urban: 60.32% (high spending on conveyance, miscellaneous goods, and rent).
Fractile Consumption Patterns:
- Top 5%: Decrease in consumption spending compared to 2022-23.
- Bottom 5%: Significant increases in consumption (rural up 22% and urban up 19%), indicating economic improvement for lower-income groups.
Key Terms
- Monthly Per Capita Expenditure (MPCE): Average monthly expenditure per person on essentials like food, healthcare, education, transportation, and other basic needs.
- Consumption Inequality: Unequal distribution of consumption expenditures or goods and services across individuals or households within an economy. The Gini coefficient measures consumption inequality, where 0 represents perfect equality and 100 signifies perfect inequality.
What are the Implications of HCES Findings on Policy Making?
Rural Development:
- Rising rural incomes, driven by schemes like PM-KISAN and MGNREGA, warrant further policy support.
- Transport Infrastructure: High spending on conveyance in rural areas indicates the need for improved rural transport infrastructure.
- Investment Encouragement: Encourage investments in rural non-food sectors like conveyance and durable goods.
Sectoral Shifts:
- Shift towards a service-driven economy with growing expenditure on services like conveyance and entertainment.
- Policy Focus: Focus on skilling and job creation in emerging service sectors.
- Sustaining Rural Growth: Aim to sustain rural consumption growth through skill development and rural industrialization.
Urban Planning and Housing:
- High urban spending on rent and conveyance highlights the need for affordable housing policies.
- Public Transport: Improve public transport infrastructure to meet growing urban needs.
Regional Disparities:
- Focused interventions in states with lower-than-average consumption, such as Bihar, are needed.
- Intervention Areas: Education, healthcare, and employment to boost economic activity in lagging regions.
Consumer Protection:
- Processed Food Industry: Regulate processed food industries to ensure quality standards and consumer safety.
- Quality Standards: Implement and enforce quality standards for processed foods to protect consumers.
SBI Reports Decline in Poverty in India

The recent poverty estimates in India, as reported by the State Bank of India (SBI), indicate a significant decline in both rural and urban poverty levels. These estimates are based on data from the government's Consumption Expenditure Survey and represent an inflation-adjusted poverty line from 2011-12, originally computed by the Suresh Tendulkar committee.
Key Findings
- Rural Poverty: Decreased to 4.86% in FY24 from 7.2% in FY23 and 25.7% in FY12.
- Urban Poverty: Dropped to 4.09% from 4.6% in FY23 and 13.7% in FY12.
- Reasons for Improvement: The decline in poverty is attributed to higher consumption growth among the bottom 5% of the population, leading to a shift in the poverty line. The poverty line represents the minimum expenditure or income required to purchase a basket of goods and services necessary for basic human needs. Individuals with income levels below this threshold are classified as poor.
Poverty Estimation in India (Major Committees)
- Lakdawala Committee (1993): Recommended calculating poverty based on consumption expenditure related to calorie intake.
- Tendulkar Committee (2009): Shifted away from calorie-based poverty lines and introduced a uniform all-India urban Poverty Line Basket.
- Rangarajan Committee (2014): Reinstated separate rural and urban poverty lines and state-specific estimates.
Government Initiatives for Poverty Eradication
- Affordable Healthcare: Programs like Ayushman Bharat Yojana and Pradhan Mantri Bharatiya Janaushadhi Pariyojana aim to provide accessible and affordable healthcare to the population.
- Social Security and Empowerment: Initiatives such as Pradhan Mantri Matru Vandana Yojana and Pradhan Mantri Garib Kalyan Anna Yojana focus on social security and empowerment of vulnerable groups.
- Financial Inclusion: Schemes like PM Jan Dhan Yojana and PM Ujjwala Yojana promote financial inclusion and provide support to marginalized sections of society.
- Employment and Skill Development: Programs such as MGNREGA and PM Kaushal Vikas Yojana aim to enhance employment opportunities and skill development for the workforce.
Extension of Crop Insurance Schemes

Why in News?
The Union Cabinet has approved critical measures to support Indian farmers, including the extension of a special subsidy for Diammonium Phosphate (DAP) fertilizers and the continuation of crop insurance schemes until 2025-26.
What are Recent Key Measures to Support Indian Farmers?
- Crop Insurance Scheme: The Union Cabinet approved the continuation of the Pradhan Mantri Fasal Bima Yojana and Restructured Weather Based Crop Insurance Scheme (RWBCIS) till 2025-26.
- Di-Ammonium Phosphate (DAP): It approved extending the one-time special package on DAP beyond the Nutrient Based Subsidy from 1st January, 2025, till further orders. This ensures affordable DAP fertilizers for farmers in Kharif and Rabi 2024-25, despite global market volatility.
- Fund for Innovation and Technology (FIAT): The Cabinet approved the creation of FIAT with a corpus of Rs 824.77 crore for funding technological initiatives under the scheme, namely, YES-TECH and WINDS, aimed at increasing transparency and improving claim calculation and settlement processes.
- Yield Estimation System using Technology (YES-TECH): YES-TECH employs remote sensing technology for yield estimation, giving at least 30% weightage to technology-based yield estimates.
- Weather Information and Network Data Systems (WINDS): WINDS aims to install automatic weather stations at the block level and rain gauges at the panchayat level, significantly increasing network density for hyper-local weather data.
Pradhan Mantri Fasal Bima Yojana (PMFBY)
- About: It is a crop insurance scheme to protect farmers from financial losses due to unforeseen crop failures like rainfall, temperature, frost, humidity etc.
- Aim: It is a central sector scheme and provides comprehensive crop insurance from pre-sowing to post-harvest period.
- Coverage: It covers food crops (cereals, millets and pulses), oilseeds and annual commercial/annual horticultural crops. All farmers including sharecroppers and tenant farmers growing notified crops in the notified areas are eligible for coverage.
- Premium: Farmers pay a premium of 2% for Kharif crops, 1.5% for Rabi crops, and 5% for commercial horticulture crops under the scheme.
India-Latin America Trade Relations

Why in News?
The Latin America and Caribbean (LAC) region has become a key focus of India's foreign policy, with sustained growth and diversified ties across all 33 nations. Despite progress, India still lags behind China, which has a far stronger presence in the region.
How is India's Relation with Latin America?
Historical Background
- Rich Ties: India-Latin America relations have a rich history, marked by significant contributions from figures like Pandurang Khankhoje (an agricultural scientist who played a key role in the advancement of agricultural practices in Mexico) and M.N. Roy (a political activist, founded both the Indian and Mexican Communist parties).
- India and Latin America shared a vibrant exchange of literary ideas through poet-diplomats and authors like Octavio Paz, Rabindranath Tagore, and Victoria Ocampo, shaping mutual perceptions.
- India’s poet-diplomat Abhay K, has authored books of poetry on the Latin American region, such as The Alphabets of Latin America and The Prophecy of Brasilia.
- Early Engagements: High-level engagement began with Prime Minister Nehru's visit to Mexico in 1961, followed by Indira Gandhi's tour of eight Latin American and Caribbean (LAC) nations in 1968.
- Recent Developments: The relationship gained momentum with PM Modi's participation in the BRICS Summit in Brazil in 2014.
- Economic Liberalization: Post-1990s economic liberalization led to strengthened trade, investments, and renewable energy cooperation.
- India signed trade agreements with seven LAC nations and launched the FOCUS LAC Program in 1997 to enhance exports and economic collaboration.
Current Trade Landscape
- Trade Figures: In 2023, India's imports from Latin America reached USD 22.93 billion, while exports stood at USD 20.09 billion, totaling a trade volume of USD 43.22 billion with a target of USD 100 billion by 2028.
- Key Trade Partners: Brazil, Mexico, and Colombia are India's primary trade partners in the region.
- Import Composition: Major imports include petroleum oils, gold (including gold plated with platinum), and soybean oil.
- Export Composition: Key exports consist of petroleum oils (excluding crude), motor cars, and other motor vehicles designed for transportation.
- Economic Positioning: Latin America is considered to be in the “goldilocks zone” for India—offering a balance between highly regulated markets like the US and Europe and less competitive markets in Africa.
Political and Bilateral Cooperation
- Foreign Policy Priority: Historically, Latin America has been a low priority in India's foreign policy due to its limited geopolitical influence. However, recent developments indicate a significant shift in this approach.
- Notably, External Affairs Minister S. Jaishankar undertook a landmark visit to Guyana, Panama, Colombia, and the Dominican Republic in April 2023, marking the first time an Indian foreign minister has visited these countries.
- Enhanced Engagements: In 2022, G20 members Argentina, Brazil, and Mexico were placed under the purview of India’s foreign minister instead of a junior minister.
- Brazil's Leadership Role: Brazil is recognized as having the most political linkages with India due to its active participation in multilateral forums such as BRICS, IBSA (India, Brazil and South Africa), and the G20.
- Preferential Trade Agreements (PTAs): The signing of PTAs between India and Chile as well as India and Mercosur reflects Latin America's commitment to strengthening economic relations with India.
- MERCOSUR, a Latin American trading bloc established in 1991, comprises six members namely, Brazil, Argentina, Uruguay, and Paraguay, Venezuela, and Bolivia.
- Initially aimed at facilitating the free movement of goods, services, capital, and people, it became a customs union in 1995 and is now advancing towards a Common Market.
- Strategic Autonomy: Both regions have embraced a form of non-alignment termed ‘strategic autonomy’ by India and ‘Active Non-alignment’ (ANA) by Latin American countries, particularly evident in their shared positions regarding global issues like the war in Ukraine.
Cultural Ties:
- Literary Influences: Tagore's visit to Argentina in 1924 and his literary contributions have left a lasting impression on Latin American literature through translations by Mexican philosopher José Vasconcelos.
- Gandhi's Legacy: Mahatma Gandhi’s teachings on non-violence resonate strongly in Latin America, celebrated by organizations like Palas Athenas in Brazil.
Trade Agreements/MoUs with LAC region:
- India – Chile PTA
- India – MERCOSUR PTA
- Trade Agreement between India and Argentina
- MoU on Economic Cooperation with Ecuador
- Trade Agreement between India and Cuba
What is the Importance of Latin America for India?
- Economic Opportunities: Latin America is rich in natural resources, including minerals like copper, lithium, and iron ore, which are vital for India’s growing industrial demands.
- The region's collective GDP exceeds USD 6 trillion, providing a substantial market for Indian exports and investments.
- Energy Security: With a rising demand for energy, Latin America has emerged as a key supplier of crude oil to India.
- In recent years, Crude oil imports from Venezuela, Mexico, and Brazil accounted for 30% of India’s total import from LAC.
- Strategic Partnerships: The geopolitical landscape has shifted, prompting India to enhance its engagement with Latin America to counterbalance China's growing influence in the region.
- Cultural and Educational Exchange: The cultural ties between India and Latin America have been bolstered through educational exchanges and collaborations in sectors like information technology and pharmaceuticals.
- Indian IT companies employ over 40,000 local professionals in the region, contributing to job creation and skill development.
- Food Security: Latin America's vast agricultural landscape offers opportunities for India to secure food supplies, particularly in pulses and oilseeds, which are essential for food security.
What are the Sectors in which India is Cooperating with Latin American Nations?
- Pharmaceuticals and Healthcare: India is recognized globally for its pharmaceutical industry, providing high-quality medicines at affordable prices.
- The top five destinations for these exports are the USA, Belgium, South Africa, the UK, and Brazil.
- Energy Cooperation: India is exploring and extracting lithium deposits in Bolivia. In 2023, India’s Altmin Private Limited signed a strategic partnership agreement with Bolivia's state-owned lithium company.
- Bolivia also joined the International Solar Alliance.
- Agriculture and Food Security: The LA region has vast agricultural resources that helps India in addressing its food security concerns.
- Collaborations in food processing and agricultural research are being explored to enhance productivity and sustainability in both regions.
- Infrastructure Development: Collaboration in developing modern infrastructure across LA nations, including railways, highways, and energy pathways.
- India values its development partnership with Bolivia under South-South Cooperation and has extended a USD 100 million Line of Credit to support development projects in sectors of Bolivia's choice.
What are the Challenges in Deepening Engagement with Latin American Nations?
- Lack of Regional Mechanisms: India has yet to develop a framework to engage Latin America as a region or with sub-groups like Central American Integration System (SICA), Community of Latin American and Caribbean States (CELAC), Mercosur, and the Pacific Alliance.
- Regional integration within Latin America remains incomplete, making bilateral ties more feasible in the short term.
- Limited Trade Agreements: Existing Preferential Trade Agreements (PTAs) with Mercosur and Chile are narrow in scope compared to India’s FTAs with South Korea, Japan, or ASEAN.
- Despite growing exports, Latin America faces economic challenges such as inflation, political instability, and low investment in infrastructure, impacting trade.
- China's Dominance: India faces competition from China’s established trade presence, strategic investments, and free trade agreements (FTAs) with key Latin American countries.
- Geographical Barriers: Despite positive developments in trade sectors and cultural ties, geographical distance and language barriers pose challenges for social interactions, including high travel costs and visa difficulties for Indians traveling to Latin America.
- Many Indians still view Latin American countries through outdated stereotypes, such as "banana republics" characterized by instability and drug trafficking. Conversely, Latin Americans often see India as merely a land of spiritualism and gurus.
- Bilateral Synergies: The relationship is driven by bilateral cooperation on issues like climate change, trade, and security, though strategic sectors such as defense and space have seen limited engagement.
What Strategies can India Adopt to Increase its Relations with Latin America?
- Reactivating "Focus:LAC" Programme: This trade promotion programme can strengthen market access, improve institutional mechanisms, and develop economic infrastructure, creating a conducive environment for business.
- Increase selective trade where India have competitive advantage, like
- Bilateral Agreements and Investment Promotion: India must pursue Free Trade Agreements (FTAs) and preferential trade arrangements with Latin American countries, focusing on sectors like technology, agriculture, and clean energy.
- Promoting People-to-People (P2P) and Business-to-Business (B2B) Connections between India and Latin American countries will facilitate cultural exchanges and enhance economic collaboration.
- Diplomatic Engagement: Strengthening diplomatic ties through high-level visits, participation in regional trade summits, and fostering cultural exchange can pave the way for deeper economic collaboration.
- Enhanced Export Promotion: Indian exporters need financial support and targeted efforts to penetrate the Latin American market.
- Export promotion councils and industry associations can play a pivotal role in this regard.
- Advocating for Latin American Interests: India should actively raise its voice for Latin American nations such as Venezuela, Argentina, and Haiti in international forums.
- By doing so, India can strengthen its diplomatic ties and showcase solidarity with these nations, especially in addressing issues like economic instability and political challenges.
- Services Trade Enhancement: Create a comprehensive database of non-tariff barriers in services sectors across FTA partners.
- Establish mutual recognition agreements for professional qualifications on priority basis.
- Develop a digital platform for service providers to report market access issues.
- For example, implement a system similar to the EU's Trade Barriers Reporting mechanism.
- Set up dedicated service export promotion councils with market-specific strategies.
|
164 videos|800 docs|1157 tests
|


Exam
,past year papers
,study material
,MCQs
,Sample Paper
,Free
,Important questions
,practice quizzes
,video lectures
,Previous Year Questions with Solutions
,mock tests for examination
,Economic Development: January 2025 Current Affairs | General Test Preparation for CUET UG - CUET Commerce
,Viva Questions
,Economic Development: January 2025 Current Affairs | General Test Preparation for CUET UG - CUET Commerce
,Objective type Questions
,Semester Notes
,shortcuts and tricks
,ppt
,Extra Questions
,Summary
,Economic Development: January 2025 Current Affairs | General Test Preparation for CUET UG - CUET Commerce
;


Economic Development: January 2025 Current Affairs Free PDF Download
Importance of Economic Development: January 2025 Current Affairs
Economic Development: January 2025 Current Affairs Notes
Economic Development: January 2025 Current Affairs CUET Commerce Questions
Study Economic Development: January 2025 Current Affairs on the App
|
© EduRev
|
Education Revolution
|


|


