Line Charts: Shortcuts & Tricks | Quantitative Techniques for CLAT PDF Download
Tips and Tricks for Line Chart
- Slope (m) of the Line: The slope of the line connecting two data points (x1, y1) and (x2, y2) can be calculated using the following formula:
m = (y2 -y1 / (x2 – x1).
This formula represents the rate of change between the two data points and indicates whether the data is increasing or decreasing. - Equation of a Straight Line: The equation of a straight line in the slope-intercept form is commonly used to represent a line on a line chart:
y = m(x) + b- y is the dependent variable (vertical position).
- x is the independent variable (horizontal position).
- m is the slope of the line.
- b is the y-intercept, representing the value of y when x is zero.
This equation can be used to calculate the y-values for any given x-values along the line.
- Interpolation: Line charts often use interpolation to estimate y-values for x-values that fall between two data points. Interpolation is typically done linearly, assuming a constant rate of change between data points.
- Plotting Data Points: To create a line chart, you plot the data points on the graph with x-values on the x-axis and corresponding y-values on the y-axis. Then, connect these points with straight line segments.
- Labeling and Scaling: Properly label the x-axis and y-axis with appropriate titles and units. Ensure that the scale of the axes is chosen to clearly represent the data and trends.
Important Points
- Read the questions along with the instruction carefully.
- Understand and analyze the data given in Line Graph carefully.
- Understand the usage of Percentage to Fraction Conversion.
- Try to avoid unnecessary calculation .
- Do not assume anything other than data provided.
- When it comes to long addition , subtraction , multiplication and division, discover your own method to arrive at the answer in the minimum time.
- Clear the fundamentals of DI. DI questions are based on Averages , Percentage and Ratio and Proportion concepts .
Examples

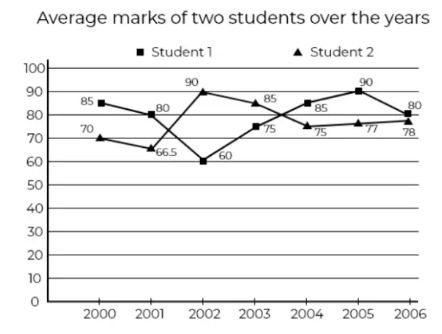
Q1: What percent is student 1’s average marks to that of student 2’s average marks in the 4th year
(a) 88.2
(b) 85.6
(c) 90
(d) 87.6
Ans: a
Sol:
In 2003, Student 1 = 75
Student 2 = 85
Required % = 75/85 * 100 = 88.2
Q2: What is the ratio of the average marks of Student 1 over the years to that of Student 2?
(a) 79.2 : 773
(b) 792 : 773
(c) 79 : 77
(d) None of these
Ans: a
Sol:
Average marks of student 1 = (85 + 80 + 60 + 75 + 85 + 90 + 80)/7 = 79.2
Average marks of student 2 = (70 + 66.5 + 90 + 85 + 75+ 77 + 78)/7 = 77.3
Ratio = 79.2 : 77.3
Q3: In which of the following years is the total marks maximum?
(a) 2006
(b) 2001
(c) 2003
(d) 2000
Ans: d
Sol:
Quicker Method: Since the number of subjects are the same, the total marks would be higher in the year whose average marks is the highest. Hence, 2000
Q4: What would be the ratio of Student 1’s total average marks of the first and the last year to Student 2’s difference of marks in the first and last year
(a) 9 : 10
(b) 165 : 8
(c) 8 : 165
(d) 1
Ans: b
Sol:
Student 1’s total marks in 1st and last year = 85 + 80 = 165
Student 2’s difference in marks in 2st and last year = 78 – 70 = 8
Ratio = 165 : 8
Q5: In which of the following years was the investment minimum for company B?
In which of the year the total marks is minimum for Student 2
(a) 2004
(b) 2005
(c) 2003
(d) 2002
Ans: a
Sol: Quicker Method: Since the number of subjects are the same, the total marks would be minimum in the year whose average marks is the lowest. Hence, 2004
|
49 videos|179 docs|73 tests
|
FAQs on Line Charts: Shortcuts & Tricks - Quantitative Techniques for CLAT
| 1. What are some shortcuts for creating line charts? |  |
| 2. How can I customize the appearance of a line chart? |  |
| 3. Can I add multiple lines to a single line chart? |  |
| 4. How do I interpret the data presented in a line chart? |  |
| 5. Can I use line charts for non-numerical data? |  |


