NCERT Solutions for Class 11 Economics - Market Equilibrium

Q1: Explain market equilibrium.
Ans: Market equilibrium occurs when the quantity of a good or service that consumers want to buy matches the quantity that producers want to sell at a specific price. This situation arises when demand and supply intersect, leading to:
- A stable price with no need for change.
- Consumers achieve maximum satisfaction from their purchases.
- Producers obtain the highest possible profit from their sales.
- No surplus or shortage in the market; everything produced is sold.
At this point, there is no incentive for changes in quantity demanded, quantity supplied, or price, represented as yd = ys.
Q2: When do we say that there is an excess demand for a commodity in the market?
Ans: Excess demand occurs when the quantity of a commodity that consumers want to buy is greater than what producers are willing to supply at a specific price. This situation can be summarised as follows:
- If at a certain price, producers supply less than what consumers demand, it leads to excess demand.
- This often results in shortages in the market.
- As a result, prices tend to rise as consumers compete for the limited supply.
 Q3: When do we say that there is an excess supply for a commodity in the market?
Ans: Excess supply occurs when the quantity of a commodity supplied by producers exceeds the quantity demanded by consumers at a specific price. This situation arises when:
- Producers are offering more of a product than consumers are willing to buy.
- This leads to unsold stock.
- Sellers may lower prices to attract more buyers.
 Q4: What will happen if the price prevailing in the market is
(i) above the equilibrium price?
(ii) below the equilibrium price?
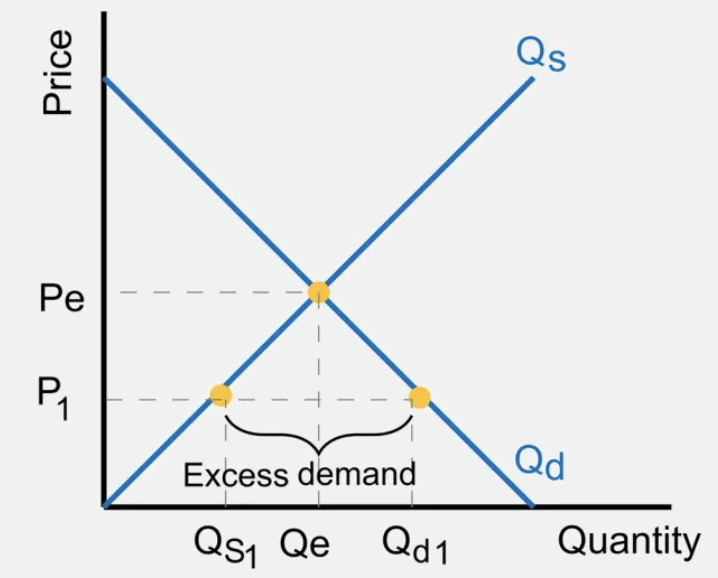
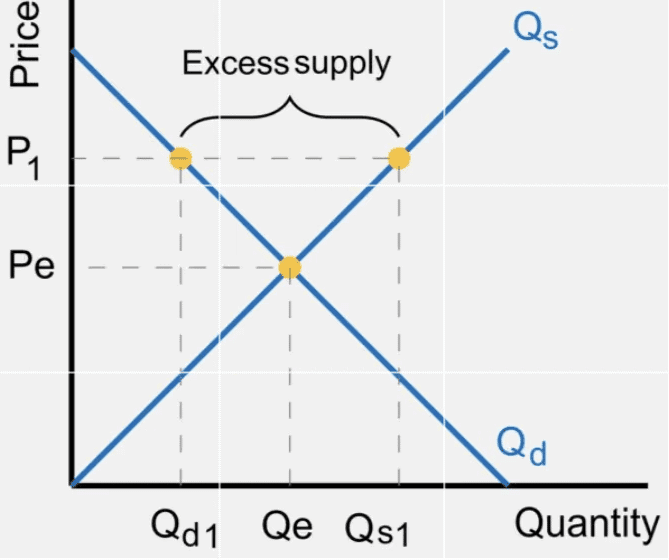
Ans: (i) If the market price is above the equilibrium price, there occurs the situation
of excess supply.
In the given figure, the equilibrium price and quantity is demoted by Pe and qe.
Let us assume that the market price (P1) is above the equilibrium price Pe. Now, according to the demand curve, the quantity demanded is qd. Whereas, according to the supply curve, the quantity supplied is qs. Thus, there exists a situation of excess supply equivalent to (qs − qd).
(ii) If the market price is below the equilibrium price, there occurs the situation of excess demand.
Let us assume that the market price P2 is below the equilibrium price Pe. According to the demand curve, the quantity demanded is q′d. Whereas, according to the supply curve, the quantity supplied is q′s. So, it can be seen that there emerges the situation of excess supply equivalent to (q′d − q′s).
Q5: Explain how price is determined in a perfectly competitive market with a fixed number of firms.
Ans: In a perfectly competitive market with a fixed number of firms, the equilibrium price is set where the market demand and supply curves intersect. Here’s how it works:
- If the price is above the equilibrium price (e.g., Rs 12), there will be excess supply. This leads to increased competition among sellers, prompting them to lower their prices to sell more.
- As prices decrease, the market moves towards the equilibrium price (e.g., Rs 8), where demand equals supply.
- If the price falls below the equilibrium price (e.g., Rs 2), there will be excess demand. Buyers will compete for the limited supply, driving prices up.
- This competition continues until the price rises back to the equilibrium price (Rs 8), restoring balance in the market.
This process illustrates how the invisible hand of the market works to maintain equilibrium by automatically adjusting prices in response to changes in supply and demand.
 Q6: Suppose the price at which the equilibrium is attained in exercise 5 is above the minimum average cost of the firms constituting the market. Now if we allow for free entry and exit of firms, how will the market price adjust to it?
Ans: If the equilibrium price (Rs 8) is above the minimum average cost, firms are making supernormal profits. This situation encourages new firms to enter the market.
- As new firms join, the overall industry supply increases.
- This influx of firms continues until the market price falls.
- The price will decrease until it equals the minimum average cost.
- At this point, supernormal profits are eliminated, and all firms earn normal profits.
With free entry and exit, the market equilibrium is determined where the demand curve intersects the P = min AC line. This ensures that no firm has an incentive to enter or exit the market, stabilising the price at the minimum average cost.
Q7: At what level of price do the firms in a perfectly competitive market supply when free entry and exit is allowed in the market? How is the equilibrium quantity determined in such a market?
Ans: In a perfectly competitive market with free entry and exit, firms supply at a price where they earn zero economic profit, known as normal profit. This occurs because:
- Firms will enter the market if they can earn profits above normal profit.
- Firms will exit if they incur losses.
- In the long run, the market price stabilises at the minimum average cost (min AC).
The equilibrium price is determined at the point where the demand curve intersects the price line at min AC. At this equilibrium point:
- Each firm produces a quantity qe at price P.
- The total quantity supplied matches the total quantity demanded.
Thus, in the long run, the equilibrium price equals the minimum average cost, ensuring that all firms earn normal profit.
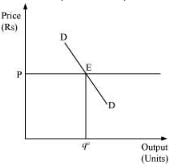
Q8: How is the equilibrium number of firms determined in a market where entry and exist is permitted?
Ans: The characteristic of free entry and exit of firms ensures that all the firms in a perfectly competitive market earn a normal profit, i.e. the market price is always equal to the minimum of LAC. No new firm will be attracted to enter the market or no existing firm will leave if the price is equal to the minimum of LAC. Thus, the number of firms is determined by the equality of price and the minimum of LAC. The market equilibrium is determined by the intersection of the market demand curve (D1D1) and the price line. The equilibrium price is P1 and the equilibrium output is q1. At this equilibrium price, each firm supplies the same output q1f , as it is assumed that all the firms are identical. Therefore, at the equilibrium, the number of firms in the market is equal to the number of firms required to supply output q1 at price P1, and each in turn supplying q1f amount at this price. That is

Where,
n = number of firms at market equilibrium
q1 = the equilibrium quantity demanded
q1f = the quantity of output supplied by each firm
Q9: How are equilibrium price and quantity affected when income of the consumers
(a) increase?
(b) decrease?
Ans:
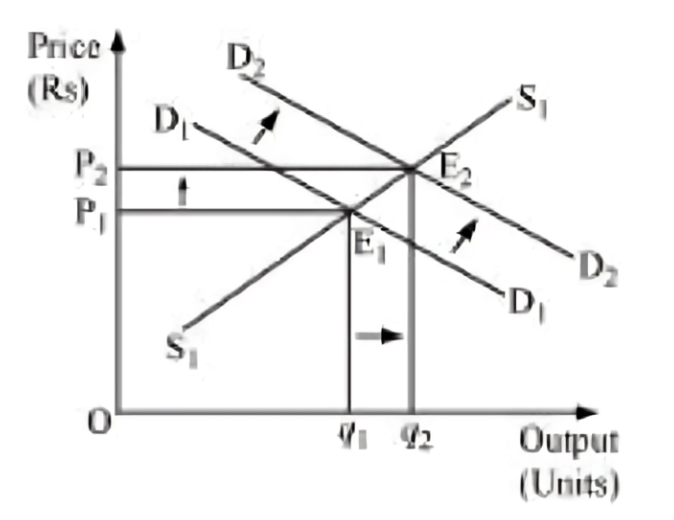
(a) Increase in income of consumers
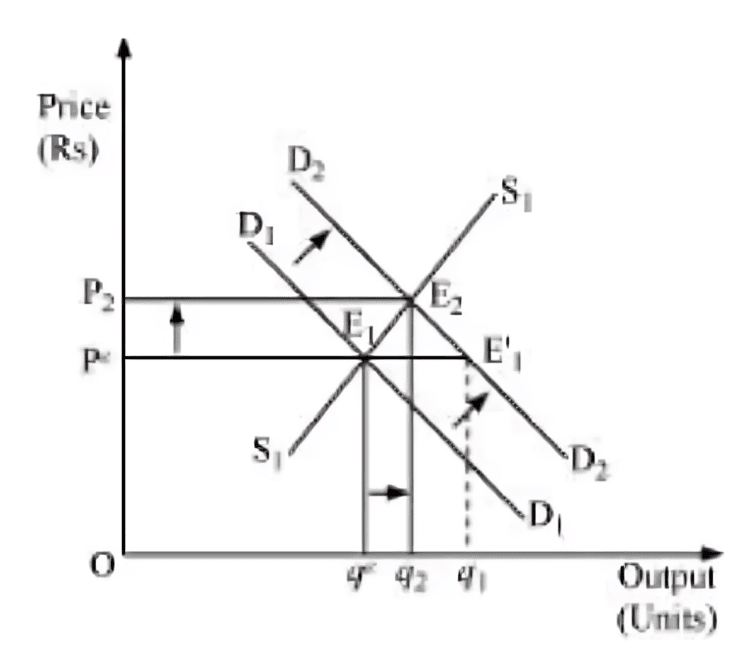
If the number of firms is assumed to be fixed, then the increase in consumers’ income will lead the equilibrium price to rise.
Let us understand how it happens:
D1D1 and S1S1 represent the market demand and market supply respectively. The initial equilibrium occurs at E1, where the demand and the supply intersect each other. Due to the increase in consumers’ income, the demand curve will shift rightward parallelly while the supply curve will remain unchanged. Hence, there will be a situation of excess demand, equivalent to (qe − q1). Consequently, the price will rise due to excess demand. The price will continue to rise until it reaches E2 (new equilibrium), where D2D2 intersects the supply curve S1S1. The equilibrium price increases from Pe to P2 and the equilibrium output increases from qe to q2.
(b) Decrease in the income of consumers
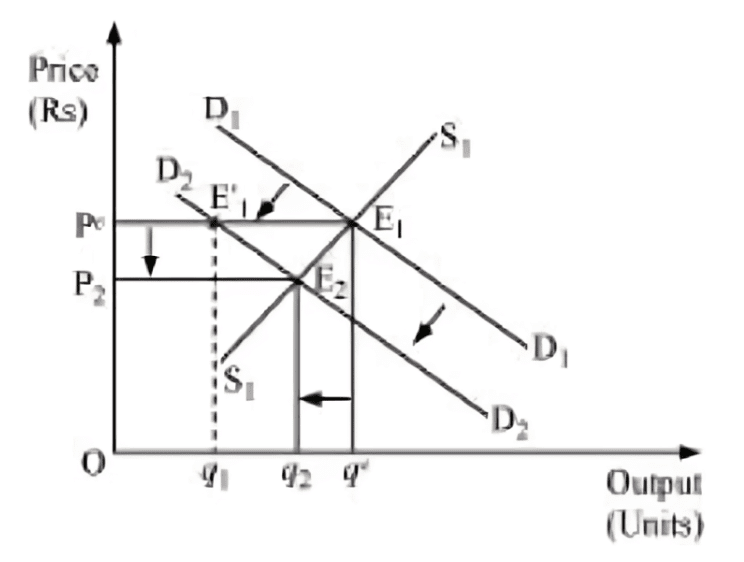
The decrease in consumers’ income is depicted by the leftward parallel shift of the demand curve from D1D1 to D2D2. Consequently, at the price Pe, there will be an execs supply (qe − q1), resulting in the price falling. At the new equilibrium (E2), where D2D2 intersect the supply curve, the equilibrium price falls from Pe to P2 and the equilibrium quantity falls from qe to q2.
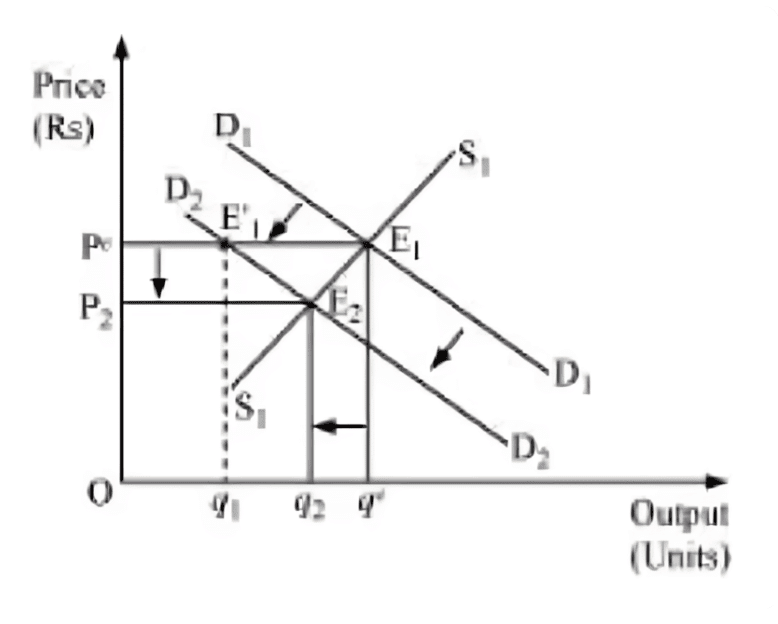
Q10: Using supply and demand curves, show how an increase in the price of shoes affects the price of a pair of socks and the number of pairs of socks bought and sold.
Ans: Shoes and socks are complementary goods, meaning they are often used together. When the price of shoes increases, it typically leads to a decrease in the demand for socks. This can be illustrated as follows:
- The demand curve for socks shifts leftward from D1D1 to D2D2.
- The supply of socks remains unchanged.
- At the original equilibrium price P^e, there is now an excess supply of socks.
- This excess supply causes the price of socks to decrease.
- The new equilibrium is established at E2, with a lower equilibrium price P2 and quantity q2.
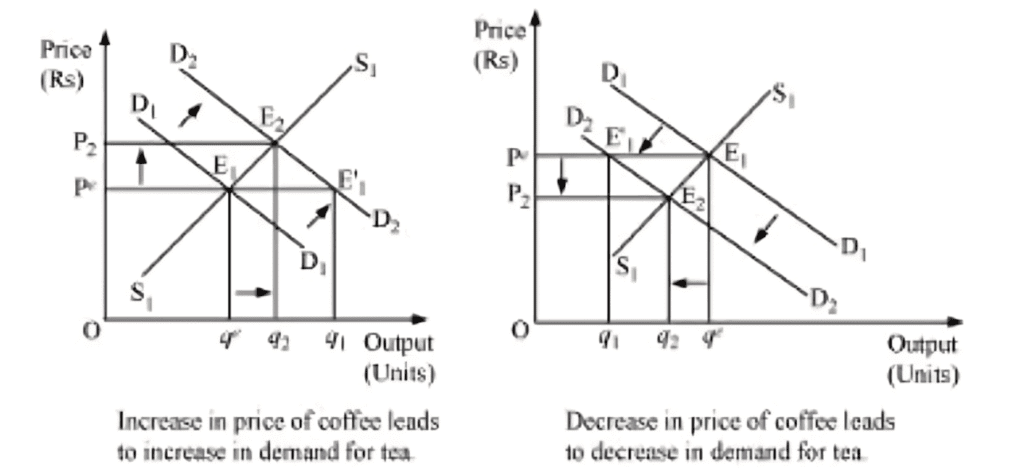
 Q11: How will a change in the price of coffee affect the equilibrium price of tea? Explain the effect on equilibrium quantity also through a diagram.
Ans: Coffee and tea are substitute goods, i.e. they are used in the place of each other. An increase or a decrease in the price of coffee will lead to an increase or a decrease in the demand for tea respectively.
The figure depicts the equilibrium of the tea market. The initial demand and supply of tea is depicted by D1D1 and S1S1 respectively. The initial equilibrium is at E1, with the equilibrium price (Pe) and equilibrium quantity (qe). Now, if the price of coffee increases, which will lead to an increase in the demand for tea (being a substitute good), the demand curve of tea will shift rightward parallelly. At the equilibrium price (Pe), there will be an excess demand for tea; consequently, the price of tea will rise. This will form the new equilibrium at E2, with the new equilibrium price P2 and the new equilibrium output q2. Hence, an increase in the price of coffee will lead the equilibrium price of tea to rise (due to excess demand). Further, the increase in the price of coffee will also lead to an increase in demand for tea as tea is the substitute good for coffee.
Now, if the price of coffee decreases, there will be a decrease in the demand for tea. The demand curve for tea will shift leftward parallelly to D2D2. At the equilibrium price (Pe), there will be an excess supply. Consequently, the price of tea will fall, which will form the new equilibrium at E2, with the new equilibrium price P2 and the new equilibrium output q2. Hence, a decrease in the price of coffee will lead to a decrease in the price of tea and a decrease in the demand for tea, as people will switch over to the consumption of coffee.
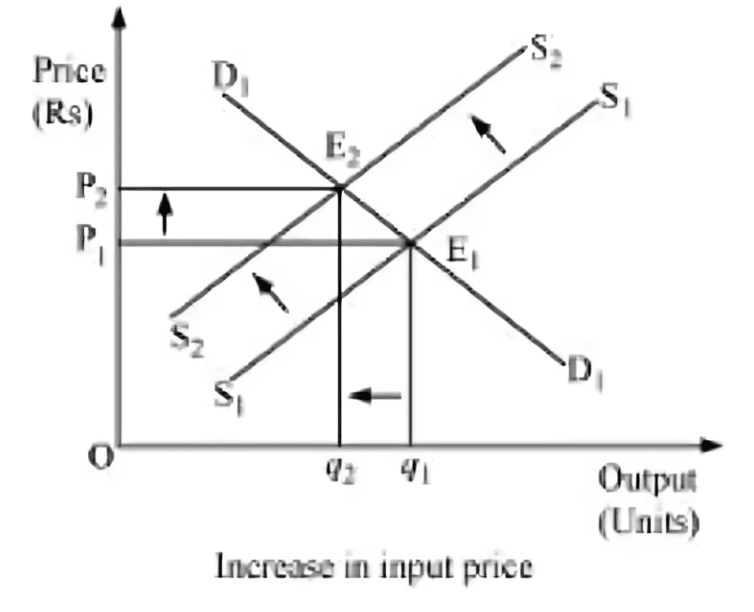
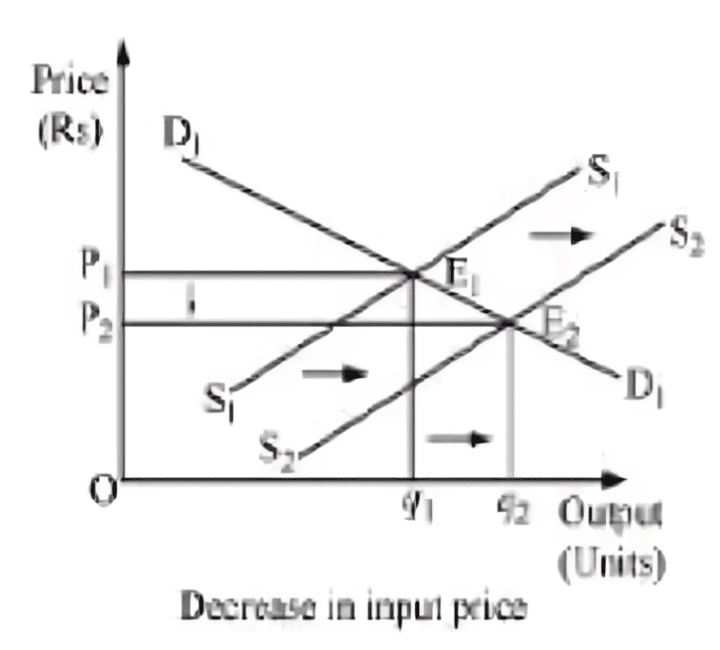
 Q12: How do the equilibrium price and the quantity of a commodity change when price of input used in its production changes?
Answer: The change in the price of input alters the cost of production of a commodity.
Let us analyze the two different cases.
Increase in input price
If the input price of a firm increases, the cost of production will also increase, which will discourage the firm’s incentive to produce and supply the commodity. This will lead to a left-upward shift of the marginal cost curve, which further will lead to a leftward parallel shift of an individual firm’s supply curve and finally a leftward shift of the market supply curve. The demand curve remains the same, the new equilibrium will occur at E2 with higher equilibrium price (P2) and lower quantity of output (q2).
Decrease in input price
If the input price of a firm decreases, then the cost of production will also decrease. This will shift the marginal cost curve rightward, which implies that the firm’s supply curve will also shift rightward. Consequently, the market supply curve will shift rightward parallelly from S1S1 to S2S2. The demand curve remains the same, the new equilibrium will occur at E2 with a lower equilibrium price (P2) and higher quantity level of output (q2).
 Q13: If the price of a substitute Y of good X increases, what impact does it have on the equilibrium price and quantity of good X?
Ans: X and Y are substitute goods, if the price of Y increases, then it will reduce the demand for Y and people will switch to X, which will raise the demand for X. Thus, the demand curve will shift from D1D1 to D2D2 . At the existing price P1, there will be an excess demand. Due to the pressure of excess demand, the existing price will increase. Consequently, the new equilibrium occurs at E2, where the new demand curve D2D2 intersects the supply curve S1S1. The new equilibrium price is P2, which is higher than P1 and the equilibrium quantity is q2, which is higher than q1. Therefore, due to the increase in the price of a substitute good Y, the equilibrium price of X will rise and the equilibrium output of X will also be higher.
 Q14: Compare the effect of shift in the demand curve on the equilibrium when the number of firms in the market is fixed with the situation when entry-exit is permitted.
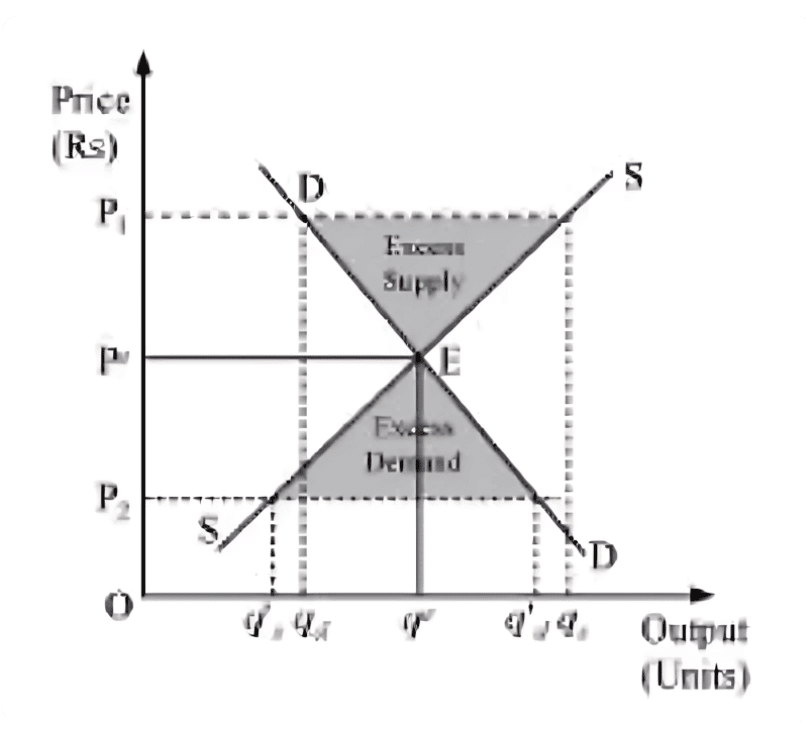
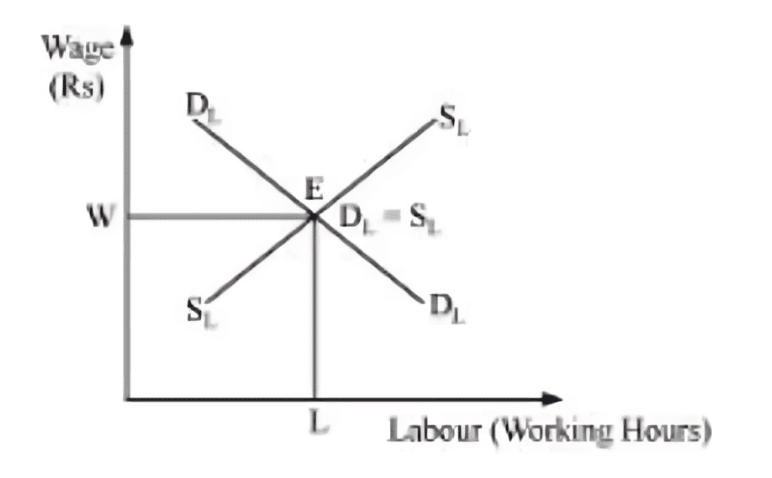
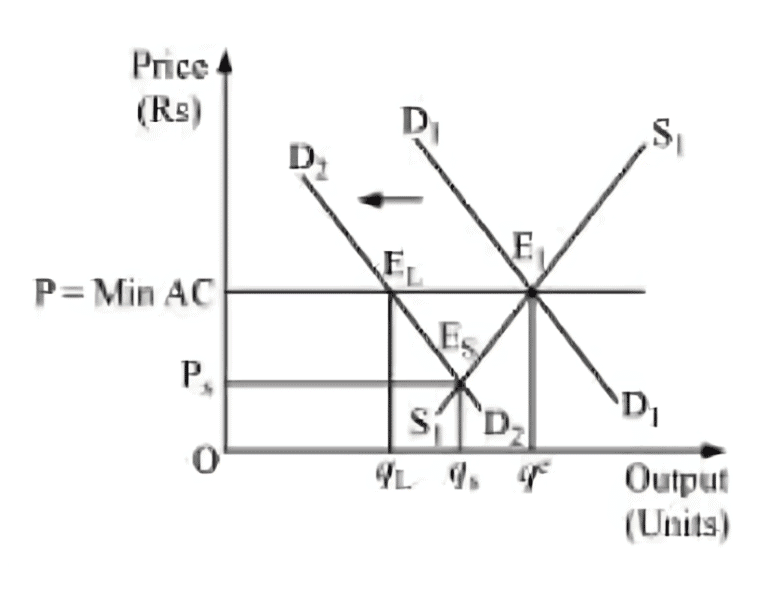
Ans:
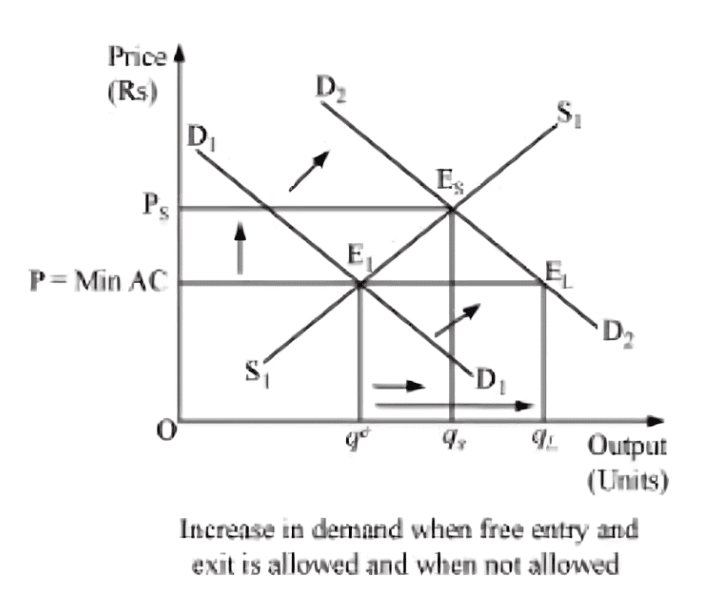
The above figure depicts the cases when the number of firms is fixed (in the short run) and when the number of firms is not fixed (in the long run). ‘P = min AC’ represents the long-run price line, D1D1 and D2D2 represent the demands in the short run and the long run. The point E1 represents the initial equilibrium where the demand curve and the supply curve intersect each other. Now, let us suppose that the demand curve shifts under the assumption that the number of firms are fixed; thus, the new equilibrium will be at ES (in the short run), where the supply curve S1S1 and the new demand curve D2D2 intersect each other. The equilibrium price is Ps and the equilibrium quantity is qs.
Now let us analyse the situation under the assumption of free entry and exit.
The increase in demand will shift the demand curve rightwards to D2D2. The new equilibrium will be at E2. It is the long-run equilibrium with equilibrium price (P) = min AC and equilibrium quantity qL.
Therefore, on comparing both cases, we find that when the firms are given the freedom of entry and exit, the equilibrium price remains the same and the price is lower than the short-run equilibrium price (Ps); whereas, the long-run equilibrium quantity (qL) is more than that of the short run equilibrium (qs).
Similarly, for the leftward demand shift, it can be noted that the short-run equilibrium price (Ps) is less than the long-run equilibrium price and the short-run equilibrium quantity (qs) is less than the long-run equilibrium quantity qL.
Q15: Explain through a diagram the effect of a rightward shift of both the demand and supply curves on equilibrium price and quantity.
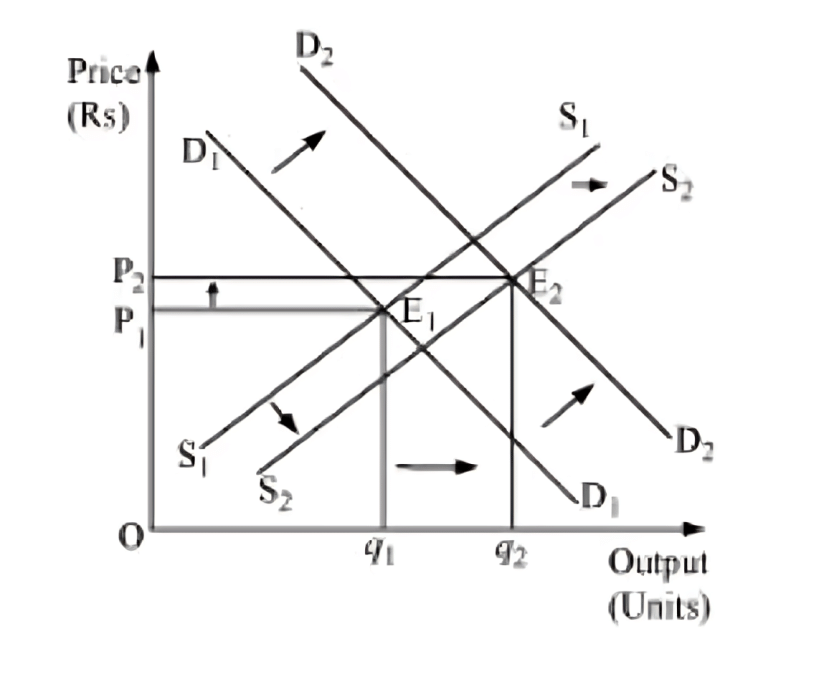
Ans: (a) When demand and supply increase in the same proportion:
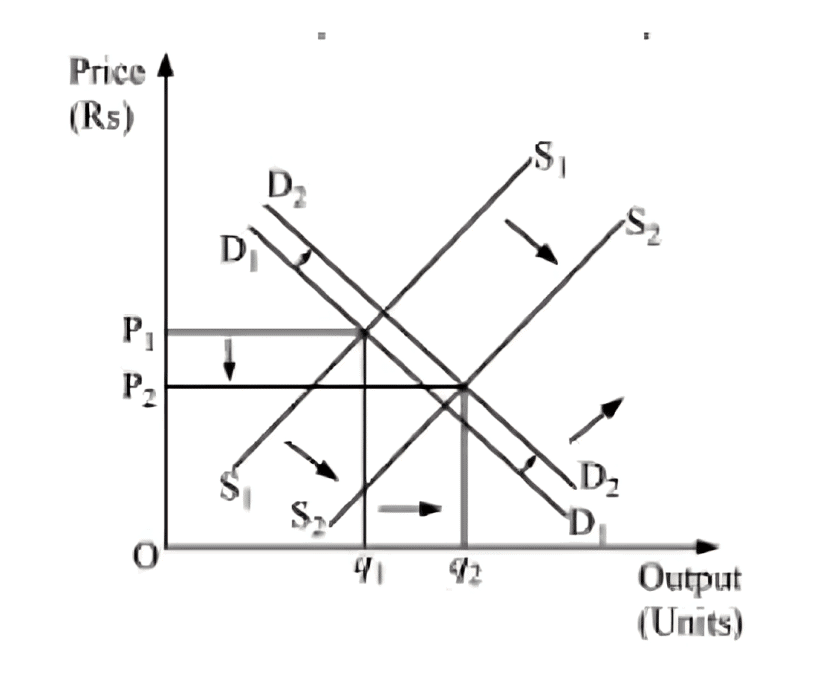
E1 is the initial equilibrium with equilibrium price P1 and equilibrium output q1.
Now, let us suppose that the demand increases to D2D2 and the supply increase to S2S2 by the same proportion. The new demand and new supply curve intersect at E2, which is the new equilibrium, with a new equilibrium output q2, but the same equilibrium price P1. Thus, an increase in the demand and the supply by the same proportion leaves the equilibrium price unchanged.
(b) When demand increases more than the increase in supply:
The original demand and supply curves intersect each other at E1 with the initial equilibrium price P1 and initial equilibrium output q1.
Now, let us suppose that the demand increases and thereby the demand curve shifts to D2D2; the supply curve also shifts rightwards to S2S2. However, the increase in supply is less than the increase in demand. The new supply curve and the new demand curve intersect each other at point E2 with higher equilibrium price P2 and higher equilibrium output q2.
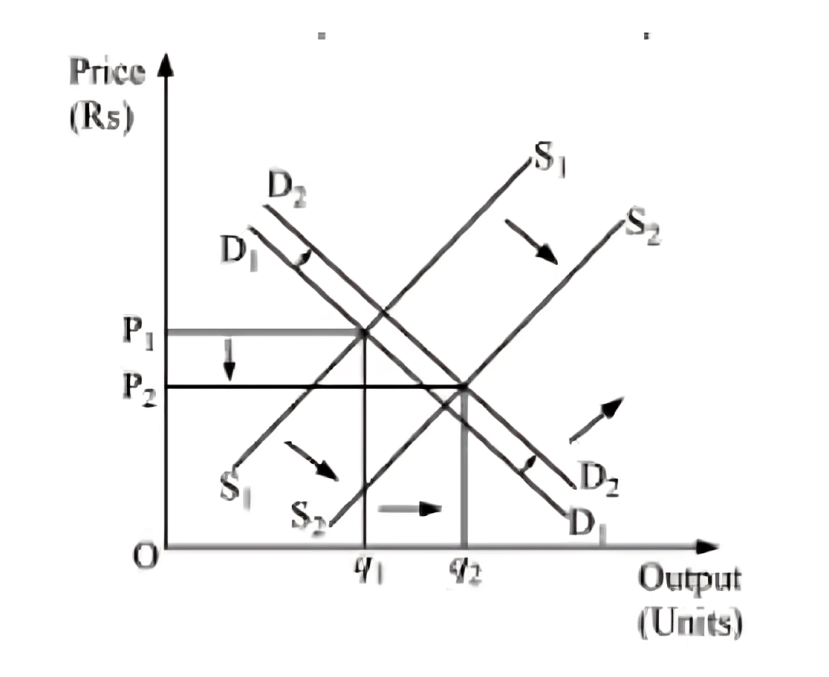
(c) When the increase in demand is less than the increase in supply:
Let the initial equilibrium be at E1 with the equilibrium price P1 and equilibrium output q1. Now, let us suppose that the demand increases to D2D2 and the supply increases to S2S2; where the increase in supply is more than that of demand. The new demand curve D2D2 and the new supply curve S2S2 intersect at E2. Thus, the greater increase in the supply curve as compared to the demand curve will lead the equilibrium price to fall and equilibrium output to rise.
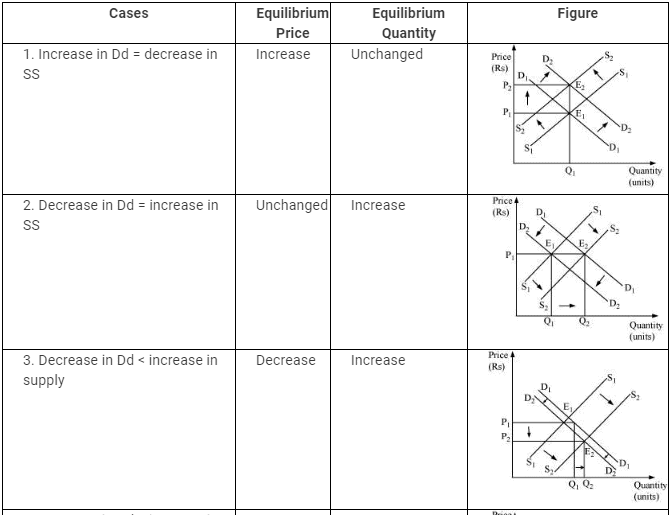
Q16: How are the equilibrium price and quantity affected when
(a) both demand and supply curves shift in the same directions?
(b) demand and supply curves shift in opposite directions?
Ans: (a) both demand and supply curves shift in the same direction
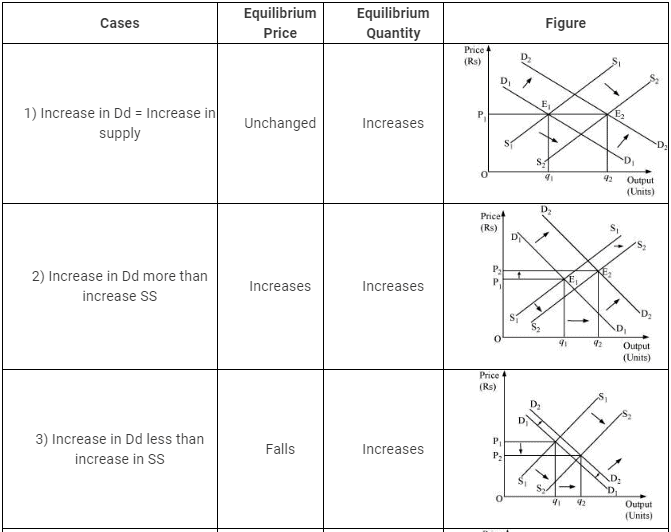
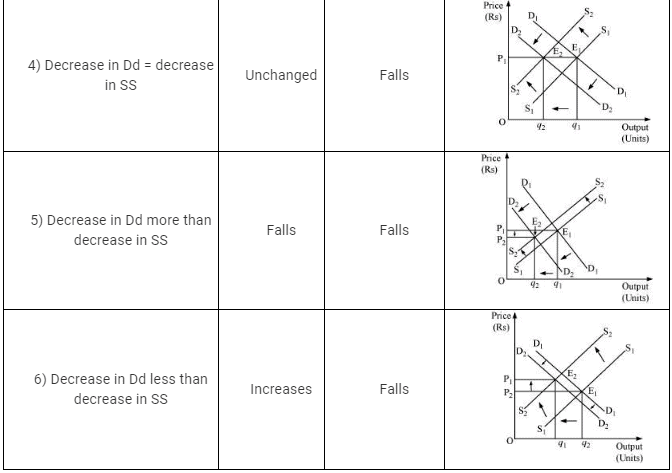
(b) demand and supply curves shift in opposite direction
Q17: In what respect do the supply and demand curves in the labour market differ from those in the goods market?
Ans: The supply and demand curves in the labour market differ from those in the goods market in several key ways:
- Demand Source: In the goods market, demand comes from consumers or households, whereas in the labour market, demand is generated by firms.
- Supply Source: The supply of goods is provided by firms, while the supply of labour is offered by households.
- Role of Participants: Firms act as suppliers in the goods market, but in the labour market, households take on this role.
These differences highlight the unique dynamics of each market.
Q18: How is the optimal amount of labour determined in a perfectly competitive market?
Ans: A profit-maximising firm will employ labour up to the point where the extra cost incurred by employing the last unit of labour (wage) equals the additional benefit it earns by employing that unit of labour.
That is, Marginal cost of labour = Marginal benefit by labour
Or, Wage rate = Marginal Revenue Product
Or, w = MRPL
Or, w = MR × MPL (as MRPL = MR × MPL)
Or, w = P × MPL (in Perfect competition Price = MR)
Or, w = VMPL (because VMPL = P × MPL)
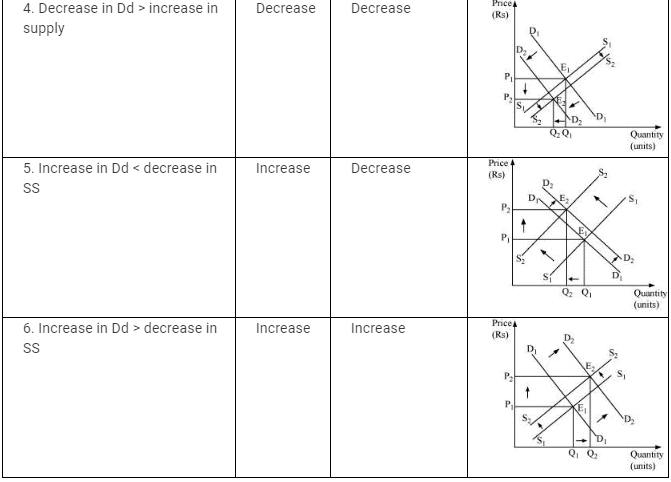
The demand for labour is derived from VMPL and the supply of labour is positively sloped. The equilibrium exists at E, where the demand for labour and the supply of labour intersect each other. The equilibrium wage rate is w and optimal amount of labour is qL.
Q19: How is the wage rate determined in a perfectly competitive labour market?
Answ: Similar to a goods market, wage rate in a labour market is determined by the intersection of demand for labour and supply of labour. The rate at which the demand equals the supply is called the equilibrium wage rate. Corresponding hours of labour are demanded and supplied in the labour market at the equilibrium wage rate.
The demand for labour is derived from the value of marginal product of labour (VMPL). We know that a particular firm will employ labour up to a point where marginal cost of employing the last unit of labour hired equals the marginal benefit earned by the firm by hiring that unit of labour.
Labour is supplied by those households, who need to trade-off between working hours (labour) or leisure. The supply of labour is a positive function of wage up to a point beyond which the supply curve becomes backward bending supply curve.
The intersection of demand for labour and the supply of labour occur at the wage rate w. Here, the equilibrium takes place at E where DLDL equals SLSL and the equilibrium units of labour supplied and demanded is L.
 Q20: Can you think of any commodity on which a price ceiling is imposed in India? What may be the consequences of price ceiling
Ans: In India, there are many goods on which the government has imposed a price ceiling, in order to keep them available within the reach of the BPL (below poverty lime) people. These goods are kerosene, sugar, wheat, rice, etc.
The following are the consequences of the price ceiling:
- Excess demand − Due to artificially imposed prices, cutting lower than the equilibrium price leads to the emergence of the problem of excess demand.
- Fixed Quota − Each consumer gets a fixed quantity of goods (as per the quota). The quantity often falls short of meeting the individual’s requirements. This further leads to the problem of shortage and the consumer remains unsatisfied.
- Inferior goods − Often it has been found that the goods that are rationed are usually inferior goods and are adulterated.
- Black marketing − The needs of a consumer remain unfulfilled as per the quota laid by the government. Consequently, some of the unsatisfied consumers get ready to pay a higher price for the additional quantity. This leads to black-marketing and artificial shortage in the market.
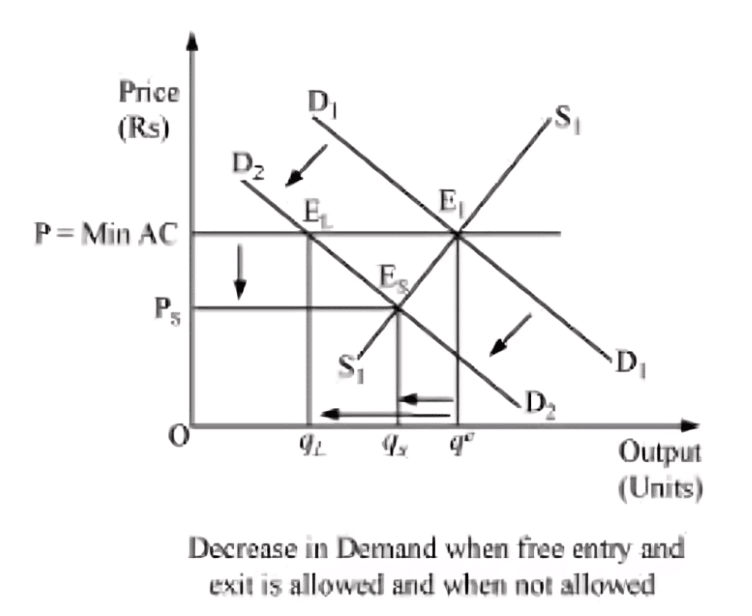
Q21: A shift in the demand curve has a larger effect on price and a smaller effect on quantity when the number of firms is fixed compared to the situation when free entry and exit is permitted. Explain.
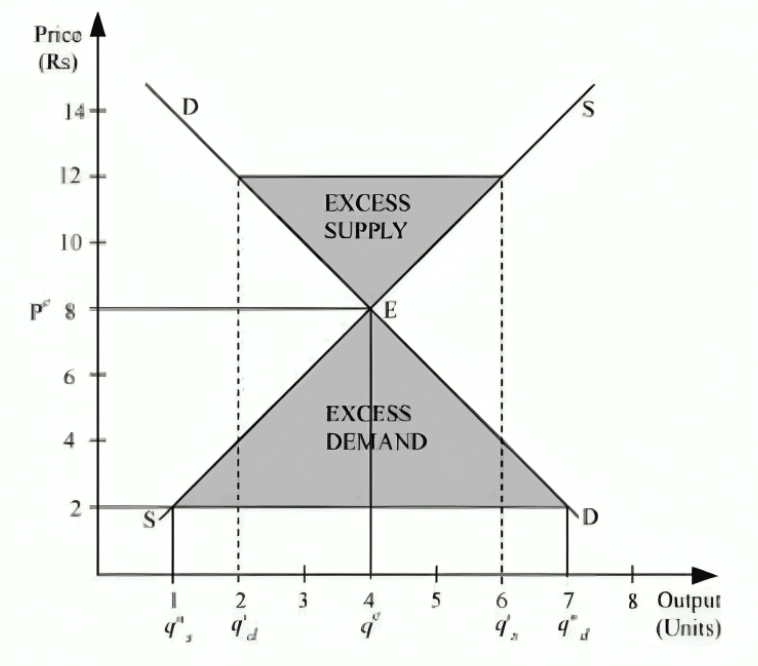
Ans:
The above figure depicts both the cases when the number of firms is fixed (in the short run) and when the number of firms is not fixed (in the long run). P = min AC represents the long-run price line; D1D1 and D2D2 represent the demand in the short run and the long run respectively. The point E1 represents the initial equilibrium, where the demand and the supply intersect each other.
Let us suppose that the demand curve shifts, assuming that the number of firms is fixed. Now, the new equilibrium will be at ES (as it is a short-run equilibrium), where the supply curve and the demand curve D2D2 intersect each other. The equilibrium price is Ps and the equilibrium quantity is qs.
On the other hand, under the assumption of free entry and exit, an increase in demand will shift the demand curve rightwards to D2D2. The new equilibrium will be at E2 (as it is a long-run equilibrium) with the equilibrium price P = min AC and equilibrium quantity qL.
Therefore, on comparing both cases, we find that when the firms are given the freedom of entry and exit, the equilibrium price remains the same. The price is lower than that of the short-run equilibrium price (Ps); whereas, the long-run equilibrium quantity (qL) is more than that of the short-run equilibrium quantity (qs).
Similarly, for the leftward demand shift, it can be found that the short-run equilibrium price (Ps) is lower than the long-run equilibrium price and the short-run equilibrium quantity (qs) is less than the long-run equilibrium quantity (qL)
 Q22: Suppose the demand and supply curve of commodity X in a perfectly competitive market are given by:
qD = 700 − p
qS = 500 + 3p for p ≥ 15
= 0 or 0 ≤ p 15
Assume that the market consists of identical firms. Identify the reason behind the market supply of commodity X being zero at any price less than Rs 15. What will be the equilibrium price for this commodity? At equilibrium, what quantity of X will be produced?
Ans: It is given that;
qd = 700 − p
qs = 500 + 3p for p > Rs 15
= 0 for 0 ≤ p < 15
The market supply is zero for any price from Rs 0 to Rs 15, this is because, for price between 0 to 15, no individual firm will produce any positive level of output (as the price is less than the minimum of AVC). Consequently, the market supply curve will be zero.
At equilibrium qd = qs
700 − p = 500 + 3p
− p −3p = 500 − 700
− 4p = − 200
p = 50
The equilibrium price is Rs 50.
Quantity = qs = 500 + 3p
= 500 + 3 (50)
= 500 + 150
= 650
Therefore, the equilibrium quantity is 650 units.
Q23: Considering the same demand curve as in exercise 22, now let us allow for free entry and exit of the firms producing commodity X. Also assume the market consists of identical firms producing commodity X. Let the supply curve of a single firm be explained as
qSf = 8 + 3p for p ≥ 20
= 0 for 0 ≤ p < 20
(a) What is the significance of p = 20?
(b) At what price will the market for X be in equilibrium? State the reason for your answer
(c) Calculate the equilibrium quantity and number of firms.
Ans:
qsf = 8 + 3 p for p ≥ Rs 200
= 0 for 0 ≤ p < Rs 20.
qd = 700 − p
(a) For the price between 0 to 20, no firm is going to produce anything as the price in this range is below the minimum of LAC. So, at the price of Rs 20, the price line is equal to the minimum of LAC.
(b) As there exists the freedom of entry and exit of firms, the minimum of AVC is at Rs 20, also, the price of Rs 20 is the equilibrium price. This is because in the long run, all firms earn zero economic profit, which implies that the price of Rs 20 is the equilibrium price and at any price lower than Rs 20, the firm will move out of the market.
(c) At an equilibrium price of Rs 20
Quantity supplied = qs = 8 + 3p
= 8 + 3 (20)
qs = 68 units
Quantity demanded qd= 700 − p
= 700 − 20
qd = 680
Number of firms (n)=
n=
n = 10 firms
Therefore, the number of firms in the market is 10 and the equilibrium quantity in 680 units.
Q24: Suppose the demand and supply curves of salt are given by:
qD = 1,000 − p qS = 700 + 2p
(a) Find the equilibrium price and quantity.
(b) Now, suppose that the price of an input that used to produce salt has increased so, that the new supply curve is
qS = 400 +2p
How does the equilibrium price and quantity change? Does the change conform to your expectation?
(c) Suppose the government has imposed a tax of Rs 3 per unit of sale on salt. How does it affect the equilibrium rice quantity?
Ans:
qd = 1000 − p — (1)
qs = 700 + 2p — (2)
(a) At equilibrium
qd = qs
1000 − p = 700 + 2p
300 = 3 p
100 = p
p = Rs 100
qd = 1000-100 [Substituting the value of p in equation (1)]
= 900 units
So, the equilibrium price is Rs 100 and the equilibrium quantity is 900 units.
(b) New quantity supplied (q′s)
q′s = 400 + 2p
At equilibrium qd = q′s
1000 − p = 400 + 2p
600 = 3p
200 = p
p = Rs 200
Prior to the increase in the price of the input, the equilibrium price was Rs 100, and after the rise in the input price, the equilibrium price is Rs 200.
So the change in the equilibrium price in Rs 100 (200 − 100).
qd = 4000 − 200 [Subtitling the value of p in equation (1)]
= 800 units
The change in the equilibrium quantity is 100 units (i.e. 900 − 800 units).
Yes, this change is obvious, as due to the change in the input’s price, the cost of producing salt has increased which will shift the marginal cost curve leftward and move the supply curve to the left. A leftward shift in the supply curve results in a rise in the equilibrium price and a fall in the equilibrium quantity.
(c) The imposition of a tax of Rs 3 per unit of salt sold will raise the cost of producing salt. This will shift the supply curve leftwards and the quantity supplied equation will become
ys = 700 + 2 (p − 3)
At equilibrium
yd = ys
1000 − p = 700 +2 (p − 3)
1000 − p = 700 +2p − 6
306 = 3p = p
= p
p = Rs 102
Substituting the value of p in equation (1)
yd = 1000 − p
yd = 1000 − 102
yd = 898 units
Thus, the imposition of a tax of Rs 3 per unit of salt sold will result in an increase in the price of salt from Rs 100 to Rs 102. The equilibrium quantity falls from 900 units to 898 units.
Q25: Suppose the market determined rent for apartments is too high for common people to afford. If the government comes forward to help those, seeking apartments on rent by imposing control on rent, what impact will it have on the market for apartments?
Ans:
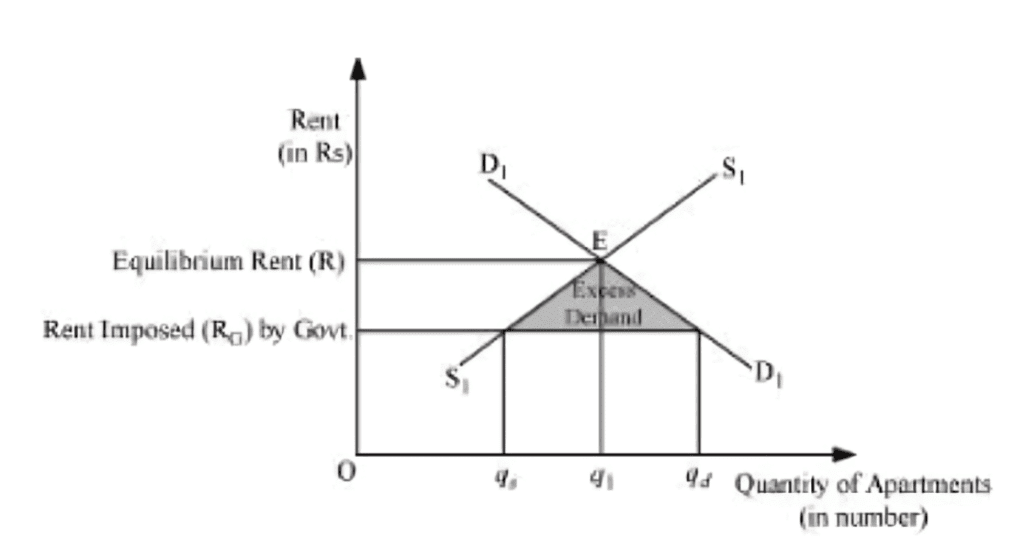
The above figure depicts an equilibrium and an effect of the price ceiling (maximum rent).
The market demand for apartments is depicted by the D1D1 curve and the supply of apartments is depicted by S1S1. The equilibrium price determined is R and the equilibrium quantity is q.
If the government steps in and imposes a rent ceiling (maximum rent) equivalent to RG, then at this rent, there will be an excess demand. The quantity of apartments demanded will be qd. Whereas, the quantity of apartments supplied is qs. So, there exists an excess demand equivalent to qd − qs. At the rate RG, common people can afford apartments to live in, which earlier they were not able to. However, besides this positive effect of imposition of maximum rent, it might happen that some landlords indulge in the practice of black marketing and offer apartments for rent at comparatively higher prices.
|
108 videos|425 docs|128 tests
|
FAQs on NCERT Solutions for Class 11 Economics - Market Equilibrium
| 1. What is market equilibrium in commerce? |  |
| 2. How is market equilibrium determined in commerce? | |
| 3. What happens if there is a shortage in the market equilibrium in commerce? | |
| 4. Can market equilibrium change over time in commerce? | |
| 5. How does market equilibrium impact prices and quantities in commerce? | |


NCERT Solutions for Class 11 Economics - Market Equilibrium
,Exam
,NCERT Solutions for Class 11 Economics - Market Equilibrium
,Sample Paper
,mock tests for examination
,Summary
,past year papers
,Semester Notes
,shortcuts and tricks
,Viva Questions
,Important questions
,practice quizzes
,Previous Year Questions with Solutions
,NCERT Solutions for Class 11 Economics - Market Equilibrium
,study material
,ppt
,MCQs
,video lectures
,Free
,Objective type Questions
,Extra Questions
;


NCERT Solutions - Market Equilibrium Free PDF Download
Importance of NCERT Solutions - Market Equilibrium
NCERT Solutions - Market Equilibrium Notes
NCERT Solutions - Market Equilibrium UPSC Questions
Study NCERT Solutions - Market Equilibrium on the App
|
© EduRev
|
Education Revolution
|


|


within 7 days!