Population Theories, World Population Problems & Policies | Geography Optional for UPSC PDF Download
Population Distribution
Population distribution refers to the way in which people are dispersed or spread out across a specific area. It is the geographic arrangement of individuals within a particular space. This concept helps us understand how populations are distributed in various patterns, such as densely populated cities or sparsely populated rural areas.
Population Density
- Population density refers to the average number of people living within a specific geographical area. Essentially, it is the proportion of the population relative to the size of the area. This concept was first introduced by Henry Drury Harness in 1837 when he prepared a series of maps focusing on the railways of Ireland.
- Population density is a helpful tool for comparing areas in terms of the number of people living in them. It helps us understand if an area is overpopulated or underpopulated by examining the concentration of people per square kilometer or square mile.
- In simpler terms, population density is a measure of how crowded or spacious a specific area is, offering insights into the distribution of people within that region.
Types of Population Density (or Indices of population distribution)
- Arithmetic Density
- Agricultural Density
- Physiological Density
1. Arithmetic Density
- Arithmetic density is the simple ratio between total population & the total area & is expressed in terms of persons per unit of area
- Arithmetic Density = Total Population/Total Area.
Some facts:
- World’s average density = 45-50 persons/ square km
- India’s average density (2011 Census) = 382 persons/square km
- Densest pockets of the world:
(i) Developed urban and industrial centers
(ii) S.E. Asia and S.E. China
(iii) Western Europe
(iv) Singapore (700 persons/square km)
(v) Hong Kong (6500 persons/square km)
(vi) Bahrain and Bangladesh (> 1000 persons/square km)
(vii) Delhi NCR ( 4000-5000 persons/square km)
(viii) Delhi alone ( 11,000 persons/square km)
Agricultural Density
- Agricultural density refers to the proportion of the population involved in agriculture compared to the total amount of cultivated land.
- It is a useful indicator for understanding the relationship between humans and land, particularly in areas where agriculture is the main economic activity.
- Agricultural density is calculated by dividing the total number of people engaged in agriculture (farmers) by the total area of cultivated land.
- This value is typically expressed as the number of agricultural workers per unit of cultivated land.
Physiological Density
- Physiological density refers to the relationship between the total population and the total amount of arable or cultivable agricultural land. It is measured in terms of people per square kilometer of cultivable land and provides a more accurate representation of the pressure placed on land by the human population.
- A higher physiological density indicates that more people are using the available agricultural land, which may lead to the land reaching its maximum output capacity sooner than in a country with a lower physiological density. To calculate physiological density, divide the total population by the total cultivable land. This measurement is particularly useful for assessing the strain on agricultural land resources, especially in agriculture-based economies such as Egypt.
- For example, Egypt has an average arithmetic density of about 70 people per square kilometer, but its physiological density is much higher at around 35,000 people per square kilometer. This is because over 90% of Egypt's population relies on the River Nile for agriculture. In contrast, countries like Bangladesh have a physiological density that closely matches their arithmetic density, as the majority of the country's land is used for agriculture.
In summary, physiological density is a valuable metric for understanding the pressure placed on agricultural land by human populations, particularly in countries with economies heavily reliant on agriculture. A higher physiological density may indicate that the cultivable land is being used by more people and could reach its maximum output limit sooner than in countries with lower physiological densities.
Factors influencing population distribution and density
Physical Factors:- Relief: People typically prefer living on flat plains and gentle slopes, as these areas are conducive to agriculture, road construction, and industrial development. Mountainous and hilly areas, on the other hand, hinder the development of transportation networks and are less favorable for agricultural and industrial activities. As a result, these areas tend to have lower population densities. For example, the Ganga plains have a high population density, while the Himalayan regions have a sparse population.
- Resources: Areas with mineral deposits attract industries, which in turn generate employment opportunities. Skilled and semi-skilled workers migrate to these areas, increasing their population density. Examples of such areas include the Katanga Zambia copper belt in Africa and Western Europe with its coal and fishing reserves. In contrast, regions with fewer resources, like the Sahel region, have lower population densities.
- Climate: Extreme climates, such as very hot or cold deserts, are not suitable for human habitation. Areas with comfortable climates and minimal seasonal variations attract more people. Regions with heavy rainfall or harsh climates have lower population densities. The temperate British climate, for example, is conducive to human habitation.
- Availability of arable land and water: Areas suitable for intensive agriculture have higher population densities, as agriculture supports a large portion of the global population. Examples of such areas include the eastern plains of China. Additionally, human ingenuity has allowed for the development of agriculture on terraces on mountainsides, heated greenhouses in cold climates, and irrigated deserts, further influencing population distribution.
Historical Factors:
- Age of civilization: The longer a place has been continuously used for agriculture, the denser and larger its population tends to be. The eastern China plains and Indo-Gangetic plains have a long history of agricultural use, whereas the plains of Mississippi in the USA, Pampas of Argentina, and veldts of South Africa have more recently been cultivated, resulting in lower population densities.
- Duration of human settlement: The length of time an area has been inhabited also influences population density. Densely populated areas often have a long history of human habitation, such as river valleys. However, there can be exceptions, such as Mesopotamia.
Demographic Factors:
Fertility rate, mortality rate, and migration influence population distribution and density. The difference between fertility and mortality rates determines the natural increase in population. High natural increase leads to rapid population growth and higher population density. In-migration increases population density, while out-migration decreases it. For example, urban centers have higher population densities due to in-migration.
Cultural Factors:
- Industrialization: Industrial centers attract large populations due to employment opportunities, resulting in higher population densities. Regions with significant industrial growth, such as West Bengal, Maharashtra, and Gujarat in India, have higher population densities.
- Development of transport networks: Areas with well-developed transport networks are more accessible and have higher population densities. For example, the northern plains of India have a dense transport network and a high population density, while the Himalayan region has limited transport facilities and a sparse population.
- Urbanization: Urban centers attract migrants due to their employment opportunities, better educational and health facilities, and higher living standards. This leads to higher population densities in urban areas like Mumbai, Delhi, and Kolkata.
- Safety and security: Areas that provide a sense of safety and security tend to have higher population densities. In contrast, war-torn areas and regions with political unrest or militant activities discourage population growth.
- Government policies: Government policies can encourage or discourage population growth and settlement, thereby affecting population distribution and density. For instance, Article 370 in Jammu and Kashmir, India, contributed to the region's low population density until its abrogation in 2019.
- Accessibility: Locations with economic advantages, such as Kolkata, Mumbai, Rotterdam, Chicago, and Rome, create employment opportunities that attract large populations. These centers grow through both natural demographic increase and in-migration.
- National boundaries: Political restrictions can prevent people from overpopulated countries from migrating to developed countries with lower population densities. Examples include the H1B visa system in the United States and the European refugee crisis.
Political factors: Countries with stable political systems tend to have higher populations, such as Singapore, while countries with political instability, like Afghanistan, have lower populations.
Social factors: Better healthcare, education, and sanitation facilities can lead to lower population densities.
Economic factors: Adequate job opportunities attract more people, influencing population distribution. For example, the United States and Anglo America have higher populations due to their economic opportunities.
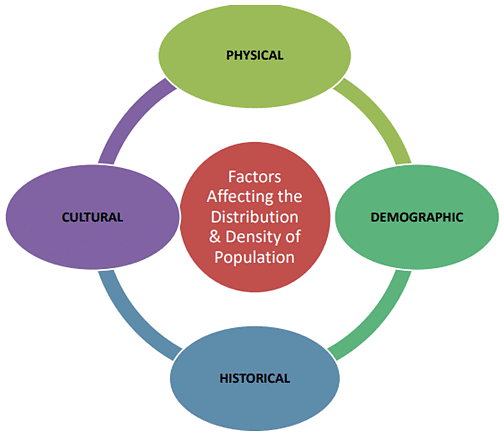
Population distribution and density in India
- The population distribution in India, like any other country, is not uniform. Some regions are densely populated, while others are moderately or sparsely populated. This uneven distribution can be attributed to the varying sizes of states and the differences in their resource bases.
- In India, the population density is represented as the number of persons per square kilometer. According to the 2011 census, the average population density in India is 382 persons per square kilometer. Over the past century, this density has increased more than four times, from 77 in 1901 to 382 in 2011.
- It is important to note that the population density does not imply that every square kilometer of India has exactly 382 people. In reality, the population distribution is highly uneven across the country. For instance, Arunachal Pradesh has a population density of just 17 persons per square kilometer, while Delhi's population density is 11,297 persons per square kilometer, as per the 2011 census.
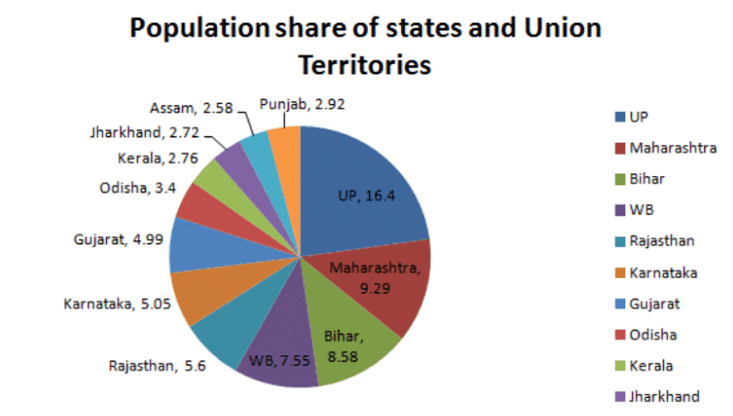
- The top five most populous states in India, which include Uttar Pradesh, Maharashtra, Bihar, West Bengal, Andhra Pradesh, and Telangana, account for half of the country's total population. In contrast, states like Jammu and Kashmir, Arunachal Pradesh, Sikkim, and the northeastern states have significantly smaller populations.
In summary, India's population distribution and density are characterized by significant regional variations due to factors such as state size and resource availability. Understanding these disparities is crucial for effective policymaking and resource allocation in the country.
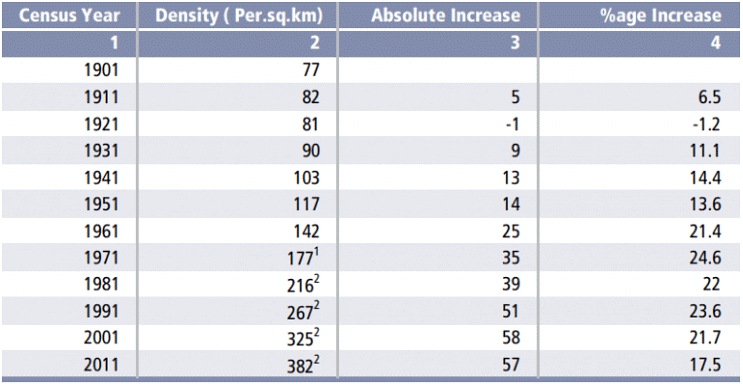
Ranking of States and Union Territories by density: 2001 and 2011
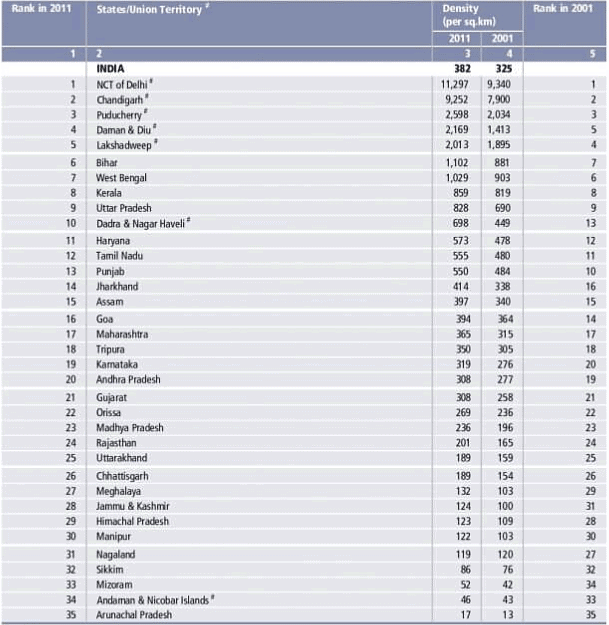
Temporal Analysis
- Density of India decreased during 1911-21. Year 1921 is known as the year of the great divide.
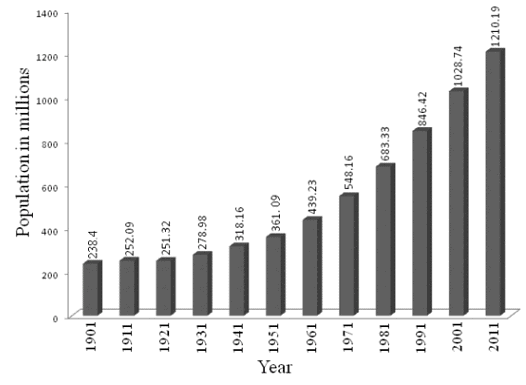
Spatial distribution of population
The spatial distribution of population density can be categorized into five main classes: areas of extremely low density, low density, moderate density, high density, and very high density. Each category is defined by the number of people per square kilometer.
- Areas of Extremely Low Density: These areas have a population density of 100 people per sq km or less. They include Arunachal Pradesh, Mizoram, Andaman and Nicobar Islands, and Sikkim. Factors such as remote locations, harsh climates, and limited economic development contribute to the low population density in these areas.
- Areas of Low Density: These areas have a population density ranging from 101 to 250 people per sq km. States in this category include Nagaland, Manipur, Himachal Pradesh, Jammu and Kashmir, Meghalaya, Chhattisgarh, Uttarakhand, Rajasthan, and Madhya Pradesh. The low population density in these states can be attributed to factors such as hilly terrain, limited resources, and challenging living conditions.
- Areas of Moderate Density: Areas with a population density of 251 to 500 people per sq km fall in this category. States like Odisha, Gujarat, Andhra Pradesh, Telangana, Karnataka, Tripura, Maharashtra, Goa, Assam, and Jharkhand are included in this category. The moderate density in these areas can be attributed to the presence of agricultural and mineral resources, urbanization,
- Areas of High Density: These areas have a population density of 501 to 1000 people per sq km. States in this category include Punjab, Tamil Nadu, Haryana, Dadra & Nagar Haveli, Uttar Pradesh, and Kerala. Highly developed agriculture, industrialization, and fertile lands contribute to the high population density in these areas.
- Areas of Very High Density: Areas with a population density of more than 1000 people per sq km are considered very high-density areas. West Bengal, Bihar, Lakshadweep, Daman & Diu, Pondicherry, Chandigarh, and Delhi fall in this category. Factors such as fertile lands, industrialization, and large-scale migration contribute to the high population density in these areas.
In summary, the spatial distribution of population density in India varies greatly depending on factors such as geography, resources, and economic development. From extremely low-density areas with limited resources to very high-density areas with fertile lands and booming industries, the population density across the country is diverse and complex.

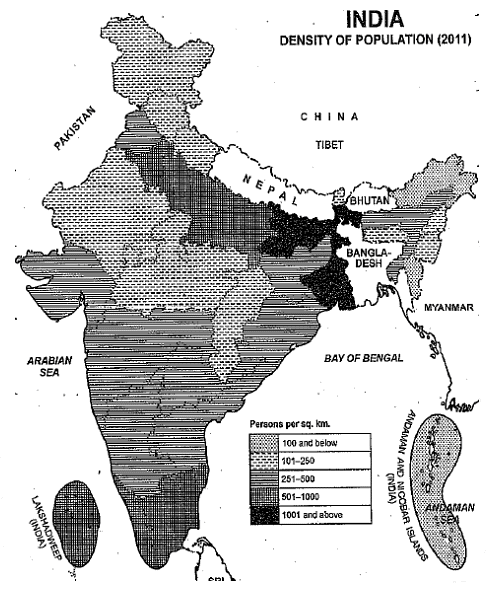
Causes of uneven distribution of population
- Physical
- It is clear that climate along with terrain and availability of water largely determines the pattern of the population distribution.
- Consequently, we observe that the North Indian Plains, deltas and Coastal Plains have higher proportion of population than the interior districts of southern and central Indian States, Himalayas, some of the north eastern and the western states.
- However, development of irrigation (Rajasthan), availability of mineral and energy resources (Jharkhand) and development of transport network (Peninsular States) have resulted in moderate to high concentration of population in areas which were previously very thinly populated.
- Socio-economic and historical factors
- Among the socio-economic and historical factors of distribution of population, important ones are evolution of settled agriculture and agricultural development; pattern of human settlement; development of transport network, industrialization and urbanization.
- It is observed that the regions falling in the river plains and coastal areas of India have remained the regions of larger population concentration.
- Even though the uses of natural resources like land and water in these regions have shown the sign of degradation, the concentration of population remains high because of an early history of human settlement and development of transport network.
- On the other hand, the urban regions of Delhi, Mumbai, Kolkata, Bangalore, Pune, Ahmadabad, Chennai and Jaipur have high concentration of population due to industrial development and urbanization drawing a large numbers of rural-urban migrants.

Factors influencing distribution and density of population

While some scholars attach more importance to natural factors Clarke and Zelenskey are of the view that cultural factors are more prominent in determining the concentration of population in an area.
According to Clarke the economic conditions, technological developments, social organization, government policy play a vital role in the distribution of the population.
Major factors influencing the distribution and density of population are described as under:
- Terrain
- Terrain of land is a potent factor that influences the concentration and growth of the population. Normally speaking, plain areas encourage a higher density of population as compared to mountain regions. The steep slopes in mountain areas restrict the availability of land for agriculture, development of transport, industries, and other economic activities which may tend to discourage the concentration of population and its proper growth.
- It is because of these adverse circumstances that the Himalayan region, though occupies about 13 percent of India’s land area, supports only 1-2 percent of the country’s population, in contrast to this, the Great Plain of North India is a land of extremely gentle slope and offers great opportunities for the growth of agriculture, transport, and industries. This results in a higher concentration of population.
- Although the Great Plain of North India has less than 1/4th of the area but has more than 50% of the population.
- Climate
- Climate is as important as the terrain in influencing a population. Of all the climatic factors, twin elements of rainfall and temperature play the most important role in determining the population of an area.
- Man cannot go beyond the limits set by climate. Extremes of climate discourage the concentration of population. Such climates include the too cold climate of the Himalayas and the too hot and dry climate of the That Desert.
- A moderate climate, on the other hand, is favorable for the population.
- Of the twin factors of rainfall and temperature, rainfall is more effective in determining the distribution of population. It is generally said that the population map of India follows its rainfall map. Rainfall supplies sufficient water for agriculture which is the main occupation of Indian masses. As we .move from the Ganga-Brahmaputra Delta in the east towards the Thar Desert in the west, the amount of rainfall and consequently the density of population decreases.
- However, there are a few exceptions to this general observation. The Assam valley in the northeast and the Circars coast on the Bay of Bengal has a moderate density of population although these areas receive heavy rainfall.
- Similarly, the southern face of the Himalayas is scarcely populated though this area receives sufficiently high rainfall. Some of the adverse factors such as steep slopes, frequent floods, infertile soils, and dense forests counterbalance the positive effect of rainfall. Increased use of irrigation facilities in north-west India comprising
- Punjab, Haryana, and western Uttar Pradesh have resulted in a higher concentration of population than normally expected considering the amount of rainfall received this region.
- Soil
- Soil plays an important factor for the agrarian economy.
- The fertile soil of North India plains, the coastal plains and the black soil region of the Deccan plateau are densely populated.
- Water bodies
- Population is generally concentrated in river valleys.
- Water is needed for agriculture, irrigation, industries, and domestic purpose.
- Mineral resources
- The availability of mineral resources also determine the population density of an area
- For e.g. Chotanagpur region is rich in minerals comprised of high population density.
- Industries
- One hectare of industrial land is capable of supporting several 1000 persons.
- E.g. West Bengal, Bihar, Jharkhand, Orissa, Maharashtra, Gujarat, etc.
- Transport
- Transport and communication also determine the density of the population of an area.
- E.g. Northern plains have a high network of roads and other modes of transportation comprise of higher population density in contrast to the peninsular plateau with a low network of transportation channels and thus having lower population density.
- Urbanization
- Urbanization and population concentration go hand-in-hand and are closely related to each other. All the urban centers are marked by a high density of population.
- The minimum density that an area should have to be designated as urban is 400 persons per sq km.
- The highly urbanized districts of Kolkata, Chennai, Greater Mumbai, Hyderabad, Delhi, and Chandigarh have population densities of over 6,000 persons per sq km.
- Delhi has the highest population density of 11297 persons per sq km as per 2011 census figures.
Social well-being and Quality of life
The concept of quality of life has garnered significant interest in recent years, although the idea dates back to ancient philosophers like Aristotle, who wrote about "the good life" and "living well." The study of well-being and quality of life emerged from welfare geography, a field that focuses on human-centered studies.
- In general, quality of life is defined as an individual's sense of well-being, satisfaction or dissatisfaction with life, and their overall happiness or unhappiness. The World Health Organization (WHO) defines quality of life as "the condition of life resulting from the combination of effects of a complete range of factors, such as those determining health, happiness, education, social and intellectual attainment, freedom of action, justice, and freedom of expression."
- To have a high quality of life, individuals should have their basic and social needs met, the autonomy to choose how they enjoy life, the opportunity to thrive, and the ability to participate as citizens in a society with strong civic integration, social connectivity, trust, and other norms like fairness and equity, all within a sustainable global environment.
Quality of life encompasses both objective and subjective aspects of human living, and it is a multifaceted phenomenon that involves general welfare and health prosperity. The different facets of quality of life include:
- Physical well-being: This involves environmental factors such as climate, topography, population density, and overall physical and mental health.
- Material well-being: This includes household possessions like appliances, vehicles, and communication devices.
- Social well-being: This involves social health, security, amenities, and relationships, as well as social norms and values.
- Economic well-being: This encompasses employment opportunities, income levels, purchasing power, and consumption of goods and services.
- Perception of well-being: This includes attitudes towards external factors, individual and social traits, real-world experiences, and subjective elements.
- Spiritual well-being: This involves religious beliefs, practices, and approaches to seeking truth and happiness.
It is important to distinguish quality of life from the concept of standard of living, which primarily focuses on income. Standard indicators of quality of life include not only wealth and employment but also factors such as the built environment, physical and mental health, education, recreation and leisure time, and social belonging.
Social well-being
- The study of social well-being in geography is the inevitable result of the relevance movement which started in the 1970s. It aimed at addressing those human problems which were afflicting society at large. It was launched to groom geography as a socially relevant discipline. Hence, geography began to address the welfare issues which provided a new framework for micro-level inquiries. Microlevel spatial analysis has enhanced the role of geography in developmental planning. Through the social relevance movement, the emphasis of inquiry in geography shifted from the study of marginal land to the marginal social space.
- An important dimension of quality of life is ,of course, social well-being which connotes “a condition in which basic human needs are met, anti people are able to coexist peacefully in communities with opportunities for advancement”.
- Social well-being means a healthy relationship environment with society, social stability, and Peace. Social well-being is required to overcome loneliness in life. Good communication networks and healthy relationships amongst people are essential for social well-being.
- A “well society”, for example, is one in which all people have sufficient income to meet their basic needs, where all are treated with equal dignity and have equal rights, where they have reasonable access to their needed range of services, and where their opinions are heard and respected. The quality of a society can be measured by its success on variables reflecting such desiderata, as can variations within society.
- The following are the components of measurement of social well being:
- Health
- Education
- Food and nutrition
- Equality
- Freedom
- Pollutions
- Law and order
- Social structure
- Sex ratio
- Social well-being is subjective in nature. Preference and components of the social well-being of the person living in the village, town, city, hilly areas, plain areas, or different climatic regions will be different for different people. Even, the meaning of social well-being will differ living in the same geographical areas with different age or ethnicity groups.
- The social well-being of any society over the world has cultural and technological overtones. The developed countries with their advanced technology are ahead in the level of well-being due to the early and rapid urbanization and industrialization and concomitant change in social needs and values.
- But the process of industrialization and urbanization is slow and selective in a majority of other third world countries resulting in a limited change in social needs. The social values change in accordance to the social needs which are governed by the micro geographical conditions level of technology, and cross-cultural assimilation.
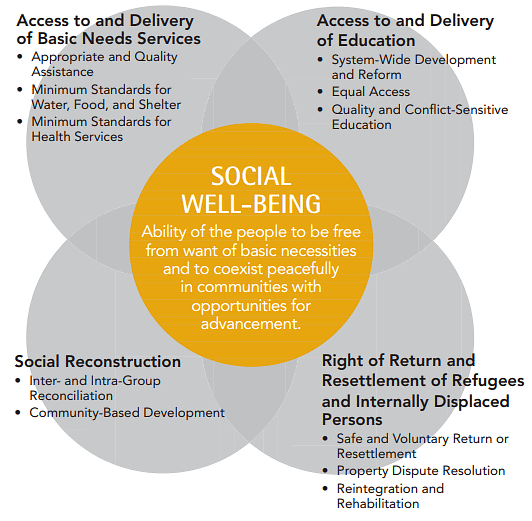
Cross-National indices of measuring Quality of life/Social well-being
- Given below are some of the indexes which are helpful for measuring the quality of life:
- Human development index(HDI) (talk a little about the variables that go into its calculation)
- Quality of life index: This index reflects three universal requirements of human existence – meeting biological needs, coordinating social interaction, and survival and welfare needs of groups. India ranked 73 in the 2005 and, 63 in 2021 Quality of life index report.
- Index of social progress: This index identifies significant changes in “adequacy of social provision” and to assesses the progress in providing more adequately for the basic social and material needs of the world’s population.
- World Happiness Index: The World Happiness Report is a landmark survey on the state of global happiness. It ranks over 150 countries by their happiness levels, reflecting growing global interest in using happiness and substantial well-being as an indicator of the quality of human development. India ranked 139 out of 149 countries in UN’s World Happiness Report 2021.
- Demographic, personal, and socio-economic factors also affect the quality of life of a region.
- Economic Intelligence Unit’s quality of life attempts to measure which country will provide the best opportunity for a healthy, safe, and prosperous life to its people in years ahead. It includes:
- Subjective life satisfaction survey
- Objective determinants of quality of life such as:
(i) GDP per capita
(ii) Job security
(iii) Governance
(iv) Gender equality
Quality of life: A systems model
- The approach to the measurement of the quality of life derives from the position that there are a number of domains of living.
- Each domain contributes to one’s overall assessment of the quality of life. The domains include family and friends, work, neighborhood (shelter), community, health, education, and spirituality.
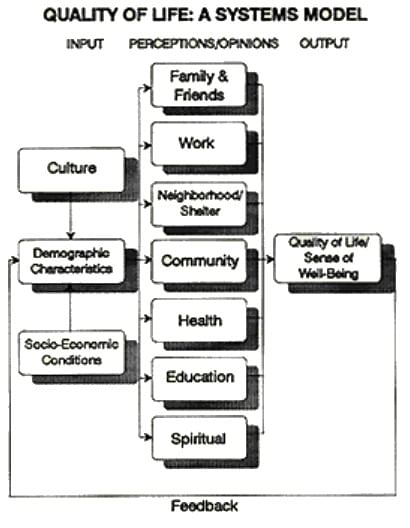
- Recent trends with respect to demographic, economic, social indicators provide ground for optimism about human well being due to unprecedented growth in both developed and developing countries, but with problems at local or regional level especially in developing regions, the challenge for making the quality of life better for the people in these regions is complex.
- Problems faced by least developed countries across various facets of well-being are due to the pressure of the population.
- The interaction between population growth & human well-being is complex. An increase in population leads to problems related to environmental degradation in developing countries and if it is unchecked, it will lead to severe consequences.
World population policies
As we know, China and India are the two most populous countries in the world. So in this article, we will be discussing the following population policy:

India's population policy
During the time, the following population control policies were adopted by India.
- National Family Planning-1951
- New population policy of 1976
- Population policy of 1997
- Population policy of 2000
- Recent population policy of 2017
National family planning of 1952:
The main aim was to make the optimum population of the country that utilizes all the natural resources.
Under this policy:
- Free medical facilities were being provided to family planning people
- Awareness was telecasted regarding the benefits of family planning
- In the 1961 census, India's population growth was 21.5 % growth in the last 10 years. In the 1972 census, population growth further increased to 24.6 %. It was the failure of 1952 national family planning which generally not able to slow the population growth rate.
New population policy of 1976:
- In the 1976 population policy, the minimum age for marriage was raised to 21 years for males and 18 years for females. This policy also encouraged voluntary family planning and provided tax incentives for individuals who chose to participate in family planning programs.
- Following 1981, India entered the third stage of demographic transition, characterized by a declining birth rate. In subsequent five-year plans after 1985, greater emphasis was placed on women's education and employment opportunities.
- It was believed that controlling population growth could be achieved through economic development and improving healthcare services for pregnant women and children.
Population policy of 1997 on Reproductive and child health approaches:
- Focus on Institualised delivery.
- More focus on decentralized and regional-based planning on health care was given.
Population policy of 2000 :
- Focus on Participation of NGO
- ASHA worker and baby care units
- The aim was to make a fertility rate of 2.1( i.e replacement rate) and stabilized the population by 2045.
Recent population policy of 2017:
- Special focus on high population growth states such as Madhya Pradesh, Uttar Pradesh, Jharkhand, Chhattisgarh, Bihar, and Orissa.
- Maternity benefits program for the first two children.
- Home delivery services through ASHA worker.
China one-child policy
The following are the main characteristics of China's one-child policy.
- In 1980, China one-child policy was implemented
Under this marriage ages were delayed:
- for boy 26 age
- for the girl; 24 age
- There was an economic penalty for more than one child.
- The second child will be permitted if the first child is physical or mentally handicapped.
The following amendments were made:
- In 2000, the second child is permitted for minority people.
- In 2015 second child is permitted to all people.
Problems in China one-child policy:
- The preferences for male children increased
- Decreased in sex ratio, China sex ratio is far below the global average & India's sex ratio.
- With the high dependency ratio, eight peoples are dependent on a married person with a minor child. Dependents are:
- Parents(2)
- Grand Parents(2)
- Maternal Parents (2)
- Wife & a minor child(2)
Population Policy in developed countries
- In developed countries, the population is either declining or experiencing stagnant growth. As a result, these countries are implementing policies that offer economic incentives to encourage population growth.
- Germany and Japan are examples of nations with aging populations, demonstrating the need for such population policies.
Conclusion
In conclusion, population distribution and density are influenced by a variety of factors, including physical, historical, demographic, cultural, economic, and political aspects. Understanding these factors is crucial for effective policymaking and resource allocation, as well as for maintaining a high quality of life and social well-being for individuals within a society. As the world experiences changes in population dynamics, including aging populations in developed countries and rapid urbanization in developing nations, it is essential for governments and policymakers to consider the diverse factors that impact population distribution and density in order to ensure sustainable and equitable growth.Frequently Asked Questions (FAQs) of Population Theories, World Population Problems & Policies
What is population distribution?
Population distribution refers to the way in which people are dispersed or spread out across a specific area. It is the geographic arrangement of individuals within a particular space, and helps us understand how populations are distributed in various patterns, such as densely populated cities or sparsely populated rural areas.
What is the difference between population distribution and population density?
Population distribution refers to the pattern of how people are spread out across a specific area, while population density is the average number of people living within a specific geographical area. Population density is a measure of how crowded or spacious a specific area is, offering insights into the distribution of people within that region.
What are some factors that influence population distribution and density?
Some factors that influence population distribution and density include physical factors (such as relief, resources, and climate), historical factors (such as age of civilization and duration of human settlement), demographic factors (such as fertility rate, mortality rate, and migration), cultural factors (such as industrialization, development of transport networks, and urbanization), and political factors (such as government policies and national boundaries).
How does climate affect population distribution and density?
Climate plays a significant role in determining population distribution and density. Extreme climates, such as very hot or cold deserts, are not suitable for human habitation and tend to have lower population densities. In contrast, areas with comfortable climates and minimal seasonal variations attract more people, resulting in higher population densities.
What are some examples of cross-national indices for measuring quality of life or social well-being?
Some cross-national indices for measuring quality of life or social well-being include the Human Development Index (HDI), the Quality of Life Index, the Index of Social Progress, and the World Happiness Index. These indices consider factors such as income, education, health, governance, gender equality, and subjective life satisfaction to provide a comprehensive assessment of the quality of life in different countries.
|
303 videos|635 docs|252 tests
|
FAQs on Population Theories, World Population Problems & Policies - Geography Optional for UPSC
| 1. What are the main population theories? |  |
| 2. What are the world population problems? |  |
| 3. What are the policies to address world population problems? |  |
| 4. How does population distribution affect society and the economy? |  |
| 5. How does population growth impact the environment? |  |


