Summary of Indices & Reports - 5 (2025) | Economic Survey & Government Reports - UPSC PDF Download

Global Hunger Index 2024
 Hunger Crisis 2024
Context
Recently, the Global Hunger Index 2024 has been published by Concern Worldwide and Welthungerhilfe. It shows that India is facing a ‘serious’ level of hunger, ranking 105th out of 127 countries.
What is the Global Hunger Index?
Defining Hunger:
- Hunger, as defined by the Food and Agriculture Organization (FAO) of the United Nations, refers to a condition where a person does not have enough food, consistently consuming fewer calories than necessary to meet their basic energy requirements. These requirements vary based on factors like gender, age, height, and physical activity level, all of which influence the amount of energy needed for a healthy and active life.
The Global Hunger Index (GHI) is an annual publication by Concern Worldwide and Welthungerhilfe. It assesses and monitors hunger at global, regional, and national levels, aiming to raise awareness about the fight against hunger and to spotlight regions where hunger is most acute, thereby stimulating efforts to address it.
Indicators of Hunger:
- The GHI is computed using a comprehensive formula that captures various dimensions of hunger, based on four key indicators:
- Undernourishment: The proportion of the population with inadequate caloric intake.
- Child Stunting: The percentage of children under five who are shorter than the average for their age, reflecting chronic undernutrition.
- Child Wasting: The percentage of children under five who are lighter than average for their height, indicating acute undernutrition.
- Child Mortality: The percentage of children who die before the age of five, which partly indicates the impact of poor nutrition and unhealthy living conditions.
What are Global Hunger Trends Highlighted in the Report?
Global GHI Score (2024):
- The global GHI score for 2024 is 18.3, categorized as moderate hunger. This reflects a slight improvement from the 2016 score of 18.8, indicating slow progress in alleviating hunger.
Child Malnutrition:
- Stunting: 148 million children under five are affected by stunting.
- Wasting: 45 million children under five suffer from wasting.
- Child Mortality: Nearly 5 million children die before reaching five years of age due to hunger-related causes.
- Undernourishment: 733 million people worldwide are undernourished. Additionally, 2.8 billion people are unable to afford a healthy diet due to rising food prices and the ongoing cost-of-living crisis.
Food Insecurity and Crises:
- Acute Food Insecurity: In 2023, 281.6 million people across 59 countries faced acute food insecurity. Projections for 2024 suggest that 120 to 130 million people will require humanitarian food assistance by the end of the year.
- Most Affected Regions: Africa (particularly Sub-Saharan Africa) and South Asia are the regions with the highest levels of hunger.
- Six countries—Burundi, Chad, Madagascar, Somalia, South Sudan, and Yemen—are experiencing alarming levels of hunger.
- Somalia is enduring a prolonged hunger crisis exacerbated by conflict, economic challenges, and climate shocks, with 51.3% of its population lacking sufficient calories, the second-highest rate globally.
Projections for Global Hunger:
- At the current rate, global hunger is unlikely to be eradicated by 2030. If progress continues as it has, achieving low hunger levels globally may not occur until 2160, over 130 years from now.
- Hunger Levels in Countries: Hunger is classified as alarming in six countries: Burundi, Chad, Madagascar, Somalia, South Sudan, and Yemen. Additionally, 36 countries are experiencing serious levels of hunger.
- Stagnation in Key Areas: Progress in reducing the four GHI indicators—undernourishment, child stunting, child wasting, and child mortality—is lagging behind internationally agreed targets.
- Countries in Decline: Since 2016, hunger has worsened in 22 countries with moderate, serious, or alarming GHI scores. Progress has largely stalled in 20 countries, with scores declining by less than 5%.
- Success Stories: Some countries, including Bangladesh, Mozambique, Nepal, Somalia, and Togo, have made significant improvements in their GHI scores, although hunger levels remain high in these regions.
Compounding Challenges:
The 2024 GHI findings highlight a range of overlapping challenges that exacerbate hunger, particularly in the world’s poorest nations:
- Armed Conflicts: Ongoing conflicts displace populations and disrupt food production and distribution, with recent conflicts in Gaza and Sudan intensifying food crises.
- Climate Change: Climate change is severely impacting agriculture by diminishing yields and increasing food insecurity. Since 1961, climate change has reduced agricultural productivity growth in Sub-Saharan Africa by 34%.
Overview of Global Hunger and Nutrition (2024)
 Hunger Crisis
The Global Hunger Index (GHI) report for 2024 highlights a serious and worsening hunger crisis worldwide, with a GHI score of 29.4, indicating a very alarming level of hunger. The report indicates that one in ten people globally are undernourished, with nearly 800 million people facing hunger. Additionally, around 3.1 billion people cannot afford a healthy diet. The report presents a comprehensive picture of hunger and undernutrition across different regions and countries, emphasizing the need for urgent action to address these issues.
Key Findings from the Global Report
Hunger Crisis: The report categorizes the world’s hunger situation as serious and worsening, with the GHI score reflecting a significant increase in hunger levels. Undernourishment and Food Insecurity:. substantial portion of the global population is facing severe food insecurity, with millions unable to access even the minimum required calories. Child Malnutrition: The report highlights alarming rates of child malnutrition, with millions of children under five facing acute and chronic malnutrition. Regional Disparities: South Asia, East Africa, and West Africa are identified as regions with the highest levels of hunger and malnutrition, with specific countries facing extreme levels of food insecurity. Socioeconomic Factors: The report emphasizes the impact of rising food prices, economic downturns, and debt crises in low-income countries as significant barriers to food access and security. Displacement and Inequality: Over 115 million people are displaced due to conflict, persecution, and climate-related disasters, exacerbating the hunger crisis. Government Initiatives: Some countries, like India, are making efforts to improve food and nutrition security through various government programs and initiatives.
India-Specific Findings
GHI Score and Severity
- India’s GHI score for 2024 is 27.3, placing it in the serious category for hunger levels.
- Despite some improvements, hunger remains a significant issue in the country.
Child Wasting
- India has one of the highest rates of child wasting globally, indicating acute malnutrition among children.
- The current rate of child wasting is 18.7% for children under five years old.
Child Stunting
- Stunting is a major challenge in India, reflecting widespread chronic malnutrition.
- Approximately 35.5% of children under five are classified as stunted, indicating long-term nutritional deficiencies.
Undernourishment
- About 13.7% of the Indian population is undernourished, highlighting serious issues with food access and nutritional quality.
Child Mortality
- The child mortality rate in India is 29 out of every 1,000 children, indicating poor nutrition and inadequate living conditions.
Food Security Challenges
- India faces a serious hunger problem due to various factors, including:
- Poor diet quality
- Income inequality
- Rapid urbanization
- Climate change
- Inadequate access to nutritious foods
- The nutritional status of mothers plays a crucial role in child malnutrition, suggesting an ongoing cycle of undernutrition affecting future generations.
Regional Comparisons
- South Asia, with India as a major contributor, has the highest rates of child wasting in the world.
- The region is home to 281 million undernourished people, accounting for nearly 40% of the global total.
Government Initiatives
- India is making significant efforts to improve food and nutrition security through various government initiatives, including:
- National Food Security Act (2013)
- Poshan Abhiyan (National Nutrition Mission)
- PM Garib Kalyan Yojana (PMGKAY)
- National Mission for Natural Farming
Objections to Data Collection Methodology
The Ministry of Women and Child Development in India has raised concerns about the data collection methodology used in the Global Hunger Index, specifically regarding the reported rates of child wasting.
- The Ministry argues that the data should be sourced from their own ICT application, the ‘Poshan Tracker’, which reflects a lower child wasting rate of 7.2%.
- The Poshan Tracker is recognized by organizations like UNICEF, WHO, and the World Bank as a reliable tool for monitoring child nutrition.
Researchers' Position
In response to the objections raised by the Indian government, researchers maintain that their data collection methodology is based on validated survey estimates used for the Joint Malnutrition Estimates and the WHO Global Database on Child Growth and Malnutrition.
- They argue that using consistent data sources ensures the reliability and comparability of the results.
- Researchers caution that making exceptions for specific countries could compromise the integrity of the rankings and the validity of the findings.
Recommendations for Addressing Hunger and Malnutrition
The GHI report for 2024 recommends a comprehensive approach to tackle hunger and malnutrition, emphasizing the need for:
- Improved access to social safety nets and addressing various factors influencing well-being and nutrition.
- Governments should uphold the right to adequate food, formalize it in laws, and establish transparent monitoring systems.
- Early hunger warning systems should be linked to prompt actions and funding for relief efforts.
- Food systems and climate policies need to consider gender-specific needs and vulnerabilities, promoting women’s leadership in resource management.
- Public resources should focus on reducing structural inequalities, with investments in nutrition, rural development, and climate adaptation that benefits gender equality.
- Long-term resilience strategies, including debt relief for low-income countries and sustainable development, should be prioritized.
Pathways & Strategy for Accelerating Growth in Edible Oil Towards the Goal of Atmanirbharta
 Edible Oil Self-Sufficiency
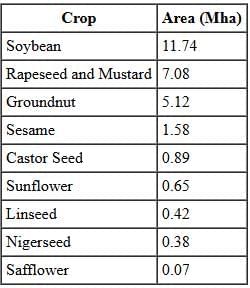
Why in News?
Recently, a report titled “Pathways and Strategies for Accelerating Growth in Edible Oils towards the Goal of Atmanirbharta” was released by NITI Aayog. Atmanirbharta refers to self-reliance, emphasising the importance of achieving self-sufficiency in various sectors.
The report analyses the current edible oil sector and outlines its future potential, providing a detailed roadmap to address challenges, aiming to close the demand-supply gap and achieve self-sufficiency.
Global Perspective:
- The global economy for edible vegetable oils has been steadily expanding, with a projected 2% increase in production for 2024-25, reaching 228 MT.
- Since 1961, global oilseed production has risen nearly tenfold, with production outpacing the growth in cultivated area.
- The 1.5% increase in the world population has driven up global oilseed consumption, reflecting higher demand for edible oils.
- Over the past thirty years, the growth rate of vegetable oils has outstripped that of oilseeds, driven by the inclusion of palm oil, olive oil, coconut oil, and cottonseed oil.
- Between 2017-18 and 2022-23, soybeans were the dominant oilseed globally, accounting for 60% of total production.
- Currently, palm oil leads global vegetable oil consumption, followed by soybean oil, rapeseed oil (canola oil), and sunflower oil.
India’s Position:
- India is the 5th largest economy in the world and plays a crucial role in the global edible vegetable oil sector, ranking fourth after the USA, China, and Brazil.
- The country accounts for approximately 15-20% of the global oilseed area, 6-7% of vegetable oil production, and 9-10% of total consumption.
- India is the leading producer of rice bran oil, with a global market share of 46.8%, and dominates castor seed production, holding 88.48% of the global share.
- The country ranks second in cottonseed oil production (28.41% share) and in groundnut seeds and oil, behind China and the USA.
- In coconut production, India is third globally, contributing 22.46% to the market, trailing Indonesia and the Philippines.
- India is the third-largest producer of rapeseed, accounting for 13.72% of global production.
- The country is also the fifth-largest producer of soybean and soybean oil, with global shares of 3.72% and 2.14%, respectively.
- Additionally, India ranks fifth in linseed production (3.18% share) and sixth in linseed oil production (5.03% share).
Overview of India’s Edible Oil Sector:
- Oilseeds occupy the second-largest area in Indian agriculture, following food grains.
- India’s varied agro-ecological conditions support the cultivation of nine annual oilseed crops: groundnut, rapeseed-mustard, soybean, sunflower, sesame, safflower, nigerseed, castor, and linseed.
- These nine major oilseeds constitute 14.3% of the gross cropped area, contributing about 12-13% to dietary energy and approximately 8% of agricultural exports.
- Soybean is the leading oilseed, accounting for 34% of production, followed by rapeseed & mustard (31%. and groundnut (27% ).
- Major contributions to edible oil production come from rapeseed mustard oil (45% ), groundnut oil (25% ), and soybean oil (25% ).
- Minor edible oilseeds (sesame, sunflower, safflower, and nigerseed) contribute about 5% of total domestic oil production.
- Rajasthan and Madhya Pradesh are the top producers of oilseeds, each contributing about 21.42% of national production.
- These four states collectively account for 75.63% of total production in the country.
- In secondary oil crops, significant palm oil production is seen in Andhra Pradesh (87.3% ), Telangana (9.8% ), Kerala, and Karnataka.
- Gujarat leads in cotton production with a 24.4% share, followed by Maharashtra, Telangana, Rajasthan, and Karnataka.
- Coconut production is primarily in Kerala (84% of total production), followed by Tamil Nadu and Karnataka.
Introduction
 Edible Oil Production
India is a significant consumer of edible oils, with a per capita consumption of 24 kg per year, which is much lower than the global average of 36 kg. The country faces a challenge of rising demand due to increasing population and income levels, leading to a widening gap between demand and domestic production.
The government has initiated various measures to promote self-sufficiency in edible oil production, including increasing the minimum support price (MSP) for oilseeds, promoting the cultivation of high-yielding varieties, and encouraging the use of non-traditional oilseeds. Despite these efforts, the gap between demand and supply is expected to persist, necessitating continued imports to meet the rising demand.
Tree-borne Oilseeds (TBOS)
Tree-borne oilseeds (TBOs) such as wild apricot, chura, kokum, olive, simarouba, mahua, sal seed, mango kernel, dhupa, and tamarind seed provide oils that have many different uses.
Growth Trends and Instability in Edible Oil Crops
Growth Trends
- The area, production, and yield of oilseeds have shown growth rates of 0.90%, 2.84%, and 1.91% respectively from 1980-81 to 2022-23.
- In the last decade, production increased at a rate of 2.12%, while yield grew by 1.53%.
- The overall area for oilseeds has had a positive growth trend in all decades, except for 1991-2000.
- Total palm oil production in India rose from 0.079 MT in 2010-11 to 0.36 MT in 2021-22.
Instability in Edible Oil Crops
- The analysis of instability indicates that considering a longer period shows that increased instability from new technology is not clear.
- In the last decade, only sunflower and safflower had variable areas, pointing to difficulties in maintaining steady cultivation.
Edible Oil Trade Dynamics
- Edible vegetable oils are notable among agricultural products due to their very high trade volume.
- A remarkable 41% of global production is traded internationally, mainly influenced by major palm oil producers like Indonesia and Malaysia.
- These countries export over 70% of their production, together making up nearly 60% of global palm oil exports.
- India ' s dependence on edible oil imports decreased from 63.2% in 2015-16 to 54.9% in 2021-22, leading to increased self-sufficiency from 36.8% to 45.1%.
- However, this improvement is overshadowed by a significant rise in overall consumption.
- Imports are dominated by palm oil, accounting for 59%, followed by soybean at 23% and sunflower at 16%.
- The main exported oilseeds are groundnut, sesame, soybean, and rapeseed, with groundnut being the largest exported crop for the last three years.
- In terms of edible vegetable oil exports, castor oil leads, followed by groundnut oil and other oils.
- Soybean and rice bran are the main exported oil meals.
Initiatives Taken
- Open General Licenses (OGLs) are essential for enabling necessary imports to close the demand-supply gap for edible oils in India.
- Import duty structures are carefully reviewed to satisfy different stakeholders.
- The government has extended the free import policy for refined palm oils until further notice.
- To promote domestic production, the government announces MSPs annually for 22 mandated crops, including seven key oilseeds: groundnut, sunflower, soybean, sesame, nigerseed, rapeseed and mustard, and safflower.
Demand-Supply Gap
- The ongoing trend of urbanisation in developing countries, including India, is likely to change dietary habits and traditional meals.
- This change will probably favour processed foods, which are usually high in edible oil content.
- The OECD-FAO Agricultural Outlook (2023-2032) indicates that India, the largest vegetable oil importer, is expected to keep increasing imports to meet rising domestic demand.
- The report also noted that vegetable oil consumption for food is projected to represent 57% of the total globally, driven by population growth and increased per capita consumption, especially in lower and middle-income countries.
- The ICAR-Indian Institute of Oilseeds Research survey highlighted distinct regional preferences in edible oil consumption across India, reflecting local culinary practices and available oilseeds.
Strategies for Accelerating Growth in the Edible Oil Sector
The Importance of Atmanirbharta in the Edible Oil Sector
- Atmanirbharta, meaning self-reliance, is a guiding principle for Indian government policies aimed at reducing import dependence and enabling the nation to fulfil its domestic needs.
- This goal of self-sufficiency offers pathways and strategies for boosting growth in the edible oil sector, highlighting Atmanirbharta ' s significant value for economic progress, food security, and preserving cultural heritage.
- Achieving Atmanirbharta in edible oil, a vital part of agriculture, promises multiple benefits.
- It strengthens national infrastructure, promotes domestic production and innovation, and increases production capacity for future demands, leading to improved living standards.
- Pursuing Atmanirbharta in edible oil is not just an economic aim but a strategic necessity for a self-sufficient and prosperous India.
Achieving Self-Reliance in the Edible Oil Sector
 Self-Reliant Edible Oils
Achieving self-reliance ( Atmanirbharta. in the edible oil sector is very important for India, covering several key points:
- Minimising Import Dependency: Self-reliance reduces risks from outside influences and unnecessary economic and political reliance on other countries.
- Achieving Nutritional Security: It's essential to ensure safe and nutritious edible oils are consistently available to support the nutrition of the Indian population.
- Enhancing Economic Development: Addressing current challenges and finding effective strategies for growth is vital for the benefits of Atmanirbharta in the edible oil sector.
To achieve self-reliance in the edible oil sector, a comprehensive strategy built around three main pillars is necessary, as highlighted in the report.
Crop Retention and Diversification
- Retaining and diversifying oilseed crops could increase production by 20%, adding 7.36 MT. This would also reduce imports by 2.1 MT.
- This strategy uses the Markov Chain Analysis Approach, a statistical method predicting future states based on current trends.
Horizontal Expansion
- The Horizontal Expansion Strategy aims to increase the area used for growing edible oil crops.
- Potential methods include using rice fallow lands and suitable wastelands for oil palm cultivation and promoting crop retention and diversification in regions focusing on other crops.
Vertical Expansion
- The Vertical Expansion Strategy aims to improve yields in existing oilseed cultivation areas.
- This can be done through better farming practices, improved seeds, and advanced production technologies.
The state-wise quadrant approach is a useful tool for achieving Atmanirbharta in edible oils by grouping states using four quadrants for the oil crops grown in India.
- High Area-High Yield (HA-HY). Focus on efficiency and global best practices.
- High Area-Low Yield (HA-LY). Implement vertical expansion to increase yields.
- Low Area-High Yield (LA-HY). Prioritise horizontal expansion to enhance cultivation.
- Low Area-Low Yield (LA-LY). Address both horizontal and vertical expansion to improve area and yield.
Boosting Oilseed Production
- Focus on keeping oilseed crops and shifting some land from cereal crops in nine states. This could raise oilseed production by 20%, adding 7.36 million tonnes (MT) and cutting import reliance by 14.2%. 2.1 MT ).
- Utilise rice fallow areas in ten states to grow oilseeds, potentially adding 3.12 MT to production and lowering import dependence by 7.1%. 1.03 MT ).
- Improve yields using better technology and management practices. This could increase domestic oilseed production by 46%. 17.4 MT. and reduce imports by 25.7%.
- Optimise seed quality and processing methods. High-quality seeds can increase production by 15-20%, and better management can raise this to 45%. Modernising mills will reduce waste and enhance efficiency.
- Expand oil palm cultivation by using 2.43 million hectares (Mha) of suitable land, targeting 0.34 Mha annually over the next 18 years.
- Build inclusive partnerships with farmer organisations and local groups to manage wastelands effectively and increase cultivation.
- Focus on growing sunflower and palm oil to boost domestic production and lessen import reliance, aiming to strengthen India's position in the global edible oil market.
What are the Challenges in the Edible Oil Sector in India?
- Low Yields Compared to Global Producers: Despite being one of the largest producers, India's yields for most edible oil crops (except castor) are lower than in other countries, mainly due to limited use of genetically modified (GM) herbicide-tolerant varieties.
- Rainfed Dependency. About 76% of India's oilseed cultivation relies on rainfed systems, which are vulnerable to unpredictable weather. Irrigation coverage has only increased by 4% over the last decade.
- Heavy Import Reliance. India produces only 40-45% of its edible oil needs domestically, relying on imports for 55-60%, making it the world’s largest vegetable oil importer.
- Solvent Extraction Industry. This industry operates at only 30% capacity due to uneven plant distribution and outdated technologies.
- Soybean, Cotton, and Coconut Challenges. Soybean yields remain low despite increased cultivation, while yields of cotton and coconut have slightly decreased in recent years.
Pests and Diseases
 Oilseed Development
Managing pests and diseases is crucial because there are not many crop varieties that resist them, making oilseeds vulnerable to serious threats.
Rising Demand Due to Socio-Economic Factors
The increasing population and improving living standards are driving up the demand for edible oils, putting extra pressure on India to meet this demand locally.
Inconsistent Cultivation of Sunflower and Safflower
The area dedicated to growing sunflower and safflower has fluctuated over the past decade, making it difficult to maintain stable production levels for these crops.
Way Forward
The Adoption of Improved and Advanced Production Technologies
- Crop improvement strategies should focus on maximising genetic potential by combining traditional breeding methods with modern biotechnological tools.
Cluster-based Seed Hubs
- Establishing cluster-based seed hubs at block levels, known as ‘One Block-One Seed Village,’ aims to provide high-quality seeds for oilseeds.
- This initiative will enhance the seed replacement rate (SRR) and the varietal replacement rate (VRR).
Data-Driven Transformation and Research Investment
- Investing in research and development is critical for transforming the edible oil sector.
- Providing evidence that R&D yields higher returns than input subsidies would strengthen this claim.
A Dynamic Trade Policy for Balanced Growth
- Aligning support prices with the import duty structure will benefit farmers, processors, and consumers.
Enhancing Oilseed Development in Bundelkhand and the Indo-Gangetic Plain
- Revitalising the Bundelkhand region, which has great potential for oilseed cultivation, is essential.
Prioritising Wasteland Utilisation for Oil Palm Horizontal Expansion
- A strategic focus on expanding oil palm cultivation in suitable under-utilised wastelands is recommended.
Optimising Storage Strategies and Price Incentives
- Implementing fair pricing structures ensures adequate margins for storage costs and stakeholder returns.
- This promotes market stability while encouraging off-season sales.
Enhancing Marketing Infrastructure
- To increase the income of oilseed farmers, ensuring procurement at the Minimum Support Price (MSP) through NAFED and state-owned oilseeds federations is vital.
Overview of Mangrove Ecosystems Report 2024
 Mangrove Ecosystem Report
A report titled "The State of the World’s Mangrove Ecosystems 2024. was recently released by the Global Mangrove Alliance (GMA) on World Mangrove Day, 26 July. The GMA is a leading alliance of over 100 members dedicated to the conservation and restoration of the world’s mangrove ecosystems.
The World of Mangroves
- Importance of Data: Accurate data on the location and size of mangroves is crucial for their protection and conservation.
- Historical Mapping: The first global maps of mangrove forests were created in 1997, with updates in 2010 and 2011. However, these maps were not revised after their initial release.
- Global Mangrove Watch: Since 2018, the Global Mangrove Watch (GMW) has been providing a series of global mangrove extent maps from 1996 to 2020. The GMW dataset is now in its fourth version, with GMW v4.0 released in 2024.
- GMW v4.0 Findings: The GMW v4.0 map shows 147,256 km² of mangroves worldwide, similar to GMW v3.0 but with more detailed changes. The accuracy of this map is about 95.3%, a significant improvement due to better habitat masking, improved satellite imagery, and advancements in machine learning.
- Future Improvements: Future work will involve re-mapping the historical time series for better assessment of changes over time.
- Geographic Distribution: The GMW v4.0 map identifies mangroves in 128 countries and territories, six more than in the previous version. Southeast Asia has nearly 50,000 km² of mangrove cover, accounting for about one-third of global mangroves, with Indonesia alone containing 21% of the world’s mangroves.
- Northern and Southern Extremes: St. George’s Island in Bermuda has the northernmost naturally occurring mangroves at latitude 32.36°, while the southernmost mangroves extend to latitude 38.90° in Victoria, Australia.
The Diversity of Mangroves
- Habitat: Mangrove plants thrive in tropical and subtropical coastal regions and possess unique features that enable them to adapt to their environment.
- Species List: The current global list of mangrove species is considered subjective and incomplete, highlighting the need for a more accurate and updated list.
- Classification Criteria: There are no clear criteria for defining what constitutes a mangrove plant, leading to ongoing debates about their classification.
- Coexistence with Tidal Marsh Plants: Plants from tidal marshes often grow alongside mangroves, making it difficult to differentiate between the two.
- New Species Discoveries: The identification of new mangrove species reflects our limited understanding of mangrove biodiversity and the complexities involved in their classification.
- Hybrid Classification Issues: Taxonomic challenges related to hybrid species in three genera impact their classification on the IUCN Red List.
- Common Features of Mangrove Species: Many mangrove species share common characteristics, including:
- Above-Ground Breathing Roots: These exposed roots help mangrove plants breathe in oxygen-rich air.
- Extra Trunk Support Structures: Some mangrove species have additional structures that provide support to their trunks.
- Salt-Excreting Leaves: Mangrove leaves have the ability to excrete excess salt, helping the plant manage salt levels.
- Low Water Potentials and High Intracellular Salt Concentrations: Mangroves have adapted to maintain low water potentials and high salt concentrations within their cells.
- Viviparous Propagules: These are water-dispersed seeds that grow while still attached to the parent plant.
- IUCN Mangrove Specialist Group: The IUCN Mangrove Specialist Group is working to create a reliable list of mangrove species, with updates available on their website.
Adjacent Ecosystems
- Mapping the intricate blend of coastal ecosystems, including mangroves, is becoming easier with advancements in remote sensing and computing technologies.
- Tidal Marshes:. global tidal marsh map from 2023 indicates a 2020 extent of 52,880 km², primarily in temperate and Arctic regions, with over 7,000 km² found in tropical areas behind mangroves.
- Seagrass: Initiatives like the Caribbean Carbon Accounting in Seagrass (CariCAS) network are improving our understanding of seagrass extent and carbon stocks.
- Coral Reefs and Tidal Flats: These ecosystems, crucial for carbon storage and storm protection, are under threat from human activities, underscoring the need for comprehensive conservation efforts.
Drivers of Change to the World’s Mangroves During 2000-2020
- The Food and Agriculture Organization of the United Nations (FAO) conducted a detailed study on the global status of mangroves.
Research Methodology on Mangrove Area Changes
 Mangrove Conservation
A recent study on mangrove area changes combined remote sensing technology with local knowledge. This innovative approach aimed to provide a comprehensive analysis of how mangrove areas have changed over time.
Between 2000 and 2020, a significant 43.3% of global mangrove loss was attributed to the conversion of mangroves for aquaculture, oil palm plantations, and rice cultivation.
The study identified natural retraction as a factor responsible for 26% of mangrove loss in specific regions over the past 20 years. Natural retraction is caused by changes in riverbeds, sediment inputs, or sea level fluctuations.
South America and Oceania experience a higher prevalence of natural causes for mangrove loss, while human-induced factors are dominant in Africa and Asia.
Natural expansion accounted for 82% of all mangrove gains globally. Restoration efforts contributed to 25% and 33% of mangrove expansion in South and Southeast Asia and Africa, respectively.
Surprisingly, the study found that natural expansion of mangroves exceeded natural retraction, highlighting the resilience of mangroves and the complex relationship between local biophysical conditions and global warming impacts.
The Red List of Mangrove Ecosystems:
The International Union for Conservation of Nature (IUCN) has spearheaded a global study involving over 250 scientists from 44 countries, known as the Global Red List of Mangrove Ecosystems.
The study began by categorizing the world's mangrove ecosystems into 36 provinces and testing the Red List of Ecosystems (RLE) methodology in the Southeast Asia region. This approach was subsequently applied in the first global assessment of mangroves using the RLE methodology.
18 mangrove provinces, representing approximately 50% of the world's mangrove area, are under threat, with eight provinces classified as Endangered (EN) or Critically Endangered (CR).
Climate change, particularly severe cyclonic storms and sea-level rise, poses a threat to 30% of the assessed mangrove provinces, impacting 37% of the global mangrove area.
Past losses have placed 28% of mangrove provinces at risk, covering 38% of the global area. While mangrove conversion is slowing in South and Southeast Asia, it is accelerating in regions such as the Gulf of Guinea South province.
The RLE global study can inform national assessments and actions to mitigate mangrove loss. However, countries should prioritize reliable national or lower-scale assessments for decision-making.
Management strategies aimed at achieving global commitments, such as the Mangrove Breakthrough to secure 150,000 km² of mangroves, should consider the risk of collapse due to climate change. The Global Red List of Mangrove Ecosystems contributes to these global goals.
Nutrient Pollution:
Anthropogenic pollutants, particularly nitrogen, are increasingly threatening mangrove ecosystems.
Estuarine mangroves with high freshwater inflow are susceptible to nutrient pollution, leading to eutrophication. Agricultural and aquaculture activities contribute by releasing nitrogen-rich water into these areas.
The Indian Sundarbans exhibit elevated nitrogen levels, impacting microbial productivity. Pollutants from the Ganges-Brahmaputra-Meghna Delta, including nitrogen from various sources in the River Ganga, exacerbate this issue.
Pollution and Microbe:
Freshwater influx into mangrove ecosystems introduces antibiotics, heavy metals, and chemicals from agricultural and human activities. This pollution stresses microbial populations, potentially leading to antimicrobial resistance and the emergence of new diseases.
Role of Local Communities in Mangrove Conservation
Engaging with Local Ecological Knowledge (LEK) in Research and Practice:
- Local ecological knowledge (LEK) is crucial for developing effective and sustainable mangrove conservation and restoration efforts.
- The Global Mangrove Alliance's LEK Best-Practice Guide offers guidance on incorporating LEK into mangrove research and conservation projects ethically and effectively.
- Raising awareness of the diversity and importance of LEK related to mangrove ecosystems.
- Highlighting the value of LEK in enhancing mangrove conservation and restoration outcomes.
- Encouraging increased engagement of LEK in conservation projects.
- Emphasizing equitable collaboration with local communities in leveraging their knowledge and practices.
Diversified Livelihoods For Mangrove Communities:
Engaging local communities sustainably in mangrove management is essential, ensuring they benefit from the resources provided by mangroves.
In areas where population growth and diminishing mangrove resources coincide, there is a need to explore sustainable practices and new opportunities, both within and beyond mangrove areas.
- Fisheries: Mangroves are crucial for fisheries, acting as ‘fish factories’ that produce large quantities of commercially important species.
- Salt Production: Salt production near mangrove forests can have negative impacts, such as clearing mangroves for salt pans or using mangrove wood for firewood. Sustainable practices include restricting salt production to non-mangrove areas and stopping the use of mangrove firewood. For example, in Guinea, 30% of mangrove salt is produced by natural evaporation of brine.
- Sustainable Timber Harvesting: Communities have developed sustainable harvesting techniques for mangrove wood, which is durable and resistant to termites, ensuring the retention of the forest's ecosystem services.
- Beekeeping: Traditional beekeeping in parts of Mexico and South America is gaining popularity as a supplementary income source, helping the survival of native stingless bees affected by invasive Africanized honeybees.
- Management, Restoration, Research: Community-led initiatives in Ecuador, such as the Sabana Grande Association’s mangrove nursery, have successfully restored abandoned shrimp ponds and generated income by selling seedlings for mangrove restoration events.
- Tourism and Recreation: Recreational activities, including fishing in mangrove-adjacent areas, are popular among local communities and visitors. In countries like the Bahamas, Cuba, and Belize, local fishing guides are highly sought after by international anglers.
Coastal Carbon Network (CCN):
 Coastal Ecosystem Mapping
- Coastal Carbon Network (CCN):
- The Coastal Carbon Network (CCN) is a group of scientists focused on coastal wetlands, working under the guidance of the Smithsonian Institution.
- The CCN aims to encourage scientific research, improve policies based on scientific findings, and enhance the management of coastal ecosystems.
- Blue Carbon Explorer: The Nature Conservancy (TNC) introduced the Blue Carbon Explorer in April 2023, with assistance from Planet Labs and the Food and Agriculture Organization of the United Nations (FAO).
- In the Caribbean, TNC is creating updated maps of mangroves and seagrass, using satellite images along with detailed field data collection.
Advantages of Mangroves
 Mangrove Benefits
- Mangrove Blue Carbon:
- The 2023 global model, supported by the Global Mangrove Alliance, demonstrates that mangrove soils and biomass play a crucial role in carbon sequestration and emissions mitigation by storing substantial carbon, particularly in the top metre of soil.
- On average, mangroves store 394 tonnes of carbon per hectare, comprising 319 tonnes in the soil, 54 tonnes in above-ground biomass, and 21 tonnes in below-ground biomass.
- Southeast Asia, including regions like Sumatra and Borneo in Indonesia, Malaysia, and Myanmar, harbours the largest stocks of blue carbon. Notable stocks are also present in West Africa (e.g., Nigeria and Guinea-Bissau), Central and South America (e.g., Mexico, Venezuela, and Colombia), and the Caribbean (e.g., Cuba).
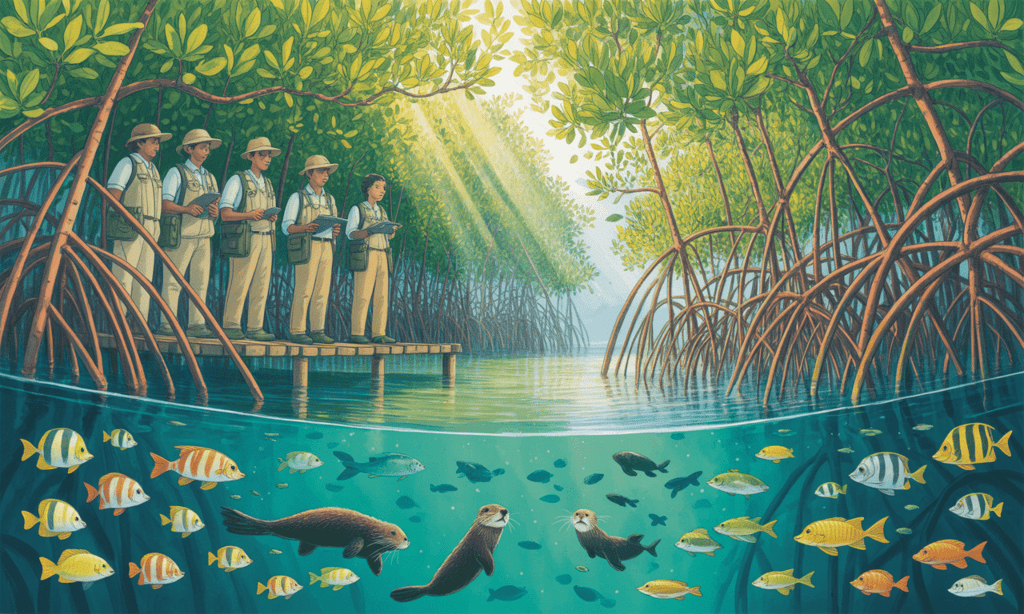
- Mangrove ecosystems are rich in biological diversity due to their varied conditions, such as different forest structures, litter-dominated forest floors, mudflats, and adjacent water bodies.
- Situated between land and sea, mangrove ecosystems provide habitat for both terrestrial and aquatic organisms.
- They function as nurseries, feeding, and breeding grounds for a variety of species, including crabs, prawns, mollusks, finfish, birds, reptiles, and mammals.
- The presence of diverse microorganisms in mangroves contributes to the nutrient richness and productivity of these habitats.
- Interestingly, insect diversity in mangroves is notably high despite low plant diversity, with over 3,000 insect species recorded in Singapore’s mangroves alone.
- The Sundarbansin India and Bangladesh serve as a crucial habitat for globally threatened species, such as tigers, fishing cats, Gangetic dolphins, estuarine crocodiles, horseshoe crabs, water monitor lizards, and river terrapins.
- Mangrove ecosystems in India boast the highest recorded biodiversity of any country, with a total of 5,746 species, of which 4,822 species (84%) are animals, representing most major taxonomic groups and contributing to 4.76% of Indian fauna.
- Dominant species groups include mangrove plants, marine algae, fungi, protozoa, nematodes, polychaetes, arachnids, crustaceans, mollusks, insects, birds, and finfish.
- Despite their significance, the actual species richness of mangrove regions worldwide is poorly documented due to the lack of systematic and extensive field surveys. Effects of Mangrove Loss
- Little is known about the impact of mangrove loss on biodiversity at local or regional scales.
- The current IUCN Red List of Threatened Ecosystems indicates that eleven of the 70 mangrove species (16%) are at an elevated threat of extinction, particularly those on the Atlantic and Pacific coasts of Central America.
- Many species endemic to mangroves are threatened with extinction, including 48 birds, 14 reptiles, one amphibian, and six mammals, primarily in Asia and Australia, with approximately 40% of these species at risk.
 Mangrove Ecosystem
Mangroves are unique trees that grow in coastal areas where saltwater and freshwater mix. They have special roots that can handle both saltwater and strong waves. These trees are found along the shores of tropical and subtropical regions around the world. Mangroves play a crucial role in protecting coastlines and providing habitats for various species.
In the Galápagos Islands, famous for their unique wildlife and role in the study of evolution, mangroves are an important but often overlooked feature. These islands, known for their rugged volcanic coastline, are home to mangrove forests that offer vital environmental services, especially to the local penguin population.
Mangroves in the Galápagos Islands
- The Galápagos Islands are renowned for their contribution to the theory of evolution and their unique conservation status, hosting species found nowhere else on Earth.
- Mangrove Ecosystem. Along the rugged volcanic coastline of these islands, mangrove forests thrive, providing essential environmental services.
- Unique Feeding Grounds. In the Galápagos, penguins have a unique feeding behavior, as they are the only penguins in the world that feed in mangrove bays. This highlights the specific and critical role that mangroves play in the local ecosystem.
Mangroves’ Interaction With Incoming Coastal Stormwaters
- Flooding Risk. Flooding is a common natural disaster worldwide. Studies show that about 1.3% of the global population lives in areas vulnerable to 1-in-100-year coastal flood events.
- Role of Mangroves. Mangroves significantly impact coastal flooding patterns by slowing down and redirecting storm surges. They also reduce wind and wave energy, helping to mitigate flood impact.
- Flood Mitigation. While mangroves cannot completely block high water levels from storm surges, they do reduce the speed, depth, and overall extent of floods. For instance:
- Mangroves typically decrease flood depths by 15-20%.
- For rare storms, such as those occurring once every 100 years, flood depth reductions can exceed 70%.
- Impact of Mangrove Patches. Even smaller patches of mangroves can effectively lower flood depths and reduce wave impacts in surrounding areas.
- Factors Influencing Flood Mitigation. The effectiveness of mangroves in mitigating coastal flooding depends on various factors, including:
- Forest characteristics, such as width and density
- Coastal shape
- Storm conditions, including surge height and duration
- Mapping Global Flood Risk Reduction. Researchers use computer models to simulate the impact of mangroves on storm surges, treating them as rough surfaces. However, traditional methods like the transect approach are less effective in complex coastal areas such as estuaries, deltas, and lagoons.
Connection Between Mangroves and Food Security
 Mangrove Ecosystem Benefits
- Food Security and Mangroves:
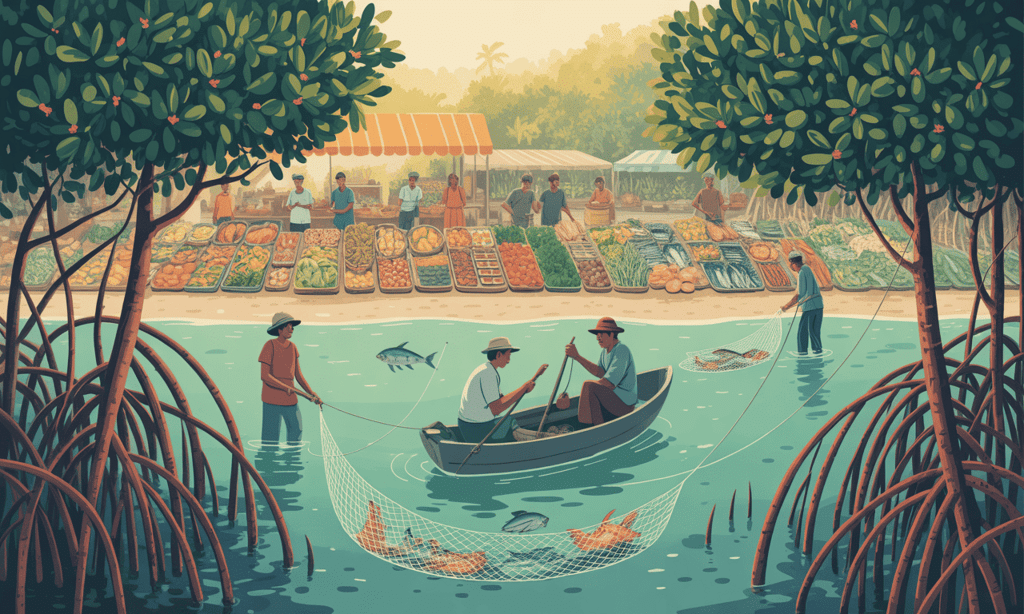
- Mangroves are among the most productive ecosystems in the world. Their high productivity supports a diverse range of wildlife and provides essential resources for humans. Mangroves contribute to all four dimensions of food security: availability, access, utilization, and stability.
- Mangrove Fisheries:Fish and seafood from mangrove areas are packed with important nutrients like protein, omega-3 fatty acids, vitamins (such as D and B12), and minerals (including iron and zinc).
- A global team of nearly 50 mangrove fisheries scientists created a model to estimate the number of fish and invertebrates that depend on mangroves for food.
- They collected data on the density of 37 species worldwide, including fish, prawns, crabs, and a cockle species.
- Mangroves are estimated to support nearly 800 billion young fish, prawns, bivalves, and adult crabs each year.
- Non-Aquatic Foods: Mangrove ecosystems also provide non-aquatic food sources. For example, leaves from certain mangroves and herbs found in these areas are harvested and eaten as vegetables.
- Mangroves as Fodder: The leaves of mangroves are used as fodder for livestock such as goats, sheep, cows, and camels, especially in drier regions.
- Fuelwood and Charcoal: Coastal communities use mangrove fuelwood for cooking, water purification, and fish smoking.
- Source of Income: Selling products from mangrove ecosystems, including fish, timber, charcoal, honey, fruits, vegetables, and other non-wood forest products, provides economic stability for coastal communities.
- Stability and Resilience: Mangroves offer crucial ecosystem services that support food production and ensure long-term stability.
Fish Nurseries in the Tallest Mangroves of the Americas
 Mangrove Fish Nurseries
- The Esfuerzo Pescador community council, situated on the southern Pacific coast of Colombia, is home to one of the tallest mangrove forests globally. This region is known for its rich fish diversity. To promote sustainable fishing practices, the community has initiated a fishing monitoring program aimed at identifying harmful practices such as bottom trawling.
Aquaculture and Mangroves
- The Problems With Aquaculture for Mangroves
- Traditional aquaculture, practiced for over 2,000 years, includes methods like the gei wais in Hong Kong and the tambaks in Indonesia. These traditional practices differ significantly from modern industrial aquaculture.
- Currently, it is estimated that shrimp aquaculture spans approximately 3.49 million hectares worldwide.
- Attempts at Solutions
- Certification and ecolabelling for shrimp from low-impact or mangrove-friendly aquaculture have proven ineffective, as highlighted by independent studies in countries like Honduras and Bangladesh.
- Many of the newly created jobs, such as security guards or shrimp processors, tend to be low-paying and require minimal skills.
- Mangrove conservation and restoration initiatives, developed in collaboration with local communities, offer a more sustainable alternative to shrimp certification and "mangrove-friendly" aquaculture practices.
Restoring Mangroves by Growing Food
- The expansion of aquaculture has led to the destruction of mangroves. However, intensive farming in mangrove areas often fails, resulting in degraded regions that could be restored for sustainable seafood harvesting without additional inputs.
- Integrated Mangrove Aquaculture (IMA)involves the restoration of mangroves within the ponds and embankments of farms.
- Once the mangroves are established, they provide food and shelter for aquatic species, helping them thrive within the natural food web. IMA typically utilizes a polyculture approach, where farmers cultivate various species such as shrimp, crab, filter-feeding fish, and bivalve mollusks.
- IMA is analogous to agroforestry in aquatic environments, where food is grown and harvested within a functioning ecosystem.
- IMA aims to restore at least 50% of the farm's surface area with mangroves.
- IMA offers significant income opportunities for local communities. After the initial investment in hatchery-reared juveniles, there are no further expenses, helping to avoid the debt trap that many small-scale shrimp farmers face due to costs associated with feed, fertilizers, and other chemicals.
Sustainable Aquaculture in Mangrove Ecosystems (SAIME):
 Mangrove Aquaculture
- SAIME, managed by the Nature Environment and Wildlife Society (NEWS) in the Indian Sundarbans, aims to integrate community needs, conservation, and livelihoods while addressing climate change. The initiative focuses on building coastal resilience against rising sea levels through collaborative partnerships.
- This ecosystem-based and climate-adaptive approachseeks to:
Promote Mangrove Restoration
- Restore mangrove ecosystems in the Sundarbans.
- Develop sustainable aquaculture practices using a polyculture method.
- The Black Tiger Shrimp is being considered as a candidate species for aquaculture without the use of external feed.
Why is it Important to Save Mangroves?
 Mangrove Protection
- Need for Protection:
- Mangroves are crucial for both biodiversity and human communities, which is why the Global Mangrove Alliance (GMA) aims to double their protection by 2030.
- However, increasing protection to 80% is a significant challenge due to various existing threats.
- Notable Protected Areas:
- Examples of protected mangrove areas include the Florida Everglades National Park in the U.S.A. and the Daintree National Park in Australia.
- Urban protected areas in cities like Dubai, Singapore, and China provide public access to mangroves.
- Important wildlife is safeguarded in these areas, such as Bengal tigers in the Sundarbans World Heritage Site and over 20,000 flamingos in the Mexican Biosphere Reserves of Los Petenes and Ría Celestún.
- Major Mangrove Nations:
- Countries like Brazil, Mexico, and Bangladesh have declared over three-quarters of their mangroves as protected.
- However, doubling protected area coverage in these countries is not feasible, though monitoring the effectiveness of protection remains essential.
- Countries with Low Protection:
- Many countries, such as Malaysia, Papua New Guinea, and Myanmar, still have less than 5% of their mangroves protected.
- Even Indonesia, which has a significant portion of the world’s mangroves, has only 15% of its remaining mangroves in protected areas.
Other Effective Area-based Conservation Measures (OECMs):
- Conservation can also be achieved through means other than protected areas.
- OECM includes locations and situations outside of protected areas where human impact may be limited, or where sustainable uses are recognized and secured long-term.
- OECMs provide effective and secure conservation outcomes that complement formally designated protected areas.
- Existing guidelines for OECMs emphasize the need for a clear geographic definition and encompass areas of biodiversity interest under fair and effective governance.
Alerts for Action:
- Introduction: Mangrove losses typically occur rapidly, but existing annual mangrove extent maps, like those from the Global Mangrove Watch (GMW), only capture these changes a year or more after they happen.
- Need for Timeliness: There was a need for a quicker method to detect mangrove losses, which led to the development of the GMW mangrove loss alerts product.
- Technical Development: The GMW mangrove loss alert system was created using the Microsoft Planetary Computer, a cloud computing platform that facilitates the analysis of satellite images.
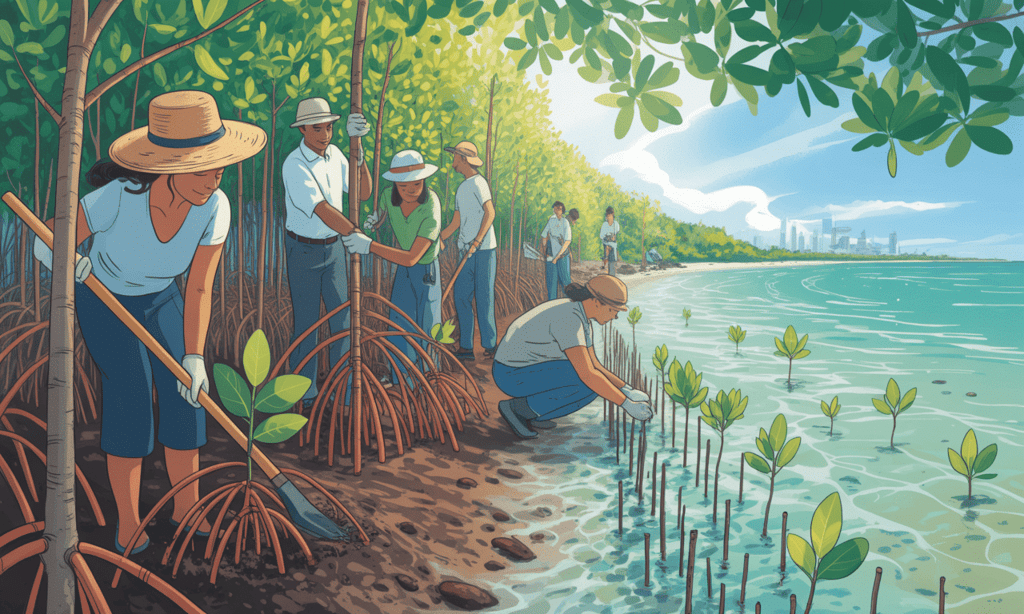
Restoration Efforts:
- Mangrove restoration is receiving increased attention due to various national and international targets, such as the Bonn Challenge and the GMA’s goal of restoring over 4,000 km² by 2030.
- New tools, resources, and training programs are being developed to enhance mangrove restoration and conservation efforts globally.
- Capacity-Building: Restoration initiatives require building capacity and aligning restoration opportunities with funding and investors.
- Global tools like the Mangrove Restoration Tracker Tool have been established to promote proper reporting and monitoring, as well as to share experiences and best practices worldwide.
Restoration Guidance (October 2023):
- The GMA and the Blue Carbon Initiative developed the Best Practice Guidelines for Mangrove Restoration to guide project managers, investors, and policymakers through the restoration project cycle.
- The guidelines emphasize inclusive, community-based approaches to improve restoration success and sustainability.
- They are divided into four phases:
- Phase 1: Setting goals and assessing project suitability.
- Phase 2: Project design, focusing on socio-economic and biophysical factors.
- Phase 3: Project implementation and funding, including stakeholder engagement.
- Phase 4: Monitoring, evaluation, and adaptive management.
Six Guiding Principles for Successful Mangrove Restoration:
- Principle 1 - Safeguard nature and maximize biodiversity: Protect and enhance remaining intact mangrove ecosystems using science-based ecological restoration methods.
- Principle 2 - Employ the best information and practices: Utilize the best available science-based knowledge, including Indigenous and local insights for mangrove interventions.
- Principle 3 - Empower people and address their needs: Ensure local social safeguards that protect and enhance community member rights and knowledge in project design.
- Principle 4 - Align to the broader context: Operate within the local context and align with international trends and their local implications.
- Principle 5 - Design for sustainability: Create sustainable mangrove projects that consider future persistence, financing, threat reduction, and community stewardship.
- Principle 6 - Mobilize high-integrity capital: Ensure capital flows at necessary scales and funding reaches ready-to-scale projects.
Tools for Informing Global Policy Commitments:
- Policies: 61 countries have included mangrove action in their national climate commitments, with 50 governments endorsing the Mangrove Breakthrough to protect 15 million hectares of mangroves by 2030.
- 2030 Targets: Countries aim to restore at least 30% of degraded ecosystems by 2030 under the UN Decade on Ecosystem Restoration and the Kunming-Montreal Global Biodiversity Framework.
- International Developments:
- The UAE Consensus: An agreement at COP28 to move away from fossil fuels and promote complementary climate actions regarding nature, oceans, and food systems.
- The Kunming-Montreal Global Biodiversity Framework:. global action plan adopted by the CBD to halt and reverse biodiversity loss by 2030.
- The Ocean Breakthroughs: Setting the Aquatic Food target to support resilient aquatic food systems.
- The FAO’s 2024 update of the small-Scale Fisheries Guidance: Emphasizing the importance of preserving and enhancing local ecosystems, especially mangroves.
- The Emirates Declaration at COP28: Committing to enhance adaptation and resilience for farmers, fishers, and food producers through sustainable practices.
Future Outlook: Mangroves at the 2025 UN Climate Change Conference
- The GMA plans to highlight the essential role of mangroves for climate action at the 2025 UN Climate Change Conference (UNFCCC COP30) in Brazil, focusing on nature and Indigenous peoples and local communities (IPLCs).
|
22 videos|122 docs|8 tests
|
FAQs on Summary of Indices & Reports - 5 (2025) - Economic Survey & Government Reports - UPSC
| 1. What is the Global Hunger Index and why is it important? |  |
| 2. What strategies can be employed to accelerate growth in the edible oil sector? | |
| 3. What are the ecological benefits of mangroves, and why is their conservation crucial? | |
| 4. How does the Global Hunger Index influence international food policies? | |
| 5. What indicators are used in the assessment of mangrove health and status? | |


Summary of Indices & Reports - 5 (2025) | Economic Survey & Government Reports - UPSC
,past year papers
,MCQs
,Free
,Previous Year Questions with Solutions
,mock tests for examination
,Semester Notes
,Summary of Indices & Reports - 5 (2025) | Economic Survey & Government Reports - UPSC
,Important questions
,ppt
,Summary of Indices & Reports - 5 (2025) | Economic Survey & Government Reports - UPSC
,shortcuts and tricks
,Extra Questions
,practice quizzes
,Objective type Questions
,Summary
,Sample Paper
,Exam
,study material
,Viva Questions
,video lectures
;


Summary of Indices & Reports - 5 (2025) Free PDF Download
Importance of Summary of Indices & Reports - 5 (2025)
Summary of Indices & Reports - 5 (2025) Notes
Summary of Indices & Reports - 5 (2025) UPSC Questions
Study Summary of Indices & Reports - 5 (2025) on the App
|
© EduRev
|
Education Revolution
|


|


