Bank Exams Exam  >  Bank Exams Notes  >  IBPS Clerk Prelims 2024 Preparation  >  Types of Pie Charts

Types of Pie Charts | IBPS Clerk Prelims 2024 Preparation - Bank Exams PDF Download

There are two types of pie charts:


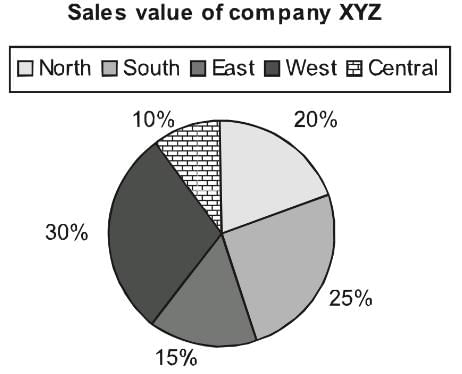
(A) Normal Pie Chart


Types of Pie Charts | IBPS Clerk Prelims 2024 Preparation - Bank Exams


This displays the contribution of each component of the pie. 


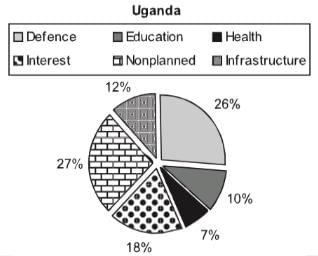
(B) Exploded Pie Chart


Types of Pie Charts | IBPS Clerk Prelims 2024 Preparation - Bank Exams


(C) Mixed Layer Pie Chart


It is conventional to have multiple pie charts related to the same paragraph question to determine different aspects & drawing comparisons between the data. Once in CAT 2018 aspirants like you were posed with a multi-layered pie chart question like below; let’s solve the same pie chart to understand the concept better.
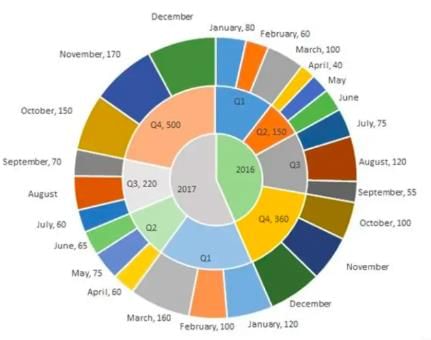
Types of Pie Charts | IBPS Clerk Prelims 2024 Preparation - Bank Exams

The multi-layered pie-chart below shows the sales of LED television sets for a big retail electronics outlet during 2016 and 2017. The outer layer shows the monthly sales during this period, with each label showing the month followed by sales figure of that month. For some months, the sales figures are not given in the chart. The middle-layer shows quarter-wise aggregate sales figures (in some cases, aggregate quarter-wise sales numbers are not given next to the quarter). The innermost layer shows annual sales. It is known that the sales figures during the three months of the second quarter (April, May, June) of 2016 form an arithmetic progression, as do the three-monthly sales figures in the fourth quarter (October, November, December) of that year.

Q.1. What is the percentage increase in sales in December 2017 as compared to the sales in December 2016?
a.) 38.46
b.) 22.22
c.) 50.00
d.) 28.57
Q.2. In which quarter of 2017 was the percentage increase in sales from the same quarter of 2016 the highest?
a.) Q4
b.) Q1
c.) Q2
d.) Q3
Solution: To easily solve the questions we can first represent the information given in pie-chart in a consolidated table to make it easier to read and understand.
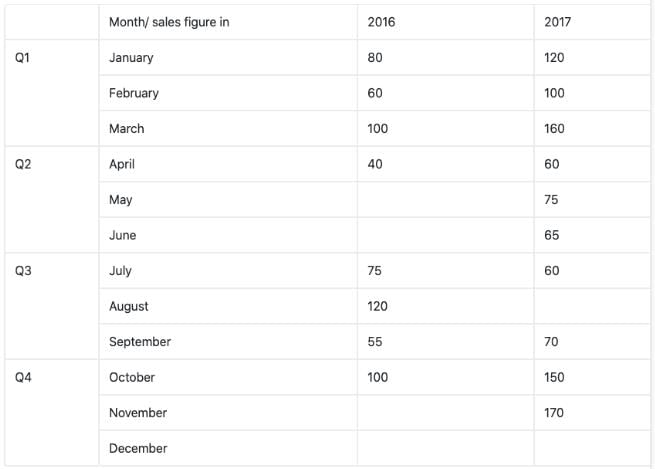
Types of Pie Charts | IBPS Clerk Prelims 2024 Preparation - Bank Exams

As you can see in the above table there a few month’s sales are missing and we need to evaluate them first from the given information and then find the answers to above given question.

Now, it’s been given in the question that the months of April, May, June in 2016 forms an A.P. and so does the months of Quarter 4 of 2016, i.e. Oct, Nov, Dec.

Total sale in Quarter 2 = 150

Let a-d, a, a+d be the three terms of A.P.

Hence, a-d + a + a+d =150

  • 3a = 150
  • a = 50

Since, April sale is 40, i.e. a-d = 40

  • d = 10

Using that we can easily find the rest of the month sales values i.e. 50 and 60 respectively.
Similarly, using the above method we can find out the values for the month of Nov’16 and Dec’16. In this case, a would-be 120 and d = 20.
Thus, sales for these months are 120 and 140 respectively.
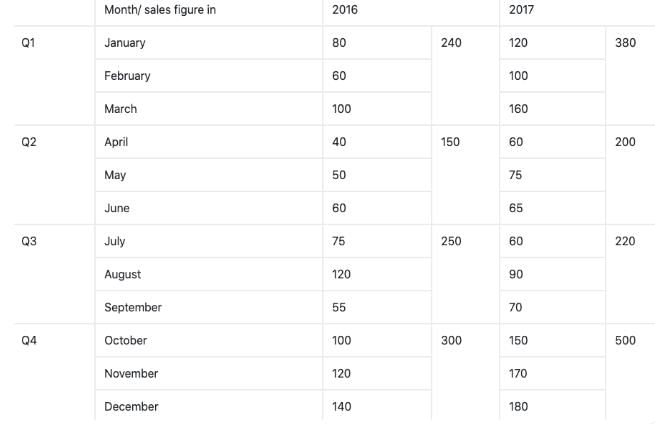
Now as you can see in the table, we have found out all missing monthly sales figure except for December’17 and August’17 which can be easily find out as
Total sales in Quarter 4 of 2017 = 500
And sales in Oct’17 and Nov’17 are 150 and 170 respectively.
Hence, the sale for December = 500 -150-170
= 180
And similarly, Sale for August’17 = 220 – 60 – 70 = 90

Therefore, our table becomes,
Types of Pie Charts | IBPS Clerk Prelims 2024 Preparation - Bank Exams
Now we are in position to answer all the given questions using the above table.
Ans 1: Percentage increase in sales of Dec’17 as compared to Dec’16 =
Ans 2: We need to evaluate the quarter with the highest increase in sales in percentage terms.
Types of Pie Charts | IBPS Clerk Prelims 2024 Preparation - Bank Exams

Practice Questions:

Question for Types of Pie Charts
Try yourself:During which quarter was the percentage decrease in sales from the previous quarter’s sales the highest?
View Solution

Question for Types of Pie Charts
Try yourself:During which month was the percentage increase in sales from the previous month’s sales the highest?
View Solution

The document Types of Pie Charts | IBPS Clerk Prelims 2024 Preparation - Bank Exams is a part of the Bank Exams Course IBPS Clerk Prelims 2024 Preparation.
All you need of Bank Exams at this link: Bank Exams
296 videos|297 docs|179 tests

Top Courses for Bank Exams

FAQs on Types of Pie Charts - IBPS Clerk Prelims 2024 Preparation - Bank Exams

1. What is a pie chart?
A pie chart is a circular statistical graph that is divided into sectors to represent data. Each sector represents a proportion of the whole and is often colored or shaded differently to make it visually distinct. The size of each sector is proportional to the quantity it represents.
2. What are the different types of pie charts?
There are several types of pie charts, including: 1. Basic pie chart: This is the traditional type of pie chart where each sector represents a different category or data point. 2. Exploded pie chart: In this type, one or more sectors are separated from the rest of the chart to highlight specific data. 3. Doughnut chart: Similar to a basic pie chart, but with a hole in the center. The outer rings represent categories while the inner ring can be used to show subcategories or additional data. 4. 3D pie chart: This type adds a three-dimensional effect to the basic pie chart, giving it a more visually appealing appearance. 5. Nested pie chart: Also known as a multi-level pie chart, it allows for the representation of hierarchical data, with each level of the chart showing different levels of detail.
3. When should I use a pie chart?
Pie charts are most effective when you want to show how different categories or data points contribute to a whole. They are great for illustrating proportions and percentages. However, they may not be suitable for displaying large amounts of data or comparing values that are close in size.
4. How do I create a pie chart?
Creating a pie chart is typically done using data visualization tools or software like Microsoft Excel or Google Sheets. Here's a general step-by-step process: 1. Organize your data: Make sure your data is in a format that can be easily represented in a pie chart, with categories and corresponding values. 2. Open a data visualization tool: Use a software program or online tool that supports pie chart creation. 3. Input your data: Enter the categories and corresponding values into the software. 4. Generate the chart: Select the data and choose the pie chart option to generate the chart. 5. Customize and format: Modify the chart's appearance, such as colors, labels, and titles, to make it visually appealing and informative. 6. Save or export: Save the chart as an image or export it to use in presentations or reports.
5. What are the advantages and limitations of using pie charts?
Advantages: - Easy to understand and interpret. - Visually appealing and engaging. - Effective in showing proportions and percentages. - Can highlight the most significant categories. Limitations: - Not suitable for displaying large amounts of data or precise values. - Difficult to compare values that are close in size. - Can be misleading if the sectors are not accurately proportional. - May not be suitable for complex or hierarchical data.
296 videos|297 docs|179 tests
Download as PDF
Explore Courses for Bank Exams exam

Top Courses for Bank Exams

Signup for Free!
Signup to see your scores go up within 7 days! Learn & Practice with 1000+ FREE Notes, Videos & Tests.
10M+ students study on EduRev
Related Searches

Important questions

,

shortcuts and tricks

,

Semester Notes

,

mock tests for examination

,

Extra Questions

,

study material

,

Exam

,

MCQs

,

past year papers

,

Types of Pie Charts | IBPS Clerk Prelims 2024 Preparation - Bank Exams

,

Objective type Questions

,

video lectures

,

Sample Paper

,

pdf

,

Summary

,

practice quizzes

,

Viva Questions

,

Types of Pie Charts | IBPS Clerk Prelims 2024 Preparation - Bank Exams

,

Previous Year Questions with Solutions

,

Free

,

ppt

,

Types of Pie Charts | IBPS Clerk Prelims 2024 Preparation - Bank Exams

;