Statistics Class 10 Worksheet Maths Chapter 13
Multiple Choice Questions
1. If x1, x2, x3,….., xn are the observations of a given data. Then the mean of the observations will be:
(a) Sum of observations/Total number of observations
(b) Total number of observations/Sum of observations
(c) Sum of observations +Total number of observations
(d) None of the above
Q2: If the mean of frequency distribution is 7.5 and ∑fi xi = 120 + 3k, ∑fi = 30, then k is equal to:
(a) 40
(b) 35
(c) 50
(d) 45
Q3: The mode and mean is given by 7 and 8, respectively. Then the median is:
(a) 1/13
(b) 13/3
(c) 23/3
(d) 33
Q4: The mean of the data: 4, 10, 5, 9, 12 is;
(a) 8
(b) 10
(c) 9
(d) 15
Q5: The median of the data 13, 15, 16, 17, 19, 20 is:
(a) 30/2
(b) 31/2
(c) 33/2
(d) 35/2
Q6: If the mean of first n natural numbers is 3n/5, then the value of n is:
(a) 3
(b) 4
(c) 5
(d) 6
Q7: If AM of a, a+3, a+6, a+9 and a+12 is 10, then a is equal to;
(a) 1
(b) 2
(c) 3
(d) 4
Q8: The class interval of a given observation is 10 to 15, then the class mark for this interval will be:
(a) 11.5
(b) 12.5
(c) 12
(d) 14
Q9: If the sum of frequencies is 24, then the value of x in the observation: x, 5,6,1,2, will be;
(a) 4
(b) 6
(c) 8
(d) 10
Q10: The abscissa of the point of intersection of the less than type and of the more than type cumulative frequency curves of a grouped data gives its
(a) mean
(b) median
(c) mode
(d) all the three above
Solve the following Questions
Q1: The class marks of a distribution are 13, 17,21, 25 and 29. Find the true class limits.
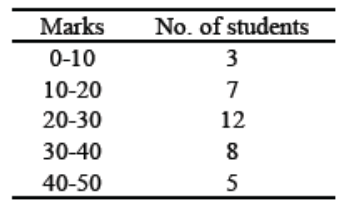
Q2: Convert the given simple frequency series into a:
(i) Less than cumulative frequency series.
(ii) More than cumulative frequency series. Q3: Drawn ogive for the following frequency distribution by less than method.
 Q4: The temperature of a patient, admitted in a hospital with typhoid fever, taken at different times of the day are given below. Draw the temperature-time graph to reprents the data:
 Q5: The class marks of a distribution are 82, 88, 94, 100, 106, 112 and 118. Determine the class size and the classes.
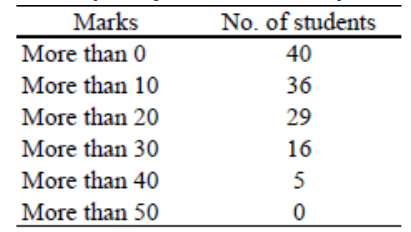
Q6: Convert the following more than cumulative frequency series into simple frequency series. Q7: Draw a cumulative frequency curve for the following frequency distribution by less than method.
You can access the solutions to this worksheet here.
|
127 videos|584 docs|79 tests
|


