NCERT Solutions for Class 3 Maths - Smart Charts

Page No. 177
Q.1. Flowers of Different Colours Have you been to a park? What coloured flowers did you see? Were most of the flowers yellow in colour?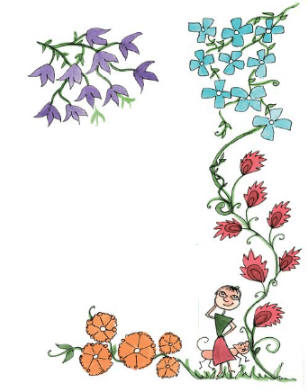 Look at the different flowers in the picture. Complete the table:
| Colour of flowers | Number of flowers |
| Blue | |
| Red | |
| Orange | |
| Purple |
Draw the right flower. Write how many there are.
(a) ________ are the most in number. How many? _________.
(b) ________ are the least in number. How many? _________.
(c) ________ are more than ________
(d) ________ are more than ________
Ans.
| Colour of flowers | Number of flowers |
| Blue | 9 |
| Red | 7 |
| Orange | 5 |
| Purple | 10 |
(a) are the most in number i.e. 10.
(b) are the least in number i.e. 5.
(c) are more than
(d) are more than
Page No. 178
Q.1. What do We See on the Road?
Look at the traffic scene in the picture and fill in the table.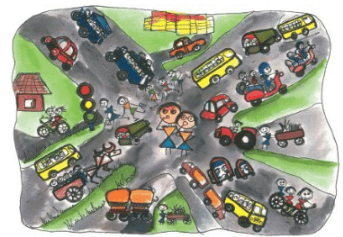
| Way of Travel | How many |
| Walking (people) | |
| Bicycles | |
| Scooters | |
Answer the following questions.
(a) In the picture which way of travel do you see the most? ________
(b) Which way of travel (vehicle) do you see the least? ________
(c) The number of people walking is more than the number of _______
(d) The number of buses is less than the number of ________
Ans.
| Way of Travel | How many |
| Walking (people) | 5 |
| Bicycles | 2 |
| Scooters | 2 |
| 4 wheelers | 17 |
| Bullock cart | 1 |
| Rickshaw | 2 |
(a) Travelling by 4 wheeler can be seen the most in the picture.
(b) Travelling by bullock cart / tractor can be seen the least in the picture.
(c) The number of people walking is more than the number of people travelling on bullock cart.
(d) The number of buses is less than the number of cars.
Page No. 181
Q.1. Talk to people around you about their favourite sweets.
Fill in the table:
| Favourite sweet | Number of people |
| Jalebi | |
 From the above table answer the following:
(a) Most favourite sweet ____________
(b) Least favourite sweet _____________
(c) ____________ is liked more than_____________
(Name of the sweet) (Name of the sweet)
(d) ____________ is liked more than_____________
(e) ____________ is liked more than_____________
(f) _____________ is liked more than_____________
Ans.
| Favourite sweet | Number of people |
| Jalebi | 20 |
| Rasgulla | 18 |
| Ras malai | 25 |
| Laddoo | 22 |
| Burfi | 17 |
| Kalakand | 15 |
(a) Most favourite sweet is Ras malai.
(b) Least favourite sweet is Kalakand.
(c) Rasgulla is liked more than Burfi.
(Name of the sweet) (Name of the sweet)
(d) Laddoo is liked more than Kalakand.
(e) Rasgulla is liked more than Burfi.
(f) Jalebi is liked more than Kalakand.
Page No. 182
Q.1. Ask your friends about the number of people living in their homes. Fill in the table.
| Number of people living together | How many families |
| 1 alone | |
| 2 people | |
| 3 people | |
| 4 people | |
| 5 people | |
| 6 people | |
| 7 people | |
| 8 people | |
| ........................... |
(a) Most families have _____________ people living in their homes.
(b) The smallest number of people living in a home is ____________
(c) The number of families having 4 people is ____________
Ans.
| Number of people living together | How many families |
| 1 alone | 2 |
| 2 people | 5 |
| 3 people | 8 |
| 4 people | 6 |
| 5 people | 4 |
| 6 people | 2 |
| 7 people | 2 |
| 8 people | 1 |
| ......................... |
(a) Most families have 3 people living in their homes.
(b) The smallest number of people living in a home is 1.
(c) The number of families having 4 people is 6.
Page No. 184
Q.1. Getting Smart with Charts
Attendance Board
Date 8/2/2007
| Class | Number of students | Students present | Students absent |
| Class I | 27 | 25 | 2 |
| Class II | 23 | 22 | 1 |
| Class III | 24 | 21 | 3 |
| Class IV | 22 | 18 | 4 |
| Class V | 25 | 23 | 2 |
| Total |
This board shows the number of students in each class. It also shows the number of students present and absent.
- How many children in all are there in the school? _________
- How many children in all are absent on that day? _________
Ans.
Attendance Board
Date 8/2/2007
| Class | Number of students | Students present | Students absent |
| class I | 27 | 25 | 2 |
| Class II | 23 | 22 | 1 |
| Class III | 24 | 21 | 3 |
| Class IV | 22 | 18 | 4 |
| Class V | 25 | 23 | 2 |
| Total | 121 | 109 | 12 |
- There are a total of 121 students in the class.
- 12 students are absent on that day.
Ques 2: 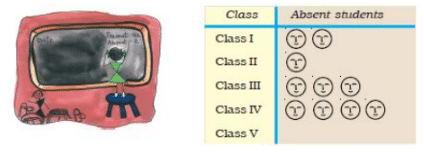 This is a chart to show the number of absent students. Each absent student is shown by
• In the chart show the absent students of Class V.
Ans. 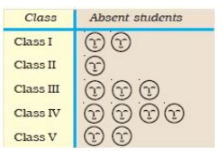
Page No. 185
Q.1. Now look at the chart and fill in the blanks:
(a) The class with the highest number of absent students is__________.
(b) The class with the least number of absent students is___________.
(c) The class with 3 students absent is__________.
(d) The number of students absent in Class IV and Class V are_________ and________.
Ans.
(a) The class with the highest number of absent students is Class IV.
(b) The class with the least number of absent students is Class II.
(c) The class with 3 students absent is Class III.
(d) The number of students absent in Class IV and Class V are 4 and 2.
Page No. 186
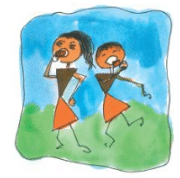
Q.1. Rohan, Jacob and Geeta also measured their hands. They stuck their strips as shown.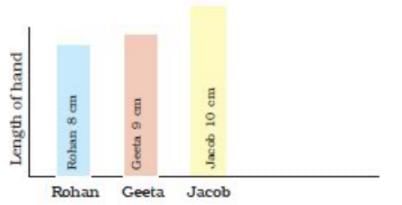 Look at the picture and fill in the blanks:
(a) The length of Jacob’s hand is__________ (more/less) than Geeta’s hand
(b) The length of Geeta’s hand is__________ (more/less) than Rohan’s hand.
(c) _________ has the longest hand.
(d) _________ has the shortest hand.
Ans.
(a) The length of Jacob’s hand is more than Geeta’s hand.
(b) The length of Geeta’s hand is more than Rohan’s hand.
(c) Jacob has the longest hand.
(d) Rohan has the shortest hand.
Q.2. In the chart below stick the strips of all the friends in your group. Keep some space between the strips. Ans. The answer may vary from student to student, based on his/her observation. It is highly recommended that the students prepare the answer on their own.
Page No. 187
Q.1. Children coming to School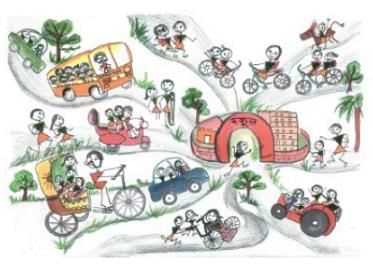 Look at the picture and fill in the table.
| Way of coming | Tractor | ||||
| Number of students | 3 |
Ans.
| Way of coming | Tractor | Bicycle | Walking | Car | Rickshaw |
| Number of students | 3 | 5 | 11 | 2 | 4 |
Q.2. 3 students are coming by a tractor. We write 3 in the table. We also draw 3 faces on top of ‘tractor’ in the chart. Draw faces in the chart to show how many children come by bus, bicycle, etc.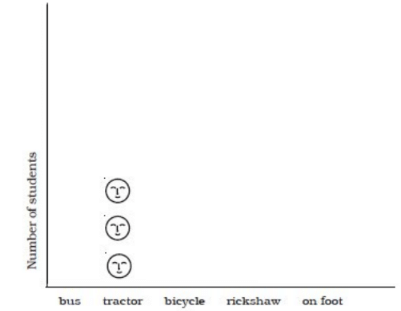 Ans:
Ans: 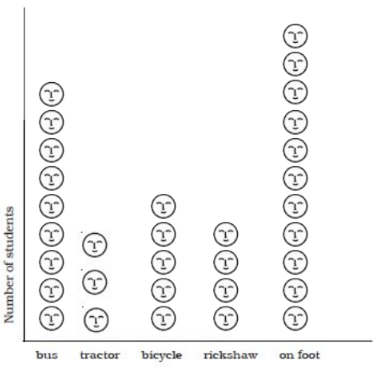
Page No. 188
Q.1. Fill in the blanks:
(a) The most students come to school by ____________.
(b) The number of students walking to school is ___________
(more/less) than the students coming on bicycle.
(c) The least students come to school by ___________.
So, isn’t this a smart chart! By simply looking at it we can know so much. Let us make more such charts.
Ans.
(a) The most students come to school by bus.
(b) The number of students walking to school is more than the students coming on bicycle
(c) The least students come to school by horse / wheel chair.
Q.2. Which bird has the most colours?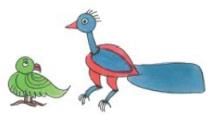 Ans: A peacock has more colours on its body than a parrot. Thus, the peacock has the most colours.
Ques 3: Which is the animal which is liked most as a pet?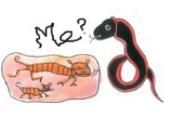 Ans. Cat is liked the most as a pet.
Page No. 189
Q.1. Which vegetable is most disliked? Ask your friends and complete the table.
| Vegetables disliked | Number of students |
| _____________ _____________ _____________ | ______________ ______________ ______________ |
Ans. The most disliked vegetable is brinjal.
| Vegetables disliked | Number of students |
| Brinjal Lady finger Cauliflower Spinach Potatoes Peas | 4 2 3 3 2 1 |
The answer may vary from student to student, based on his/her observation. It is highly recommended that the students prepare the answer on their own.
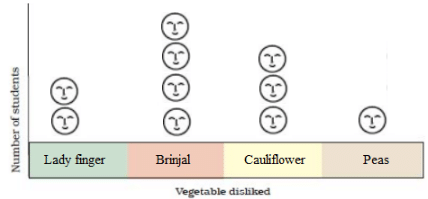
Q.2. Use this table to draw faces in the chart below. Draw  for each child on top of the vegetable disliked.
- The most disliked vegetable is__________.
- The vegetable disliked by very few children is__________.
 Ans.
Ans. - The most disliked vegetable is brinjal.
- The vegetable disliked by very few children is peas.
 The answer may vary from student to student, based on his/her observation. It is highly recommended that the students prepare the answer on their own.
|
40 videos|147 docs|55 tests
|
FAQs on NCERT Solutions for Class 3 Maths - Smart Charts
| 1. What is the purpose of using Smart Charts in education? |  |
| 2. How can Smart Charts help in improving students' learning experience? | |
| 3. Are there different types of Smart Charts available for educational purposes? | |
| 4. Can Smart Charts be used across different subjects and grade levels? | |
| 5. How can teachers integrate Smart Charts into their teaching strategies effectively? | |


MCQs
,Free
,video lectures
,NCERT Solutions for Class 3 Maths - Smart Charts
,practice quizzes
,NCERT Solutions for Class 3 Maths - Smart Charts
,Exam
,ppt
,study material
,Previous Year Questions with Solutions
,Summary
,Important questions
,Semester Notes
,Objective type Questions
,past year papers
,shortcuts and tricks
,Extra Questions
,Viva Questions
,NCERT Solutions for Class 3 Maths - Smart Charts
,Sample Paper
,mock tests for examination
;


NCERT Solutions - Smart Charts Free PDF Download
Importance of NCERT Solutions - Smart Charts
NCERT Solutions - Smart Charts Notes
NCERT Solutions - Smart Charts Class 3 Questions
Study NCERT Solutions - Smart Charts on the App
|
© EduRev
|
Education Revolution
|


|


