Class 3 Maths - Data Handling - CBSE Worksheets

Question 1: In a class of 27 students, absentees in a particular week were shown in the following table: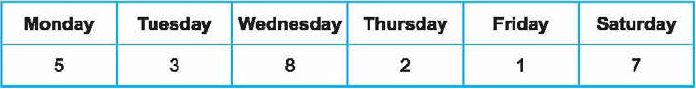 Represent the above information in the form of a pictograph.
Using the pictograph, answer the following questions:
- How many students were present on Monday?
- On which day maximum number of students were absent?
Question 2: The pictograph shows the favourite colours of the children of a class.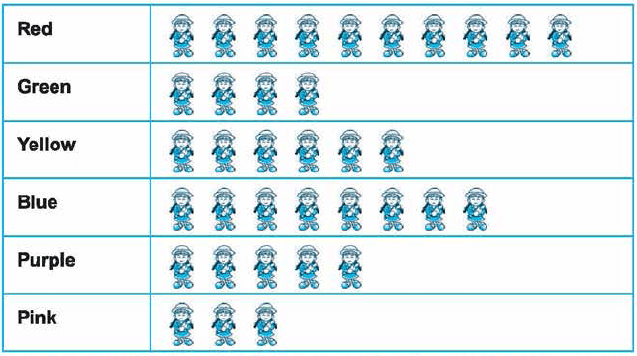 Observe the pictograph and answer the following questions:
- Which colour did the least number of children choose?
- Which colour did 5 children choose?
- How many children choose green?
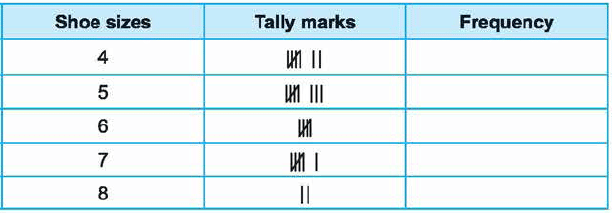
Question 3: Count and complete the following table: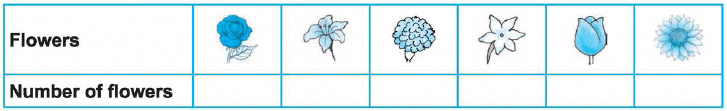
Question 4: The following pictograph shows the time taken by some children to finish their homework.
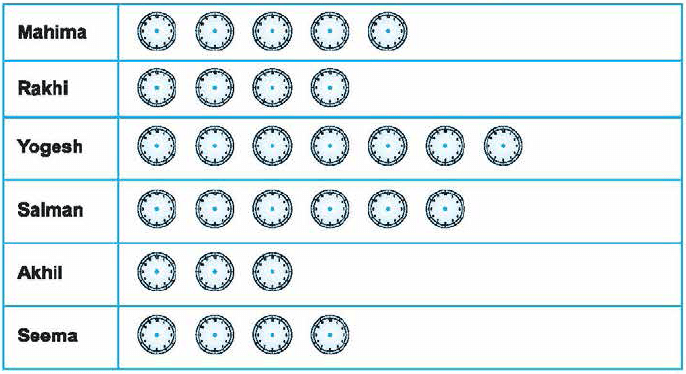 Answer the following questions:
- Who do you think is the cleverest child?
- Who took minimum time?
- Which two children take equal time?
Question 5: Children of class 3 were asked what pets they had. The pictograph below represents the information.
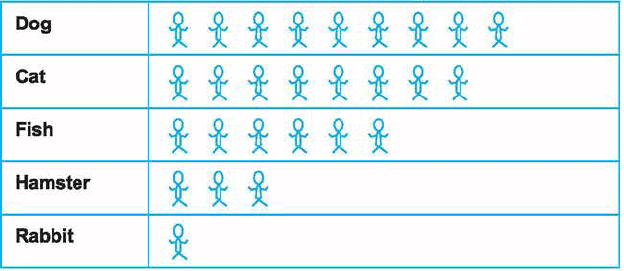 Now answer the following questions:
- How many children had fish?
- Which pet did the most number of children have?
- How many children had cat?
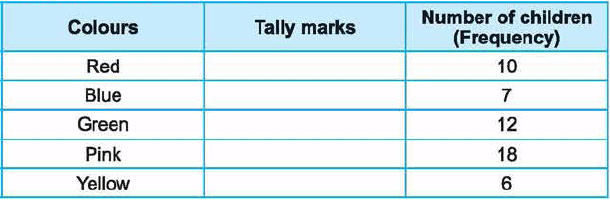
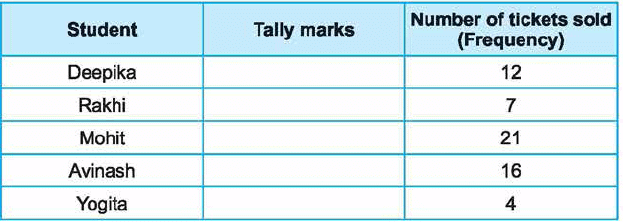
Question 6: Draw tally marks in each case:
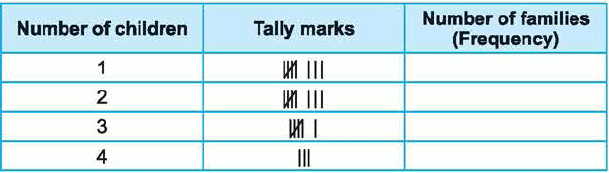
Question 7: Complete the following tally charts:
Question 8: After summer vacation, a survey was conducted to know the number of books read by 5 students of a class. The result of the survey is shown in the following pictograph.
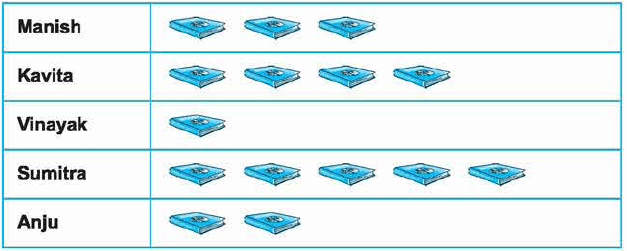 Observe the pictograph and answer the following questions:
- Do you think reading books is a good habit? ______
- Who read the minimum number of books? ______
- Who read the maximum number of books? ______
You can access the solutions to this worksheet here.
|
18 videos|120 docs|25 tests
|
FAQs on Class 3 Maths - Data Handling - CBSE Worksheets
| 1. What is data handling? |  |
| 2. Why is data handling important in the modern world? | |
| 3. What are the different methods of data collection? | |
| 4. How can data be organized for analysis? | |
| 5. What is data interpretation? | |


Free
,Extra Questions
,Sample Paper
,mock tests for examination
,Previous Year Questions with Solutions
,Important questions
,study material
,Objective type Questions
,Summary
,Class 3 Maths - Data Handling - CBSE Worksheets
,practice quizzes
,shortcuts and tricks
,Semester Notes
,Exam
,Class 3 Maths - Data Handling - CBSE Worksheets
,Viva Questions
,ppt
,video lectures
,MCQs
,Class 3 Maths - Data Handling - CBSE Worksheets
,past year papers
;


Worksheet: Data Handling Free PDF Download
Importance of Worksheet: Data Handling
Worksheet: Data Handling Notes
Worksheet: Data Handling Class 3 Questions
Study Worksheet: Data Handling on the App
|
© EduRev
|
Education Revolution
|


|


within 7 days!