


All Exams >
SSC MTS / SSC GD >
Quantitative Aptitude for Competitive Exams >
All Questions
All questions of Data Interpretation for SSC MTS / SSC GD Exam
Study the following line graph and answer the questions.Exports from Three Companies Over the Years (in Rs. crore)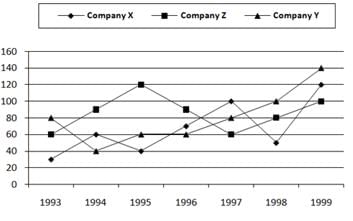 Q.
Q.
In how many of the given years, were the exports from Company Z more than the average annual exports over the given years?- a)2
- b)3
- c)4
- d)5
Correct answer is option 'C'. Can you explain this answer?
Study the following line graph and answer the questions.
Exports from Three Companies Over the Years (in Rs. crore)
Q.
In how many of the given years, were the exports from Company Z more than the average annual exports over the given years?
In how many of the given years, were the exports from Company Z more than the average annual exports over the given years?
a)
2
b)
3
c)
4
d)
5
|
|
Faizan Khan answered |
Average annual exports of Company Z during the given period
= 1/7 x (60 + 90 + 120 + 90 + 60 + 80 + 100)
= Rs. ( 600 /7)crores
= Rs. 85.71 crores.
From the analysis of graph the exports of Company Z are more than the average annual exports of Company Z (i.e., Rs. 85.71 crores) during the years 1994, 1995, 1996 and 1999, i.e., during 4 of the given years.
= 1/7 x (60 + 90 + 120 + 90 + 60 + 80 + 100)
= Rs. ( 600 /7)crores
= Rs. 85.71 crores.
From the analysis of graph the exports of Company Z are more than the average annual exports of Company Z (i.e., Rs. 85.71 crores) during the years 1994, 1995, 1996 and 1999, i.e., during 4 of the given years.

The following line graph gives the percent profit earned by two Companies X and Y during the period 1996 - 2001.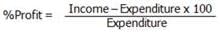 Percentage profit earned by Two Companies X and Y over the Given Years
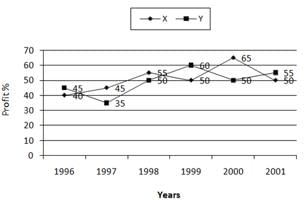 Q.
Q.
If the expenditure of Company Y in 1997 was Rs. 220 crores, what was its income in 1997?- a)Rs. 312 crores
- b)Rs. 297 crores
- c)Rs. 283 crores
- d)Rs. 275 crores
Correct answer is option 'B'. Can you explain this answer?
The following line graph gives the percent profit earned by two Companies X and Y during the period 1996 - 2001.
Percentage profit earned by Two Companies X and Y over the Given Years
Q.
If the expenditure of Company Y in 1997 was Rs. 220 crores, what was its income in 1997?
If the expenditure of Company Y in 1997 was Rs. 220 crores, what was its income in 1997?
a)
Rs. 312 crores
b)
Rs. 297 crores
c)
Rs. 283 crores
d)
Rs. 275 crores
|
|
Anaya Patel answered |
The correct anwer is B as profit percent of Company Y in 1997 = 35.
Let the income of Company Y in 1997 be Rs. x crores.
Then, 35 =
x - 220
x 100 x = 297.
220
 Income of Company Y in 1997
= Rs. 297 crores.
Let the income of Company Y in 1997 be Rs. x crores.
Then, 35 =
x - 220
x 100
220
= Rs. 297 crores.
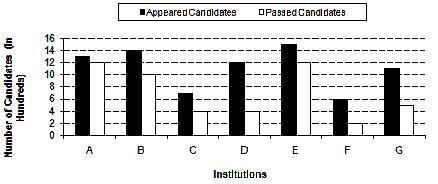
Study the following graph and answer the questions that follow.Number of Appeared Candidates and Passed Candidates (in hundreds) in a test from seven different Institutions Q. What is the difference between the number of candidates appeared from institutions B, C, D and F together and candidates passed from institutions A, E and G together?
- a)100
- b)900
- c)1000
- d)540
- e)None of these
Correct answer is option 'C'. Can you explain this answer?
Study the following graph and answer the questions that follow.
Number of Appeared Candidates and Passed Candidates (in hundreds) in a test from seven different Institutions
Q. What is the difference between the number of candidates appeared from institutions B, C, D and F together and candidates passed from institutions A, E and G together?
a)
100
b)
900
c)
1000
d)
540
e)
None of these
|
|
Nikita Singh answered |
Required difference:-
=> ( 14+7+12+6) -(12+12+5)
=> 39 - 29 = 10 hundred
=> 1000
The following pie-charts show the distribution of students of graduate and post-graduate levels in seven different institutes in a town.
Distribution of students at graduate and post-graduate levels in seven institutes:
Total number of students of graduate level = 27300 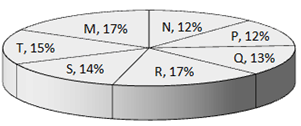 Total number of students of post – graduate level = 24700
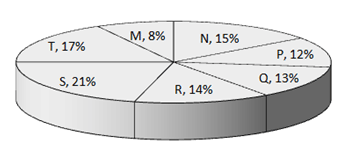 Q.What is the ratio between the number of students studying at post-graduate level from institutes S and the number of students studying at graduate level from institute Q?
- a)13 : 19
- b)21 : 13
- c)13 : 8
- d)19 : 13
Correct answer is option 'D'. Can you explain this answer?
The following pie-charts show the distribution of students of graduate and post-graduate levels in seven different institutes in a town.
Distribution of students at graduate and post-graduate levels in seven institutes:
Total number of students of graduate level = 27300
Distribution of students at graduate and post-graduate levels in seven institutes:
Total number of students of graduate level = 27300
Total number of students of post – graduate level = 24700
Q.
What is the ratio between the number of students studying at post-graduate level from institutes S and the number of students studying at graduate level from institute Q?
a)
13 : 19
b)
21 : 13
c)
13 : 8
d)
19 : 13
|
|
Dia Mehta answered |
The correct answer is D
as THE RATIO WIL BE
21% of 24700) / (13% of 27300)
=(21*247)/(13*273)
=(3*247)/(13*39)
=(3*19)/(1*39)
=19/13
Ratio = 19:13
as THE RATIO WIL BE
21% of 24700) / (13% of 27300)
=(21*247)/(13*273)
=(3*247)/(13*39)
=(3*19)/(1*39)
=19/13
Ratio = 19:13
The following line graph gives the percent profit earned by two Companies X and Y during the period 1996 - 2001.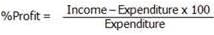 Percentage profit earned by Two Companies X and Y over the Given Years
 Q.
Q.
If the expenditures of Company X and Y in 1996 were equal and the total income of the two Companies in 1996 was Rs. 342 crores, what was the total profit of the two Companies together in 1996? (Profit = Income - Expenditure)- a)Rs. 240 crores
- b)Rs. 171 crores
- c)Rs. 120 crores
- d)Rs. 102 crores
Correct answer is option 'D'. Can you explain this answer?
The following line graph gives the percent profit earned by two Companies X and Y during the period 1996 - 2001.
Percentage profit earned by Two Companies X and Y over the Given Years
Q.
If the expenditures of Company X and Y in 1996 were equal and the total income of the two Companies in 1996 was Rs. 342 crores, what was the total profit of the two Companies together in 1996? (Profit = Income - Expenditure)
If the expenditures of Company X and Y in 1996 were equal and the total income of the two Companies in 1996 was Rs. 342 crores, what was the total profit of the two Companies together in 1996? (Profit = Income - Expenditure)
a)
Rs. 240 crores
b)
Rs. 171 crores
c)
Rs. 120 crores
d)
Rs. 102 crores
|
|
Roy Kunal Singh answered |
Simple,
Total Income = 342 cr
Income in percentage = 140+145=285%
Expenditure per year= 200×342/285 = 240 cr
So total profit in 1996 = 342 - 240 = 102 cr
Total Income = 342 cr
Income in percentage = 140+145=285%
Expenditure per year= 200×342/285 = 240 cr
So total profit in 1996 = 342 - 240 = 102 cr
(Q.no: 16-20). Refer to the following table and answer the given questions.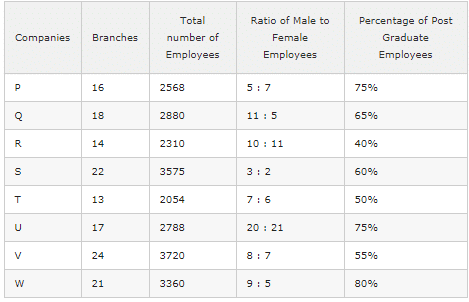 If the number of male post graduate employees in company W is 1488, what percent of the female employees in that particular company are post graduate?
- a)75%
- b) 100%
- c)74%
- d)73%
- e)72%
Correct answer is option 'B'. Can you explain this answer?
(Q.no: 16-20). Refer to the following table and answer the given questions.
If the number of male post graduate employees in company W is 1488, what percent of the female employees in that particular company are post graduate?
a)
75%
b)
100%
c)
74%
d)
73%
e)
72%
|
|
Preeti Khanna answered |
Number of Females in Company W = 3360 *(5/14) = 1200
Number of Post graduate employees in Company W = 3360 *(80/100) = 2688
Number of female post graduate employees in Company W = 2688 – 1488 = 1200
Required Percentage = (1200 * 100)/1200 = 100%
Number of Post graduate employees in Company W = 3360 *(80/100) = 2688
Number of female post graduate employees in Company W = 2688 – 1488 = 1200
Required Percentage = (1200 * 100)/1200 = 100%
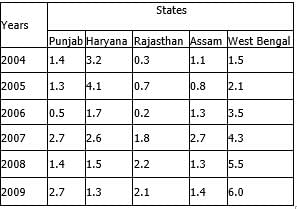
Study the following table carefully to answer the questions that follow.
Number of flights (in hundreds) cancelled in five different sates during six different years
 Q. What is the difference between the number of flights cancelled in Assam in the year 2007 and the total number of flights cancelled in Rajasthan in the year 2005, 2007 and 2008 together?
- a)200
- b)230
- c)210
- d)240
- e)None of these
Correct answer is option 'A'. Can you explain this answer?
Study the following table carefully to answer the questions that follow.
Number of flights (in hundreds) cancelled in five different sates during six different years
Number of flights (in hundreds) cancelled in five different sates during six different years
Q. What is the difference between the number of flights cancelled in Assam in the year 2007 and the total number of flights cancelled in Rajasthan in the year 2005, 2007 and 2008 together?
a)
200
b)
230
c)
210
d)
240
e)
None of these

|
Knowledge Center answered |
In Assam = 2.7
Rajasthan in the year 2005, 2007 and 2008 together = 0.7 + 1.8 + 2.2 = 4.7
so difference = 4.7 - 2.7 = 2
as in hundreds so 200
Rajasthan in the year 2005, 2007 and 2008 together = 0.7 + 1.8 + 2.2 = 4.7
so difference = 4.7 - 2.7 = 2
as in hundreds so 200
Study the following table carefully to answer the questions that follow:
Number of Students Appeared (A) and Failed (F) in Five
Classes of a school over the years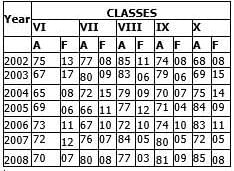 Q. What is the average number of failed students from Class VIII for the given years?
 - a)9
- b)7
- c)6
- d)8
- e)None of these
Correct answer is option 'D'. Can you explain this answer?
Study the following table carefully to answer the questions that follow:
Number of Students Appeared (A) and Failed (F) in Five
Classes of a school over the years
Number of Students Appeared (A) and Failed (F) in Five
Classes of a school over the years
Q. What is the average number of failed students from Class VIII for the given years?
a)
9
b)
7
c)
6
d)
8
e)
None of these
|
|
Knowledge Center answered |
To find the average number of failed students of Class 8th , we need to first add up the number of failed students
= 11+6+9+12+10+5+3= 56
Now total number of years = 7
Average = 56/7= 8
= 11+6+9+12+10+5+3= 56
Now total number of years = 7
Average = 56/7= 8
Study the following table carefully to answer the questions that follow.
Number of flights (in hundreds) cancelled in five different sates during six different years Q. What was the average number of flights cancelled in all the state together in the year 2008?
- a)278
- b)232
- c)238
- d)272
- e)None of these
Correct answer is option 'C'. Can you explain this answer?
Study the following table carefully to answer the questions that follow.
Number of flights (in hundreds) cancelled in five different sates during six different years
Number of flights (in hundreds) cancelled in five different sates during six different years
Q. What was the average number of flights cancelled in all the state together in the year 2008?
a)
278
b)
232
c)
238
d)
272
e)
None of these
|
|
Kunal Vats answered |
Average = 2008 total sum/5.
so, 1.4+1.5+2.2+1.3+5.5 = 11.9×100/5=238
so, 1.4+1.5+2.2+1.3+5.5 = 11.9×100/5=238
Study the following table carefully to answer the questions that follow:
Number of Students Appeared (A) and Failed (F) in Five
Classes of a school over the years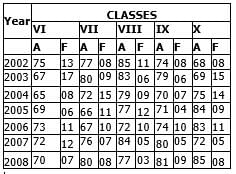 Q. What is the number of passed students for all the classes together in the year 2007?
 - a)358
- b)317
- c)350
- d)327
- e)None of these
Correct answer is option 'C'. Can you explain this answer?
Study the following table carefully to answer the questions that follow:
Number of Students Appeared (A) and Failed (F) in Five
Classes of a school over the years
Number of Students Appeared (A) and Failed (F) in Five
Classes of a school over the years
Q. What is the number of passed students for all the classes together in the year 2007?
a)
358
b)
317
c)
350
d)
327
e)
None of these
|
|
Prity Biswas answered |
VI=72-12=60
VII=76-7=69
VIII=84-5=79
IX=80-5=75
X=72-5=67
TOTAL = 60+69+79+75+67=350(C)
VII=76-7=69
VIII=84-5=79
IX=80-5=75
X=72-5=67
TOTAL = 60+69+79+75+67=350(C)
Study the following graph and answer the questions that follow.
Number of Appeared Candidates and Passed Candidates (in hundreds) in a test from seven different Institutions
Q. What is the ratio of the number of candidates who have failed Institution B to the number of candidates who have appeared from institution F?- a)2: 5
- b)2: 3
- c)4: 3
- d)1: 3
- e)None of these
Correct answer is option 'B'. Can you explain this answer?
Study the following graph and answer the questions that follow.
Number of Appeared Candidates and Passed Candidates (in hundreds) in a test from seven different Institutions
Number of Appeared Candidates and Passed Candidates (in hundreds) in a test from seven different Institutions
Q. What is the ratio of the number of candidates who have failed Institution B to the number of candidates who have appeared from institution F?
a)
2: 5
b)
2: 3
c)
4: 3
d)
1: 3
e)
None of these

|
Tusharvyas Tusharvyas answered |
From B 1400 appeared and 1000 passed it means 400 failed and from F 600 appeared so
400:600 makes 2:3
400:600 makes 2:3
Study the following graph carefully and answer the question.
Water level of four major Rivers (in metres) in four different Months
Water level of four Rivers Q. What is the average water level of River –A in all the four months together?
 - a)224.50 m
- b)212.25 m
- c)210.75 m
- d)222.25 m
- e)None of these
Correct answer is option 'C'. Can you explain this answer?
Study the following graph carefully and answer the question.
Water level of four major Rivers (in metres) in four different Months
Water level of four Rivers
Water level of four major Rivers (in metres) in four different Months
Water level of four Rivers
Q. What is the average water level of River –A in all the four months together?
a)
224.50 m
b)
212.25 m
c)
210.75 m
d)
222.25 m
e)
None of these

|
Shanaya Sharma answered |
Average water level of river A = (196+205+230+212)/4 = 210.75 m
(Q.no: 1-5). Refer to the following Line Graph and answer the given questions.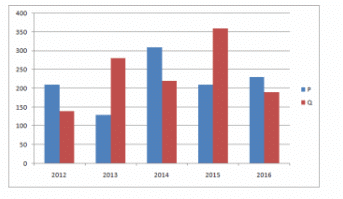
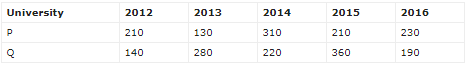 Number of applications received for University Q increased by what percent from 2012 to 2014?
- a)100/7%
- b)200/7%
- c)300/7%
- d)400/7%
- e)None of the
Correct answer is option 'D'. Can you explain this answer?
(Q.no: 1-5). Refer to the following Line Graph and answer the given questions.
Number of applications received for University Q increased by what percent from 2012 to 2014?
a)
100/7%
b)
200/7%
c)
300/7%
d)
400/7%
e)
None of the
|
|
Aisha Gupta answered |
% = (220-140)/140 * 100 = 400/7 %

Study the following graph and answer the questions that follow.
Number of Appeared Candidates and Passed Candidates (in hundreds) in a test from seven different Institutions
 Q. What is the average number of candidates passed from all the institutions together?
- a)700
- b)490
- c)350
- d)675
- e)None of these
Correct answer is option 'A'. Can you explain this answer?
Study the following graph and answer the questions that follow.
Number of Appeared Candidates and Passed Candidates (in hundreds) in a test from seven different Institutions
Number of Appeared Candidates and Passed Candidates (in hundreds) in a test from seven different Institutions
Q. What is the average number of candidates passed from all the institutions together?
a)
700
b)
490
c)
350
d)
675
e)
None of these
|
|
Gopu Gajpal answered |
(1200+1000+400+400+1200+200+500)/7=700
The following line graph gives the percent profit earned by two Companies X and Y during the period 1996 - 2001. Percentage profit earned by Two Companies X and Y over the Given Years
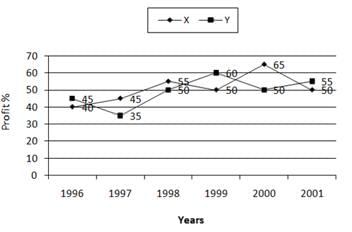 Q.
Q.
If the incomes of two Companies were equal in 1999, then what was the ratio of expenditure of Company X to that of Company Y in 1999 ?- a)6:5
- b)5:6
- c)11:6
- d)16:15
Correct answer is option 'D'. Can you explain this answer?
The following line graph gives the percent profit earned by two Companies X and Y during the period 1996 - 2001.
Percentage profit earned by Two Companies X and Y over the Given Years
Q.
If the incomes of two Companies were equal in 1999, then what was the ratio of expenditure of Company X to that of Company Y in 1999 ?
If the incomes of two Companies were equal in 1999, then what was the ratio of expenditure of Company X to that of Company Y in 1999 ?
a)
6:5
b)
5:6
c)
11:6
d)
16:15
|
|
Anaya Patel answered |
The correct answer is D
In 1999 , profit % of X = 50
profit% of Y = 60
Also , let their income in 1999 be i each and expenditure of X be x and that of Y be y.
For X ,
50 = (i - x)*100/x
1/2 = (i - x)/x
x/2 = i - x
i = 3x/2 (eq1)
For Y ,
60 = (i - y)*100/y
3/5 = (i - y)/y
3y/5 = i - y
i = 8y/5(eq 2)
Equating eq 1and 2 , we get
3x/2 = 8y/5
x/y = 16/15
x : y = 16:15
Study the following line graph and answer the questions based on it.Number of Vehicles Manufactured by Two companies over the Years (Number in Thousands)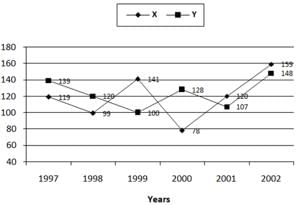 Q.
Q.
What is the average numbers of vehicles manufactured by Company X over the given period? (rounded off to nearest integer)- a)119333
- b)113666
- c)112778
- d)111223
Correct answer is option 'A'. Can you explain this answer?
Study the following line graph and answer the questions based on it.
Number of Vehicles Manufactured by Two companies over the Years (Number in Thousands)
Q.
What is the average numbers of vehicles manufactured by Company X over the given period? (rounded off to nearest integer)
What is the average numbers of vehicles manufactured by Company X over the given period? (rounded off to nearest integer)
a)
119333
b)
113666
c)
112778
d)
111223

|
Kumaran Raja answered |
AVERAGE NUMBER OF VEHICLES MANUFACTURED BY COMPANY (x).《NOTE》TAKE NUMBERS IN THOUSANDS. 119000+99000+141000+78000+120000+159000 = =716000 then,take average=716000/6.we get,119333.3333 so,rounding off:119333.ANSWER::OPTION (A).
The following line graph gives the percent profit earned by two Companies X and Y during the period 1996 - 2001. Percentage profit earned by Two Companies X and Y over the Given Years
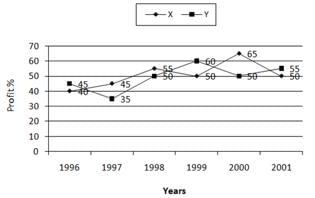 Q.
Q.
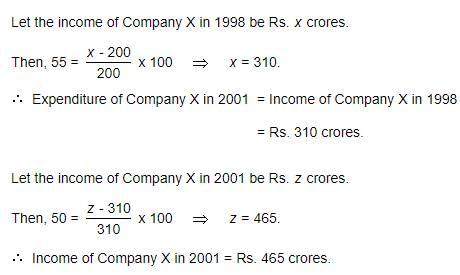
The expenditure of Company X in the year 1998 was Rs. 200 crores and the income of company X in 1998 was the same as its expenditure in 2001. The income of Company X in 2001 was ?- a) Rs. 295 crores
- b)Rs. 385 crores
- c)Rs. 335 crores
- d)Rs. 465 crores
Correct answer is option 'D'. Can you explain this answer?
The following line graph gives the percent profit earned by two Companies X and Y during the period 1996 - 2001.
Percentage profit earned by Two Companies X and Y over the Given Years
Q.
The expenditure of Company X in the year 1998 was Rs. 200 crores and the income of company X in 1998 was the same as its expenditure in 2001. The income of Company X in 2001 was ?
The expenditure of Company X in the year 1998 was Rs. 200 crores and the income of company X in 1998 was the same as its expenditure in 2001. The income of Company X in 2001 was ?
a)
Rs. 295 crores
b)
Rs. 385 crores
c)
Rs. 335 crores
d)
Rs. 465 crores
|
|
Aisha Gupta answered |
The following line graph gives the percent profit earned by two Companies X and Y during the period 1996 - 2001. Percentage profit earned by Two Companies X and Y over the Given Years
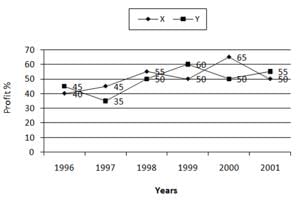 Q.
Q.
The incomes of two Companies X and Y in 2000 were in the ratio of 3:4 respectively. What was the respective ratio of their expenditures in 2000?- a)7:22
- b)14:19
- c)15:22
- d)27:35
Correct answer is option 'C'. Can you explain this answer?
The following line graph gives the percent profit earned by two Companies X and Y during the period 1996 - 2001.
Percentage profit earned by Two Companies X and Y over the Given Years
Q.
The incomes of two Companies X and Y in 2000 were in the ratio of 3:4 respectively. What was the respective ratio of their expenditures in 2000?
The incomes of two Companies X and Y in 2000 were in the ratio of 3:4 respectively. What was the respective ratio of their expenditures in 2000?
a)
7:22
b)
14:19
c)
15:22
d)
27:35
|
|
Dia Mehta answered |
The correct answer is C
Let the incomes in 2000 of Companies X and Y be 3x and 4x respectively.
And let the expenditures in 2000 of Companies X and Y be E1 and E2 respectively.
Then, for Company X we have:
65 =[( 3x - E1 )/E1]×100 =>65/100 = (3x/E1) - 1
=> E1 = 3x×( 100/165 ) .... (i)
For Company Y we have:
50 = [(4x - E2 )/E2]x 100 =>50/100= (4x/E1) - 1 => E2 = 4x×( 100/150 ) .... (ii)
From (i) and (ii), we get:
E1/E2=[3x ×(100/165)]/[4x×(100/150)]
E1/E2=15/22 (required ratio)
(Q.no: 6-10). Refer to the following Line Graph and answer the given questions.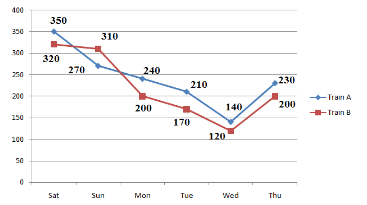 The number of people who traveled by Train A decreased by what percent from Saturday to Wednesday?
- a)30%
- b)60%
- c)40%
- d)42%
- e)33%
Correct answer is option 'B'. Can you explain this answer?
(Q.no: 6-10). Refer to the following Line Graph and answer the given questions.
The number of people who traveled by Train A decreased by what percent from Saturday to Wednesday?
a)
30%
b)
60%
c)
40%
d)
42%
e)
33%
|
|
Rhea Reddy answered |
[(350 – 140)/350]*100
= [210/350]*100 = 60%
= [210/350]*100 = 60%
Study the following table carefully to answer the questions that follow.Number of flights (in hundreds) cancelled in five different sates during six different years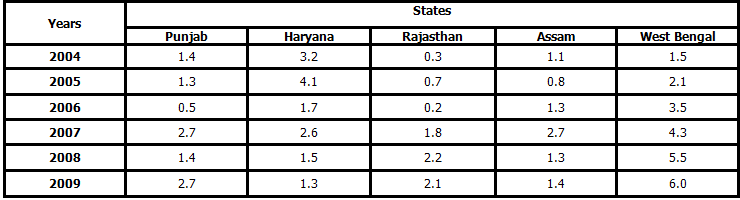 Q. Number of flights cancelled in Haryana in the year 2004 was what percent of the total number of flights cancelled in Punjab over all the years together?
 - a)12
- b)32
- c)36
- d)24
- e)None of these
Correct answer is option 'B'. Can you explain this answer?
Study the following table carefully to answer the questions that follow.
Number of flights (in hundreds) cancelled in five different sates during six different years
Q. Number of flights cancelled in Haryana in the year 2004 was what percent of the total number of flights cancelled in Punjab over all the years together?
a)
12
b)
32
c)
36
d)
24
e)
None of these

|
Richa Shukla answered |
Flights cancelled in haryana in 2004 are 320 and that in punjab over all the years together are 1000.
so 320÷1000×100=32%
so 320÷1000×100=32%
Study the following graph carefully to answer the given questionsDown Stream Distance = 200 km Up Stream Distance = 300 km
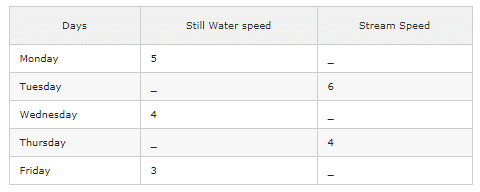 A boatman rows down stream at 6kmph on Wednesday. Find the time taken by the boat to cover upsream distance on the same day?
- a)50
- b)40
- c)20
- d)36
- e)None of these
Correct answer is option 'D'. Can you explain this answer?
Study the following graph carefully to answer the given questions
Down Stream Distance = 200 km Up Stream Distance = 300 km
A boatman rows down stream at 6kmph on Wednesday. Find the time taken by the boat to cover upsream distance on the same day?
a)
50
b)
40
c)
20
d)
36
e)
None of these
|
|
Faizan Khan answered |
Downstream Speed = 6kmph
Upstream Speed = 8kmph – 6kmph = 2kmph
Time taken by the boat to cover upstream distance = 72/2 = 36 hours
Upstream Speed = 8kmph – 6kmph = 2kmph
Time taken by the boat to cover upstream distance = 72/2 = 36 hours
Study the following graph carefully and answer the following questions given below.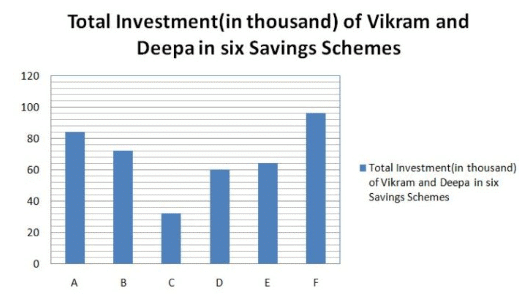
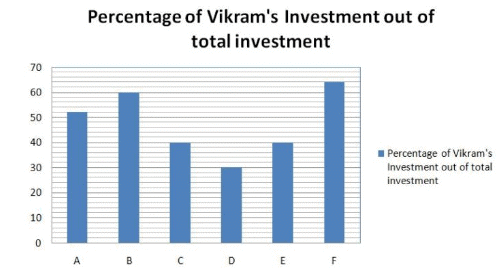 What is the sum of the average amount invested in Savings schemes A, D and E by Vikram and the average amount invested in Savings schemes B, C and F by Deepa?
- a)54272
- b)57614
- c)54600
- d)56613
- e)57514
Correct answer is option 'D'. Can you explain this answer?
Study the following graph carefully and answer the following questions given below.
What is the sum of the average amount invested in Savings schemes A, D and E by Vikram and the average amount invested in Savings schemes B, C and F by Deepa?
a)
54272
b)
57614
c)
54600
d)
56613
e)
57514
|
|
Preeti Khanna answered |
Average amount invested in schemes A, D and E by Vikram = (43680 + 18000 + 25600)/3 = 87280/3 = 29093
Average amount invested in schemes B, C and F by Deepa = (28800 + 19200 + 34560)/3 = 82560/3 = 27520
Sum = 29093 + 27520 = 56613
Average amount invested in schemes B, C and F by Deepa = (28800 + 19200 + 34560)/3 = 82560/3 = 27520
Sum = 29093 + 27520 = 56613
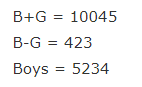
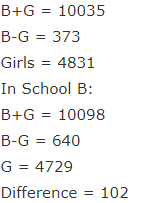
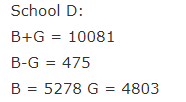
Study the following graph carefully and answer the following questions given below.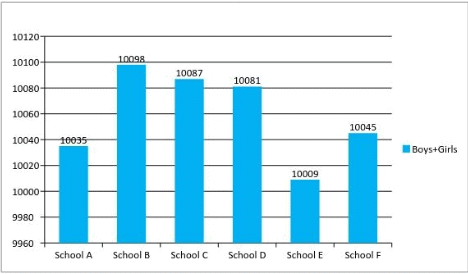
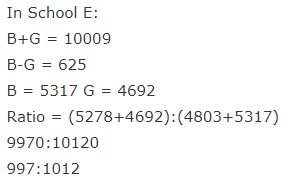
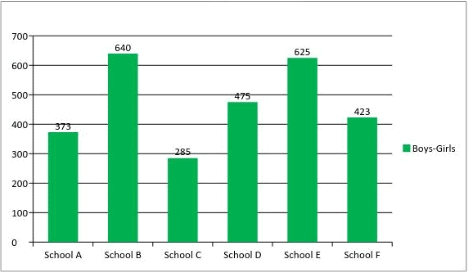 What is the ratio of Sum of Boys in School D and Girls in School E together to the Sum of Girls in School D and Boys in School E together is?
- a)997:1012
- b)999:1012
- c)1000:1011
- d)1000:1013
- e)None
Correct answer is option 'A'. Can you explain this answer?
Study the following graph carefully and answer the following questions given below.
What is the ratio of Sum of Boys in School D and Girls in School E together to the Sum of Girls in School D and Boys in School E together is?
a)
997:1012
b)
999:1012
c)
1000:1011
d)
1000:1013
e)
None
|
|
Ravi Singh answered |
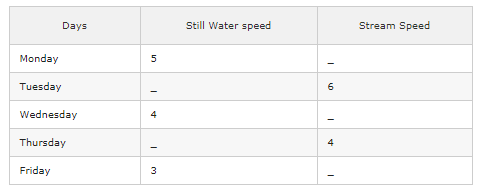
Study the following graph carefully to answer the given questionsDown Stream Distance = 200 km Up Stream Distance = 300 kmA boatman rows up stream at 16 kmph and 2 kmph on Tuesday and Friday. Then find the difference between the down stream speed of boat on Tuesday and Friday together and the speed of boat in still water on the same days together?- a)7 kmph
- b)11 kmph
- c)5 kmph
- d)3 kmph
- e)None of these
Correct answer is option 'A'. Can you explain this answer?
Study the following graph carefully to answer the given questions
Down Stream Distance = 200 km Up Stream Distance = 300 km
A boatman rows up stream at 16 kmph and 2 kmph on Tuesday and Friday. Then find the difference between the down stream speed of boat on Tuesday and Friday together and the speed of boat in still water on the same days together?
a)
7 kmph
b)
11 kmph
c)
5 kmph
d)
3 kmph
e)
None of these
|
|
Anaya Patel answered |
down stream speed of boat on Tuesday and Friday = 32 kmph
Still water speed = 25 kmph
Difference = 32 – 25 = 7 kmph
Still water speed = 25 kmph
Difference = 32 – 25 = 7 kmph
Study the following graph and answer the questions that follow.
Number of Appeared Candidates and Passed Candidates (in hundreds) in a test from seven different Institutions
 Q. From which institution is the difference between the appeared candidates and passed candidates the maximum?
- a)B
- b)G
- c)D
- d)F
- e)None of these
Correct answer is option 'C'. Can you explain this answer?
Study the following graph and answer the questions that follow.
Number of Appeared Candidates and Passed Candidates (in hundreds) in a test from seven different Institutions
Number of Appeared Candidates and Passed Candidates (in hundreds) in a test from seven different Institutions
Q. From which institution is the difference between the appeared candidates and passed candidates the maximum?
a)
B
b)
G
c)
D
d)
F
e)
None of these
|
|
Ankit Kumar answered |
D have appeared candidate 1200 and passed candidate only 400 so their huge distance from another
Study the graph and answer the questions that follow:
No. of candidates (in thousands) different Qualified in the written test for admission to two different institutions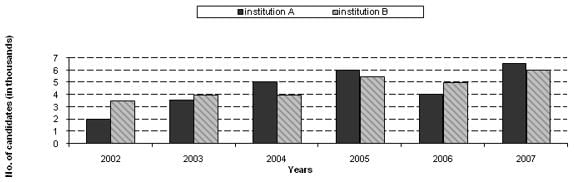 Q. What was the ratio of the number of candidates qualified in the written test in the year 2002 for admission to institution B to the number of candidates qualified in the written test in the year 2006 for admission to institution A?
- a)8 : 5
- b)7 : 4
- c)7 : 8
- d)7 : 5
- e)8 : 7
Correct answer is option 'C'. Can you explain this answer?
Study the graph and answer the questions that follow:
No. of candidates (in thousands) different Qualified in the written test for admission to two different institutions
No. of candidates (in thousands) different Qualified in the written test for admission to two different institutions
Q. What was the ratio of the number of candidates qualified in the written test in the year 2002 for admission to institution B to the number of candidates qualified in the written test in the year 2006 for admission to institution A?
a)
8 : 5
b)
7 : 4
c)
7 : 8
d)
7 : 5
e)
8 : 7
|
|
Prakhya Shrivastava answered |
Candidates qualified by institution B in 2002 by graph let X = 3.5×1000= 3500
Candidates qualified by institution A in 2006 by graph let Y = 4×1000 = 4000
Rati of X&Y = X:Y = 3500:4000 = 7:8
Hence option 'C' is correct
Candidates qualified by institution A in 2006 by graph let Y = 4×1000 = 4000
Rati of X&Y = X:Y = 3500:4000 = 7:8
Hence option 'C' is correct
Study the following graph carefully to answer the given questionsDown Stream Distance = 200 km Up Stream Distance = 300 km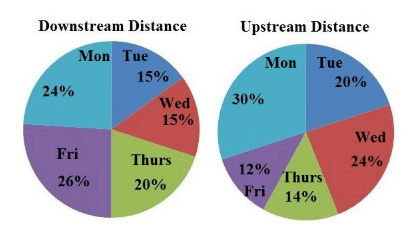
 A boatman rows down stream at 6kmph on Wednesday. Find the speed of upstream and Speed of current?
- a)7 kmph
- b)2 kmph
- c)3 kmph
- d)5 kmph
- e)None of these
Correct answer is option 'B'. Can you explain this answer?
Study the following graph carefully to answer the given questions
Down Stream Distance = 200 km Up Stream Distance = 300 km
A boatman rows down stream at 6kmph on Wednesday. Find the speed of upstream and Speed of current?
a)
7 kmph
b)
2 kmph
c)
3 kmph
d)
5 kmph
e)
None of these
|
|
Aisha Gupta answered |
Downstream Speed = 6kmph
Upstream Speed = 8kmph – 6kmph = 2kmph
Speed of Current = (6-2)/2 = 2kmph
Upstream Speed = 8kmph – 6kmph = 2kmph
Speed of Current = (6-2)/2 = 2kmph
(Q.no: 15-20). Refer to the table and answer the given questions.
Total Population in Five Cities = 15,00,000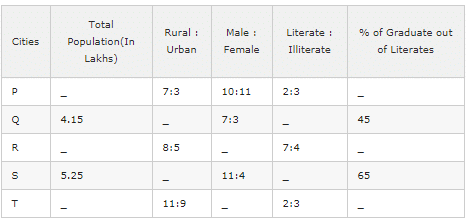 The difference between the total population of City R and T is 30,000. The ratio of total population of City R and T is 44:41. Total % of Literate graduates of City R and T is 90%. If the % Literate graduates of City T is equalled to two times of Literate graduates of City R then what is the difference between the number of graduates from City R and City T?
- a)13800
- b)12600
- c)14400
- d)15800
- e)12400
Correct answer is option 'C'. Can you explain this answer?
(Q.no: 15-20). Refer to the table and answer the given questions.
Total Population in Five Cities = 15,00,000
Total Population in Five Cities = 15,00,000
The difference between the total population of City R and T is 30,000. The ratio of total population of City R and T is 44:41. Total % of Literate graduates of City R and T is 90%. If the % Literate graduates of City T is equalled to two times of Literate graduates of City R then what is the difference between the number of graduates from City R and City T?
a)
13800
b)
12600
c)
14400
d)
15800
e)
12400
|
|
Preeti Khanna answered |
3/85 * x = 30000 => x = 850000
44/85*850000 = 440000 = City R Population
7/11*440000 = 280000
Number of graduates from City R = 30% of 280000 = 84000
41/85*85000 = 410000 = City T Population
2/5*410000 = 164000
Number of graduates from City T = 60% of 1,64,000 = 98400
Difference = 14400
44/85*850000 = 440000 = City R Population
7/11*440000 = 280000
Number of graduates from City R = 30% of 280000 = 84000
41/85*85000 = 410000 = City T Population
2/5*410000 = 164000
Number of graduates from City T = 60% of 1,64,000 = 98400
Difference = 14400
The following pie-charts show the distribution of students of graduate and post-graduate levels in seven different institutes in a town.Distribution of students at graduate and post-graduate levels in seven institutes:Total number of students of graduate level = 27300 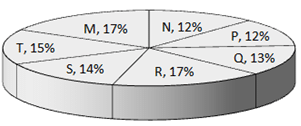 Total number of students of post – graduate level = 24700
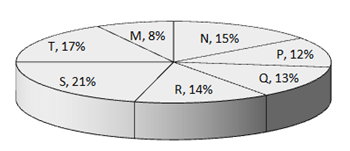 Q.What is the total number of graduate and post-graduate level students in institute R?
- a)8320
- b)7916
- c)9116
- d)8099
Correct answer is option 'D'. Can you explain this answer?
The following pie-charts show the distribution of students of graduate and post-graduate levels in seven different institutes in a town.
Distribution of students at graduate and post-graduate levels in seven institutes:
Total number of students of graduate level = 27300
Total number of students of post – graduate level = 24700
Q.
What is the total number of graduate and post-graduate level students in institute R?
a)
8320
b)
7916
c)
9116
d)
8099
|
|
Prity Biswas answered |
Graduate =17% =17/100×27300=4641
post graduate =14% =14/100×24700=3458
therefore ,
4641
+3458
=8099
(D)
post graduate =14% =14/100×24700=3458
therefore ,
4641
+3458
=8099
(D)
Study the following table carefully to answer the questions that follow:
Number of Students Appeared (A) and Failed (F) in Five
Classes of a school over the years
 Q. What is the total percentage of passed students of Class IX from all the years together? (rounded off to two digits after decimal)
- a)68.95
- b)71.36
- c)79.53
- d)86.94
- e)91.52
Correct answer is option 'E'. Can you explain this answer?
Study the following table carefully to answer the questions that follow:
Number of Students Appeared (A) and Failed (F) in Five
Classes of a school over the years
Number of Students Appeared (A) and Failed (F) in Five
Classes of a school over the years
Q. What is the total percentage of passed students of Class IX from all the years together? (rounded off to two digits after decimal)
a)
68.95
b)
71.36
c)
79.53
d)
86.94
e)
91.52
|
|
Knowledge Center answered |
no of student who passed in 9 th class exam = 74 +79+70+71+74+80+81=529
total no of students=passed + fail =529 +8+6+7+4+10+5+9=578
so passing percentage=529/578=91.52
total no of students=passed + fail =529 +8+6+7+4+10+5+9=578
so passing percentage=529/578=91.52
Study the following graph carefully to answer the given questionsTime taken by the pipes to fill a tank/cistern (hours/minutes)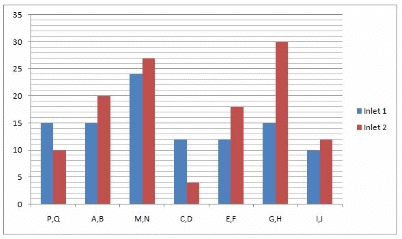 A large cistern can be filled by two pipes P and Q. How many minutes will it take to fill the Cistern from an empty state if Q is used for half the time and P and Q fill it together for the other half?
- a)6.5 minutes
- b)7.5 minutes
- c)8.5 minutes
- d)9.5 minutes
- e)None of the Above
Correct answer is option 'B'. Can you explain this answer?
Study the following graph carefully to answer the given questions
Time taken by the pipes to fill a tank/cistern (hours/minutes)
A large cistern can be filled by two pipes P and Q. How many minutes will it take to fill the Cistern from an empty state if Q is used for half the time and P and Q fill it together for the other half?
a)
6.5 minutes
b)
7.5 minutes
c)
8.5 minutes
d)
9.5 minutes
e)
None of the Above
|
|
Anaya Patel answered |
Part filled by P and Q = 1/15 + 1/10 = 1/6
Part filled by Q = 1/10
x/2(1/6 + 1/10) = 2/15 = 15/2 = 7.5 minutes
Part filled by Q = 1/10
x/2(1/6 + 1/10) = 2/15 = 15/2 = 7.5 minutes
(Q.no: 1-5). Refer to the following Line Graph and answer the given questions.In 2013, out of the total number of applications received for Universities P and Q together, only 30% were accepted. What was the total number of applications accepted for Universities P and Q together in 2013?- a)132
- b)135
- c)141
- d) 123
- e)None of the Above
Correct answer is option 'D'. Can you explain this answer?
(Q.no: 1-5). Refer to the following Line Graph and answer the given questions.
In 2013, out of the total number of applications received for Universities P and Q together, only 30% were accepted. What was the total number of applications accepted for Universities P and Q together in 2013?
a)
132
b)
135
c)
141
d)
123
e)
None of the Above

|
Dr. Rudresh S.a answered |
130+280=410.
30% of 410 is 123
(I.e.,30÷100×410)
30% of 410 is 123
(I.e.,30÷100×410)
Study the following table carefully to answer the questions that follow.
Number of flights (in hundreds) cancelled in five different sates during six different years
 Q. What was the respective ratio between the number of flights cancelled in Rajasthan in the year 2006 and number of flights cancelled in West Bengal in the year 2009?
- a)1 : 6
- b)15:2
- c)1 : 30
- d)30 : 7
- e)None of these
Correct answer is option 'C'. Can you explain this answer?
Study the following table carefully to answer the questions that follow.
Number of flights (in hundreds) cancelled in five different sates during six different years
Number of flights (in hundreds) cancelled in five different sates during six different years
Q. What was the respective ratio between the number of flights cancelled in Rajasthan in the year 2006 and number of flights cancelled in West Bengal in the year 2009?
a)
1 : 6
b)
15:2
c)
1 : 30
d)
30 : 7
e)
None of these
|
|
Sajal Bdw answered |
Required ratio =0.2/6
=2/60
=1/30 ANS
=2/60
=1/30 ANS
Study the following graph carefully and answer the following questions given below.What is the average amount invested by Vikram in savings schemes A,B,C,D and E together?- a)Rs. 29,248/-
- b)Rs. 30,562/-
- c)Rs. 31,126/-
- d)Rs. 29,688/-
- e)Rs. 28,656/-
Correct answer is option 'E'. Can you explain this answer?
Study the following graph carefully and answer the following questions given below.
What is the average amount invested by Vikram in savings schemes A,B,C,D and E together?
a)
Rs. 29,248/-
b)
Rs. 30,562/-
c)
Rs. 31,126/-
d)
Rs. 29,688/-
e)
Rs. 28,656/-
|
|
Anaya Patel answered |

Study the following graph carefully to answer the given questions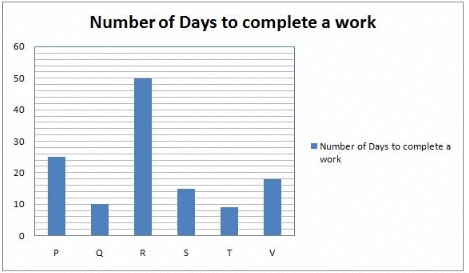 A is twice efficient as B and together they do the same work in as much time as T and V together. In how many days A can complete the work individually?
- a)5 days
- b)8 days
- c)4 days
- d)9 days
- e)None of these
Correct answer is option 'D'. Can you explain this answer?
Study the following graph carefully to answer the given questions
A is twice efficient as B and together they do the same work in as much time as T and V together. In how many days A can complete the work individually?
a)
5 days
b)
8 days
c)
4 days
d)
9 days
e)
None of these
|
|
Preeti Khanna answered |
1/x + 1/2x = 1/9 + 1/18
3/2x = 3/18
Number of days taken by A = 9 days
3/2x = 3/18
Number of days taken by A = 9 days
Study the following graph carefully to answer the given questions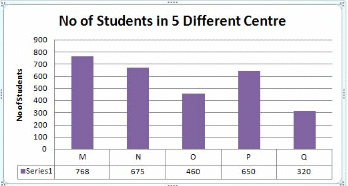
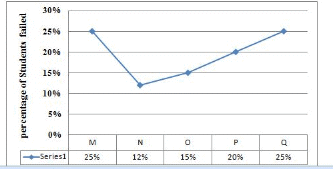 What will be the ratio of number of boys passed in N to number of girls failed in N, if the number of girls and boys in the ratio 16:11 ?
- a)121:24
- b)7:11
- c)103:529
- d)21:37
- e)None of these
Correct answer is option 'A'. Can you explain this answer?
Study the following graph carefully to answer the given questions
What will be the ratio of number of boys passed in N to number of girls failed in N, if the number of girls and boys in the ratio 16:11 ?
a)
121:24
b)
7:11
c)
103:529
d)
21:37
e)
None of these
|
|
Preeti Khanna answered |
675 => 400:275 => 16:11 = G:B
G:400*12% =48
B:275*88% =242
242:48 = 121: 24
G:400*12% =48
B:275*88% =242
242:48 = 121: 24
Study the following graph carefully to answer the given questionsDown Stream Distance = 200 km Up Stream Distance = 300 kmTotal downstream distance travelled by boat on Monday, Tuesday and Wednesday together is what percentage of total upstream distance travelled by boat on the same days together?- a)48.6%
- b)46.7%
- c)48.5%
- d)47.5%
- e)None of these
Correct answer is option 'A'. Can you explain this answer?
Study the following graph carefully to answer the given questions
Down Stream Distance = 200 km Up Stream Distance = 300 km
Total downstream distance travelled by boat on Monday, Tuesday and Wednesday together is what percentage of total upstream distance travelled by boat on the same days together?
a)
48.6%
b)
46.7%
c)
48.5%
d)
47.5%
e)
None of these
|
|
Faizan Khan answered |
Total downstream distance travelled by boat on Monday, Tuesday and Wednesday = 108
Total up stream distance travelled by boat on Monday, Tuesday and Wednesday = 222
% = 108/222 * 100 = 48.6%
Total up stream distance travelled by boat on Monday, Tuesday and Wednesday = 222
% = 108/222 * 100 = 48.6%
Study the graph and answer the questions that follow:
No. of candidates (in thousands) different Qualified in the written test for admission to two different institutionsWhat is the difference between the total number of candidates qualified in written test in year 2006 for admission to institution A and B together and the number of candidates qualified in written test in year 2003 for admission to institution A ?- a)3,500
- b) 5,500
- c)1,500
- d)5,000
- e)None of these
Correct answer is option 'B'. Can you explain this answer?
Study the graph and answer the questions that follow:
No. of candidates (in thousands) different Qualified in the written test for admission to two different institutions
No. of candidates (in thousands) different Qualified in the written test for admission to two different institutions
What is the difference between the total number of candidates qualified in written test in year 2006 for admission to institution A and B together and the number of candidates qualified in written test in year 2003 for admission to institution A ?
a)
3,500
b)
5,500
c)
1,500
d)
5,000
e)
None of these
|
|
Rajeev Kumar answered |
Required difference
= [(4+5) - 3.5] thousand
= 5500
Study the following graph carefully and answer the following questions given below.What is the difference between the average amount invested in Savings schemes A, B, D and E by Vikram and the average amount invested in Savings schemes B, C, E and F by Deepa?- a)2540
- b)2760
- c)2560
- d)2320
- e)2380
Correct answer is option 'E'. Can you explain this answer?
Study the following graph carefully and answer the following questions given below.
What is the difference between the average amount invested in Savings schemes A, B, D and E by Vikram and the average amount invested in Savings schemes B, C, E and F by Deepa?
a)
2540
b)
2760
c)
2560
d)
2320
e)
2380
|
|
Preeti Khanna answered |
Average amount invested in schemes A, B, D and E by Vikram = (43680 + 43200 + 18000 + 25600)/4 = 90240/4 = 32620
Average amount invested in schemes B, C, E and F by Deepa = (28800 + 19200 + 38400 + 34560)/4 = 119680/4 = 30240
Difference = 32620 – 30240 = 2380
Average amount invested in schemes B, C, E and F by Deepa = (28800 + 19200 + 38400 + 34560)/4 = 119680/4 = 30240
Difference = 32620 – 30240 = 2380
Study the following table carefully and answer the questions given follow:
Monthly expenditure (in thousands) by five people on Rent, Food, Children’s education, Clothes and Traveling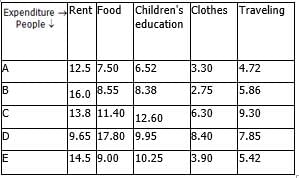 Q. What is the total monthly expenditure made by D on rent, B on clothes and E on traveling together?
- a)Rs. 18, 720
- b)Rs. 1,78,200
- c)Rs. 17, 800
- d)Rs. 1,84,720
- e)None of these
Correct answer is option 'B'. Can you explain this answer?
Study the following table carefully and answer the questions given follow:
Monthly expenditure (in thousands) by five people on Rent, Food, Children’s education, Clothes and Traveling
Monthly expenditure (in thousands) by five people on Rent, Food, Children’s education, Clothes and Traveling
Q. What is the total monthly expenditure made by D on rent, B on clothes and E on traveling together?
a)
Rs. 18, 720
b)
Rs. 1,78,200
c)
Rs. 17, 800
d)
Rs. 1,84,720
e)
None of these
|
|
Prity Biswas answered |
9650+2750+5420=17820(b)
Study the following graph carefully and answer the question.
Water level of four major Rivers (in metres) in four different Months
Water level of four Rivers
Q. What was the respective ratio between the water level of River – C in September and the water level of River – B in June?- a)91 : 101
- b)94 : 101
- c)51 : 103
- d)31 : 101
- e)92:101
Correct answer is option 'E'. Can you explain this answer?
Study the following graph carefully and answer the question.
Water level of four major Rivers (in metres) in four different Months
Water level of four Rivers
Water level of four major Rivers (in metres) in four different Months
Water level of four Rivers
Q. What was the respective ratio between the water level of River – C in September and the water level of River – B in June?
a)
91 : 101
b)
94 : 101
c)
51 : 103
d)
31 : 101
e)
92:101

|
Ananya Vats answered |
Water level of river C in September= 184 m
water level of river B in June= 202 m
Ratio b/w the level of both the rivers= 184:202
=> 92:101
Study the following line graph and answer the questions based on it.Number of Vehicles Manufactured by Two companies over the Years (Number in Thousands)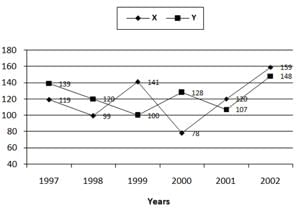 Q.
Q.
What is the difference between the number of vehicles manufactured by Company Y in 2000 and 2001?- a)50000
- b)42000
- c)33000
- d)21000
Correct answer is option 'D'. Can you explain this answer?
Study the following line graph and answer the questions based on it.
Number of Vehicles Manufactured by Two companies over the Years (Number in Thousands)
Q.
What is the difference between the number of vehicles manufactured by Company Y in 2000 and 2001?
What is the difference between the number of vehicles manufactured by Company Y in 2000 and 2001?
a)
50000
b)
42000
c)
33000
d)
21000
|
|
Shanaya Sharma answered |
(Units are in thousands)
In 2000 , Y had 128000 units
and in 2001 , Y had 107000 units
128000 - 107000 = 21000 , i.e. , d)
In 2000 , Y had 128000 units
and in 2001 , Y had 107000 units
128000 - 107000 = 21000 , i.e. , d)
Study the following graph carefully and answer the question.
Water level of four major Rivers (in metres) in four different Months
Water level of four Rivers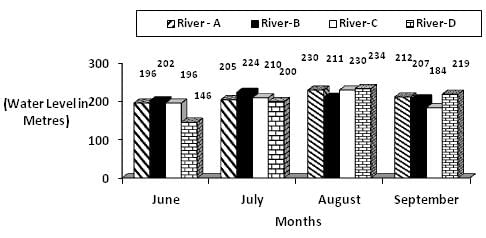 Q. If the water level of River-A in July is decreased by 20%, then what will be the water level of River-A in July
 - a)156m
- b)162m
- c)164m
- d)152m
- e)None of these
Correct answer is option 'C'. Can you explain this answer?
Study the following graph carefully and answer the question.
Water level of four major Rivers (in metres) in four different Months
Water level of four Rivers
Water level of four major Rivers (in metres) in four different Months
Water level of four Rivers
Q. If the water level of River-A in July is decreased by 20%, then what will be the water level of River-A in July
a)
156m
b)
162m
c)
164m
d)
152m
e)
None of these
|
|
Kunal Vats answered |
River A water level July = 205 m
20% Decrease = 205 - 20.5×2 = 164m Ans.
20% Decrease = 205 - 20.5×2 = 164m Ans.

Study the following graph carefully to answer the given questionsQ and S work together for 5 days, the rest of the work is finished by M in two more days. If they get Rs. 6000 as wages for the whole work, what are the daily wages of Q, S and M respectively?- a)200, 250, 300
- b)300, 200, 250
- c)600, 400, 200
- d)600, 400, 500
- e)None of these
Correct answer is option 'D'. Can you explain this answer?
Study the following graph carefully to answer the given questions
Q and S work together for 5 days, the rest of the work is finished by M in two more days. If they get Rs. 6000 as wages for the whole work, what are the daily wages of Q, S and M respectively?
a)
200, 250, 300
b)
300, 200, 250
c)
600, 400, 200
d)
600, 400, 500
e)
None of these
|
|
Preeti Khanna answered |
Explanation:
Q’s 5 days work = 50%
S’s 5 days work = 33.33%
M’s 2 days work = 16.66% [100- (50+33.33)] Ratio of work of Q, S and M = 3: 2: 1
Q’s total share = Rs. 3000
S’s total share = Rs. 2000
M’s total share = Rs. 1000
Q’s one day’s wage = Rs.600
S’s one day’s wage = Rs.400
M’s one day’s wage = Rs.500
Q’s 5 days work = 50%
S’s 5 days work = 33.33%
M’s 2 days work = 16.66% [100- (50+33.33)] Ratio of work of Q, S and M = 3: 2: 1
Q’s total share = Rs. 3000
S’s total share = Rs. 2000
M’s total share = Rs. 1000
Q’s one day’s wage = Rs.600
S’s one day’s wage = Rs.400
M’s one day’s wage = Rs.500
(Q.no: 16 -20). Refer to the table and answer the given questions.NA refers the data which is not needed for a particular question. The price details of 5 products are given below and some of them are missing. Take the data of the first row for the first question and the second row for the second question and so on.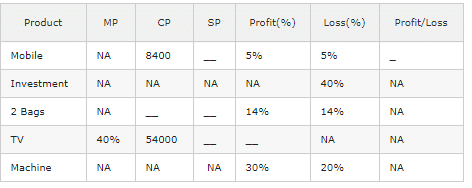 Rahul purchased a mobile and sold it for a loss(loss % given in the table). From that money, he purchased another article and sold it for a gain of (Profit % given in the table). What is the overall gain or loss?
- a)Profit of Rs.21
- b)Profit of Rs.24
- c)Loss of Rs.21
- d)Loss of Rs.24
- e)None of these
Correct answer is option 'C'. Can you explain this answer?
(Q.no: 16 -20). Refer to the table and answer the given questions.
NA refers the data which is not needed for a particular question. The price details of 5 products are given below and some of them are missing. Take the data of the first row for the first question and the second row for the second question and so on.
Rahul purchased a mobile and sold it for a loss(loss % given in the table). From that money, he purchased another article and sold it for a gain of (Profit % given in the table). What is the overall gain or loss?
a)
Profit of Rs.21
b)
Profit of Rs.24
c)
Loss of Rs.21
d)
Loss of Rs.24
e)
None of these

|
Sachin Yadav answered |
C
Study the following graph carefully to answer the given questionsTime taken by the pipes to fill a tank/cistern (hours/minutes)Three pipes R, P and Q can fill the tank. R can fill the tank 5 minutes less than that of Q. If all the pipes are opened together and pipe P is turned off 5 minutes before the tank is filled. Then find the time in which the tank will full.- a)45/11hrs
- b)53/11hrs
- c)51/13hrs
- d)47/11hrs
- e)None of these
Correct answer is option 'A'. Can you explain this answer?
Study the following graph carefully to answer the given questions
Time taken by the pipes to fill a tank/cistern (hours/minutes)
Three pipes R, P and Q can fill the tank. R can fill the tank 5 minutes less than that of Q. If all the pipes are opened together and pipe P is turned off 5 minutes before the tank is filled. Then find the time in which the tank will full.
a)
45/11hrs
b)
53/11hrs
c)
51/13hrs
d)
47/11hrs
e)
None of these
|
|
ナルト answered |
Answer is a
Chapter doubts & questions for Data Interpretation - Quantitative Aptitude for Competitive Exams 2025 is part of SSC MTS / SSC GD exam preparation. The chapters have been prepared according to the SSC MTS / SSC GD exam syllabus. The Chapter doubts & questions, notes, tests & MCQs are made for SSC MTS / SSC GD 2025 Exam. Find important definitions, questions, notes, meanings, examples, exercises, MCQs and online tests here.
Chapter doubts & questions of Data Interpretation - Quantitative Aptitude for Competitive Exams in English & Hindi are available as part of SSC MTS / SSC GD exam.
Download more important topics, notes, lectures and mock test series for SSC MTS / SSC GD Exam by signing up for free.
Quantitative Aptitude for Competitive Exams
203 videos|110 docs|114 tests
|
|
© EduRev
|
Education Revolution
|


|


Signup to see your scores
go up
within 7 days!
within 7 days!
Takes less than 10 seconds to signup