


Quant Exam > Quant Questions > Study the following graph carefully and answe...
Start Learning for Free
Study the following graph carefully and answer the following questions given below.
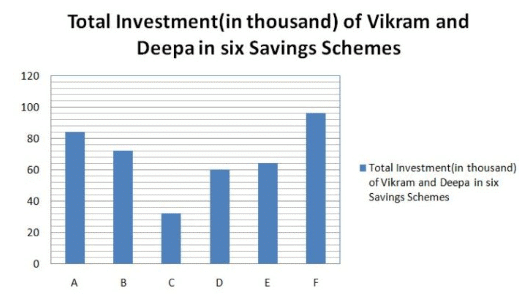
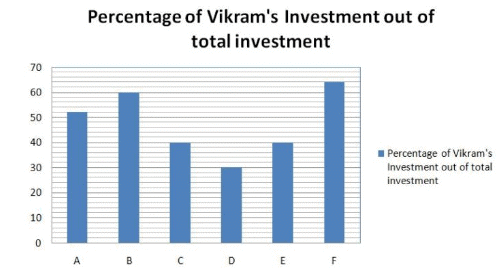
What is the sum of the average amount invested in Savings schemes A, D and E by Vikram and the average amount invested in Savings schemes B, C and F by Deepa?
- a)54272
- b)57614
- c)54600
- d)56613
- e)57514
Correct answer is option 'D'. Can you explain this answer?

Most Upvoted Answer
Study the following graph carefully and answer the following questions...
Average amount invested in schemes A, D and E by Vikram = (43680 + 18000 + 25600)/3 = 87280/3 = 29093
Average amount invested in schemes B, C and F by Deepa = (28800 + 19200 + 34560)/3 = 82560/3 = 27520
Sum = 29093 + 27520 = 56613
Average amount invested in schemes B, C and F by Deepa = (28800 + 19200 + 34560)/3 = 82560/3 = 27520
Sum = 29093 + 27520 = 56613
Free Test
FREE
| Start Free Test |
Community Answer
Study the following graph carefully and answer the following questions...
Average amount invested in schemes A, D and E by Vikram = (43680 + 18000 + 25600)/3 = 87280/3 = 29093
Average amount invested in schemes B, C and F by Deepa = (28800 + 19200 + 34560)/3 = 82560/3 = 27520
Sum = 29093 + 27520 = 56613
Average amount invested in schemes B, C and F by Deepa = (28800 + 19200 + 34560)/3 = 82560/3 = 27520
Sum = 29093 + 27520 = 56613

|
Explore Courses for Quant exam
|
|
Similar Quant Doubts


Study the following graph carefully and answer the following questions given below.What is the sum of the average amount invested in Savings schemes A, D and E by Vikram and the average amount invested in Savings schemes B, C and F by Deepa?a)54272b)57614c)54600d)56613e)57514Correct answer is option 'D'. Can you explain this answer?
Question Description
Study the following graph carefully and answer the following questions given below.What is the sum of the average amount invested in Savings schemes A, D and E by Vikram and the average amount invested in Savings schemes B, C and F by Deepa?a)54272b)57614c)54600d)56613e)57514Correct answer is option 'D'. Can you explain this answer? for Quant 2025 is part of Quant preparation. The Question and answers have been prepared according to the Quant exam syllabus. Information about Study the following graph carefully and answer the following questions given below.What is the sum of the average amount invested in Savings schemes A, D and E by Vikram and the average amount invested in Savings schemes B, C and F by Deepa?a)54272b)57614c)54600d)56613e)57514Correct answer is option 'D'. Can you explain this answer? covers all topics & solutions for Quant 2025 Exam. Find important definitions, questions, meanings, examples, exercises and tests below for Study the following graph carefully and answer the following questions given below.What is the sum of the average amount invested in Savings schemes A, D and E by Vikram and the average amount invested in Savings schemes B, C and F by Deepa?a)54272b)57614c)54600d)56613e)57514Correct answer is option 'D'. Can you explain this answer?.
Study the following graph carefully and answer the following questions given below.What is the sum of the average amount invested in Savings schemes A, D and E by Vikram and the average amount invested in Savings schemes B, C and F by Deepa?a)54272b)57614c)54600d)56613e)57514Correct answer is option 'D'. Can you explain this answer? for Quant 2025 is part of Quant preparation. The Question and answers have been prepared according to the Quant exam syllabus. Information about Study the following graph carefully and answer the following questions given below.What is the sum of the average amount invested in Savings schemes A, D and E by Vikram and the average amount invested in Savings schemes B, C and F by Deepa?a)54272b)57614c)54600d)56613e)57514Correct answer is option 'D'. Can you explain this answer? covers all topics & solutions for Quant 2025 Exam. Find important definitions, questions, meanings, examples, exercises and tests below for Study the following graph carefully and answer the following questions given below.What is the sum of the average amount invested in Savings schemes A, D and E by Vikram and the average amount invested in Savings schemes B, C and F by Deepa?a)54272b)57614c)54600d)56613e)57514Correct answer is option 'D'. Can you explain this answer?.
Solutions for Study the following graph carefully and answer the following questions given below.What is the sum of the average amount invested in Savings schemes A, D and E by Vikram and the average amount invested in Savings schemes B, C and F by Deepa?a)54272b)57614c)54600d)56613e)57514Correct answer is option 'D'. Can you explain this answer? in English & in Hindi are available as part of our courses for Quant.
Download more important topics, notes, lectures and mock test series for Quant Exam by signing up for free.
Here you can find the meaning of Study the following graph carefully and answer the following questions given below.What is the sum of the average amount invested in Savings schemes A, D and E by Vikram and the average amount invested in Savings schemes B, C and F by Deepa?a)54272b)57614c)54600d)56613e)57514Correct answer is option 'D'. Can you explain this answer? defined & explained in the simplest way possible. Besides giving the explanation of
Study the following graph carefully and answer the following questions given below.What is the sum of the average amount invested in Savings schemes A, D and E by Vikram and the average amount invested in Savings schemes B, C and F by Deepa?a)54272b)57614c)54600d)56613e)57514Correct answer is option 'D'. Can you explain this answer?, a detailed solution for Study the following graph carefully and answer the following questions given below.What is the sum of the average amount invested in Savings schemes A, D and E by Vikram and the average amount invested in Savings schemes B, C and F by Deepa?a)54272b)57614c)54600d)56613e)57514Correct answer is option 'D'. Can you explain this answer? has been provided alongside types of Study the following graph carefully and answer the following questions given below.What is the sum of the average amount invested in Savings schemes A, D and E by Vikram and the average amount invested in Savings schemes B, C and F by Deepa?a)54272b)57614c)54600d)56613e)57514Correct answer is option 'D'. Can you explain this answer? theory, EduRev gives you an
ample number of questions to practice Study the following graph carefully and answer the following questions given below.What is the sum of the average amount invested in Savings schemes A, D and E by Vikram and the average amount invested in Savings schemes B, C and F by Deepa?a)54272b)57614c)54600d)56613e)57514Correct answer is option 'D'. Can you explain this answer? tests, examples and also practice Quant tests.
|
|
Explore Courses for Quant exam
|
|

Signup for Free!
Signup to see your scores go up within 7 days! Learn & Practice with 1000+ FREE Notes, Videos & Tests.


|
© EduRev
|
Education Revolution
|


|


Signup to see your scores
go up within 7 days!
Access 1000+ FREE Docs, Videos and Tests
Takes less than 10 seconds to signup