


Quant Exam > Quant Questions > The following line graph gives the percent pr...
Start Learning for Free

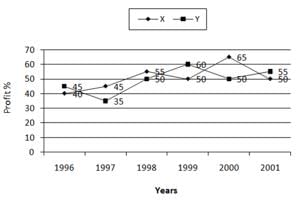
The following line graph gives the percent profit earned by two Companies X and Y during the period 1996 - 2001.
Percentage profit earned by Two Companies X and Y over the Given Years
Q.
The incomes of two Companies X and Y in 2000 were in the ratio of 3:4 respectively. What was the respective ratio of their expenditures in 2000?
The incomes of two Companies X and Y in 2000 were in the ratio of 3:4 respectively. What was the respective ratio of their expenditures in 2000?
- a)7:22
- b)14:19
- c)15:22
- d)27:35
Correct answer is option 'C'. Can you explain this answer?
| FREE This question is part of | Download PDF Attempt this Test |
Most Upvoted Answer
The following line graph gives the percent profit earned by two Compan...
The correct answer is C
Let the incomes in 2000 of Companies X and Y be 3x and 4x respectively.
And let the expenditures in 2000 of Companies X and Y be E1 and E2 respectively.
Then, for Company X we have:
65 =[( 3x - E1 )/E1]×100 =>65/100 = (3x/E1) - 1
=> E1 = 3x×( 100/165 ) .... (i)
For Company Y we have:
50 = [(4x - E2 )/E2]x 100 =>50/100= (4x/E1) - 1 => E2 = 4x×( 100/150 ) .... (ii)
From (i) and (ii), we get:
E1/E2=[3x ×(100/165)]/[4x×(100/150)]
E1/E2=15/22 (required ratio)
Free Test
FREE
| Start Free Test |
Community Answer
The following line graph gives the percent profit earned by two Compan...
Explanation:
Let the incomes in 2000 of Companies X and Y be 3x and 4x respectively.
And let the expenditures in 2000 of Companies X and Y be E1 and E2 respectively.
Then, for Company X we have:
65 =[( 3x - E1 )/E1]×100 =>65/100 = (3x/E1) - 1 => E1 = 3x×( 100/165 ) .... (i)
For Company Y we have:
50 = [(4x - E2 )/E2]x 100 =>50/100= (4x/E1) - 1 => E2 = 4x×( 100/150 ) .... (ii)
From (i) and (ii), we get:
E1/E2=[3x ×(100/165)]/[4x×(100/150)]
E1/E2=15/22 (required ratio)

|
Explore Courses for Quant exam
|
|
Similar Quant Doubts


The following line graph gives the percent profit earned by two Companies X and Y during the period 1996 - 2001.Percentage profit earned by Two Companies X and Y over the Given YearsQ.The incomes of two Companies X and Y in 2000 were in the ratio of 3:4 respectively. What was the respective ratio of their expenditures in 2000?a)7:22b)14:19c)15:22d)27:35Correct answer is option 'C'. Can you explain this answer?
Question Description
The following line graph gives the percent profit earned by two Companies X and Y during the period 1996 - 2001.Percentage profit earned by Two Companies X and Y over the Given YearsQ.The incomes of two Companies X and Y in 2000 were in the ratio of 3:4 respectively. What was the respective ratio of their expenditures in 2000?a)7:22b)14:19c)15:22d)27:35Correct answer is option 'C'. Can you explain this answer? for Quant 2024 is part of Quant preparation. The Question and answers have been prepared according to the Quant exam syllabus. Information about The following line graph gives the percent profit earned by two Companies X and Y during the period 1996 - 2001.Percentage profit earned by Two Companies X and Y over the Given YearsQ.The incomes of two Companies X and Y in 2000 were in the ratio of 3:4 respectively. What was the respective ratio of their expenditures in 2000?a)7:22b)14:19c)15:22d)27:35Correct answer is option 'C'. Can you explain this answer? covers all topics & solutions for Quant 2024 Exam. Find important definitions, questions, meanings, examples, exercises and tests below for The following line graph gives the percent profit earned by two Companies X and Y during the period 1996 - 2001.Percentage profit earned by Two Companies X and Y over the Given YearsQ.The incomes of two Companies X and Y in 2000 were in the ratio of 3:4 respectively. What was the respective ratio of their expenditures in 2000?a)7:22b)14:19c)15:22d)27:35Correct answer is option 'C'. Can you explain this answer?.
The following line graph gives the percent profit earned by two Companies X and Y during the period 1996 - 2001.Percentage profit earned by Two Companies X and Y over the Given YearsQ.The incomes of two Companies X and Y in 2000 were in the ratio of 3:4 respectively. What was the respective ratio of their expenditures in 2000?a)7:22b)14:19c)15:22d)27:35Correct answer is option 'C'. Can you explain this answer? for Quant 2024 is part of Quant preparation. The Question and answers have been prepared according to the Quant exam syllabus. Information about The following line graph gives the percent profit earned by two Companies X and Y during the period 1996 - 2001.Percentage profit earned by Two Companies X and Y over the Given YearsQ.The incomes of two Companies X and Y in 2000 were in the ratio of 3:4 respectively. What was the respective ratio of their expenditures in 2000?a)7:22b)14:19c)15:22d)27:35Correct answer is option 'C'. Can you explain this answer? covers all topics & solutions for Quant 2024 Exam. Find important definitions, questions, meanings, examples, exercises and tests below for The following line graph gives the percent profit earned by two Companies X and Y during the period 1996 - 2001.Percentage profit earned by Two Companies X and Y over the Given YearsQ.The incomes of two Companies X and Y in 2000 were in the ratio of 3:4 respectively. What was the respective ratio of their expenditures in 2000?a)7:22b)14:19c)15:22d)27:35Correct answer is option 'C'. Can you explain this answer?.
Solutions for The following line graph gives the percent profit earned by two Companies X and Y during the period 1996 - 2001.Percentage profit earned by Two Companies X and Y over the Given YearsQ.The incomes of two Companies X and Y in 2000 were in the ratio of 3:4 respectively. What was the respective ratio of their expenditures in 2000?a)7:22b)14:19c)15:22d)27:35Correct answer is option 'C'. Can you explain this answer? in English & in Hindi are available as part of our courses for Quant.
Download more important topics, notes, lectures and mock test series for Quant Exam by signing up for free.
Here you can find the meaning of The following line graph gives the percent profit earned by two Companies X and Y during the period 1996 - 2001.Percentage profit earned by Two Companies X and Y over the Given YearsQ.The incomes of two Companies X and Y in 2000 were in the ratio of 3:4 respectively. What was the respective ratio of their expenditures in 2000?a)7:22b)14:19c)15:22d)27:35Correct answer is option 'C'. Can you explain this answer? defined & explained in the simplest way possible. Besides giving the explanation of
The following line graph gives the percent profit earned by two Companies X and Y during the period 1996 - 2001.Percentage profit earned by Two Companies X and Y over the Given YearsQ.The incomes of two Companies X and Y in 2000 were in the ratio of 3:4 respectively. What was the respective ratio of their expenditures in 2000?a)7:22b)14:19c)15:22d)27:35Correct answer is option 'C'. Can you explain this answer?, a detailed solution for The following line graph gives the percent profit earned by two Companies X and Y during the period 1996 - 2001.Percentage profit earned by Two Companies X and Y over the Given YearsQ.The incomes of two Companies X and Y in 2000 were in the ratio of 3:4 respectively. What was the respective ratio of their expenditures in 2000?a)7:22b)14:19c)15:22d)27:35Correct answer is option 'C'. Can you explain this answer? has been provided alongside types of The following line graph gives the percent profit earned by two Companies X and Y during the period 1996 - 2001.Percentage profit earned by Two Companies X and Y over the Given YearsQ.The incomes of two Companies X and Y in 2000 were in the ratio of 3:4 respectively. What was the respective ratio of their expenditures in 2000?a)7:22b)14:19c)15:22d)27:35Correct answer is option 'C'. Can you explain this answer? theory, EduRev gives you an
ample number of questions to practice The following line graph gives the percent profit earned by two Companies X and Y during the period 1996 - 2001.Percentage profit earned by Two Companies X and Y over the Given YearsQ.The incomes of two Companies X and Y in 2000 were in the ratio of 3:4 respectively. What was the respective ratio of their expenditures in 2000?a)7:22b)14:19c)15:22d)27:35Correct answer is option 'C'. Can you explain this answer? tests, examples and also practice Quant tests.
|
|
Explore Courses for Quant exam
|
|
Suggested Free Tests
Signup for Free!
Signup to see your scores go up within 7 days! Learn & Practice with 1000+ FREE Notes, Videos & Tests.


|
© EduRev
|
Education Revolution
|


|


Signup to see your scores
go up within 7 days!
Access 1000+ FREE Docs, Videos and Tests
Takes less than 10 seconds to signup