


Class 10 Exam > Class 10 Questions > The following distribution gives the daily in...
Start Learning for Free

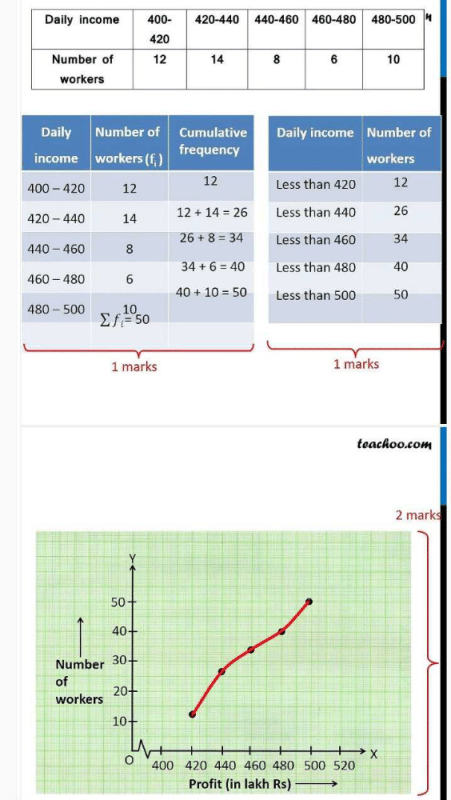
The following distribution gives the daily income of 50 worker of a factor Daily income 400-420 420-440 440-460 460-480 480-500 No. Of workers 12 14 8 6 10 Convert this distribution to less than type of cumulative frequency distribution and draw its ogive.?

Most Upvoted Answer
The following distribution gives the daily income of 50 worker of a fa...
Community Answer
The following distribution gives the daily income of 50 worker of a fa...
Less than type of cumulative frequency distribution:
To convert the given distribution into a less than type of cumulative frequency distribution, we need to calculate the cumulative frequency for each class interval. The cumulative frequency for a class interval is the sum of the frequencies of that class interval and all the previous class intervals.
To calculate the cumulative frequency, we can start with the first class interval and add the frequency of that interval to get the cumulative frequency for that interval. Then, we add the cumulative frequency of the first interval to the frequency of the second interval to get the cumulative frequency for the second interval, and so on.
Class Interval No. of workers Cumulative Frequency
400-420 12 12
420-440 14 26
440-460 8 34
460-480 6 40
480-500 10 50
Ogive:
To draw the ogive, we plot the cumulative frequency on the y-axis and the upper class limit of each interval on the x-axis. We then join the points on the graph with straight lines.
To plot the ogive, we can use the cumulative frequency and the upper class limit for each interval.
Upper Class Limit Cumulative Frequency
420 12
440 26
460 34
480 40
500 50
Now, we can plot these points on a graph and join them with straight lines to obtain the ogive.
Explanation:
The less than type of cumulative frequency distribution shows the cumulative frequency for each class interval, which represents the number of observations that are less than or equal to the upper class limit of that interval.
The ogive is a graphical representation of the cumulative frequency distribution. It helps us visualize the cumulative frequency distribution and understand the distribution of data.
In this case, the given distribution represents the daily income of 50 workers in a factory. By converting it to a less than type of cumulative frequency distribution, we can see how many workers earn less than or equal to a certain income level.
The ogive helps us understand the distribution of income among the workers and identify the income levels at which a certain percentage of workers fall below. It is a useful tool for analyzing and interpreting data.
Attention Class 10 Students!
To make sure you are not studying endlessly, EduRev has designed Class 10 study material, with Structured Courses, Videos, & Test Series. Plus get personalized analysis, doubt solving and improvement plans to achieve a great score in Class 10.


|
Explore Courses for Class 10 exam
|
|
Similar Class 10 Doubts


Top Courses for Class 10View all


The following distribution gives the daily income of 50 worker of a factor Daily income 400-420 420-440 440-460 460-480 480-500 No. Of workers 12 14 8 6 10 Convert this distribution to less than type of cumulative frequency distribution and draw its ogive.?
Question Description
The following distribution gives the daily income of 50 worker of a factor Daily income 400-420 420-440 440-460 460-480 480-500 No. Of workers 12 14 8 6 10 Convert this distribution to less than type of cumulative frequency distribution and draw its ogive.? for Class 10 2024 is part of Class 10 preparation. The Question and answers have been prepared according to the Class 10 exam syllabus. Information about The following distribution gives the daily income of 50 worker of a factor Daily income 400-420 420-440 440-460 460-480 480-500 No. Of workers 12 14 8 6 10 Convert this distribution to less than type of cumulative frequency distribution and draw its ogive.? covers all topics & solutions for Class 10 2024 Exam. Find important definitions, questions, meanings, examples, exercises and tests below for The following distribution gives the daily income of 50 worker of a factor Daily income 400-420 420-440 440-460 460-480 480-500 No. Of workers 12 14 8 6 10 Convert this distribution to less than type of cumulative frequency distribution and draw its ogive.?.
The following distribution gives the daily income of 50 worker of a factor Daily income 400-420 420-440 440-460 460-480 480-500 No. Of workers 12 14 8 6 10 Convert this distribution to less than type of cumulative frequency distribution and draw its ogive.? for Class 10 2024 is part of Class 10 preparation. The Question and answers have been prepared according to the Class 10 exam syllabus. Information about The following distribution gives the daily income of 50 worker of a factor Daily income 400-420 420-440 440-460 460-480 480-500 No. Of workers 12 14 8 6 10 Convert this distribution to less than type of cumulative frequency distribution and draw its ogive.? covers all topics & solutions for Class 10 2024 Exam. Find important definitions, questions, meanings, examples, exercises and tests below for The following distribution gives the daily income of 50 worker of a factor Daily income 400-420 420-440 440-460 460-480 480-500 No. Of workers 12 14 8 6 10 Convert this distribution to less than type of cumulative frequency distribution and draw its ogive.?.
Solutions for The following distribution gives the daily income of 50 worker of a factor Daily income 400-420 420-440 440-460 460-480 480-500 No. Of workers 12 14 8 6 10 Convert this distribution to less than type of cumulative frequency distribution and draw its ogive.? in English & in Hindi are available as part of our courses for Class 10.
Download more important topics, notes, lectures and mock test series for Class 10 Exam by signing up for free.
Here you can find the meaning of The following distribution gives the daily income of 50 worker of a factor Daily income 400-420 420-440 440-460 460-480 480-500 No. Of workers 12 14 8 6 10 Convert this distribution to less than type of cumulative frequency distribution and draw its ogive.? defined & explained in the simplest way possible. Besides giving the explanation of
The following distribution gives the daily income of 50 worker of a factor Daily income 400-420 420-440 440-460 460-480 480-500 No. Of workers 12 14 8 6 10 Convert this distribution to less than type of cumulative frequency distribution and draw its ogive.?, a detailed solution for The following distribution gives the daily income of 50 worker of a factor Daily income 400-420 420-440 440-460 460-480 480-500 No. Of workers 12 14 8 6 10 Convert this distribution to less than type of cumulative frequency distribution and draw its ogive.? has been provided alongside types of The following distribution gives the daily income of 50 worker of a factor Daily income 400-420 420-440 440-460 460-480 480-500 No. Of workers 12 14 8 6 10 Convert this distribution to less than type of cumulative frequency distribution and draw its ogive.? theory, EduRev gives you an
ample number of questions to practice The following distribution gives the daily income of 50 worker of a factor Daily income 400-420 420-440 440-460 460-480 480-500 No. Of workers 12 14 8 6 10 Convert this distribution to less than type of cumulative frequency distribution and draw its ogive.? tests, examples and also practice Class 10 tests.
|
|
Explore Courses for Class 10 exam
|
|
Suggested Free Tests
Signup for Free!
Signup to see your scores go up within 7 days! Learn & Practice with 1000+ FREE Notes, Videos & Tests.


|
© EduRev
|
Education Revolution
|


|


Signup to see your scores
go up within 7 days!
Access 1000+ FREE Docs, Videos and Tests
Takes less than 10 seconds to signup