


Quant Exam > Quant Questions > Directions (Q.15-19): The following graph sho...
Start Learning for Free

Directions (Q.15-19): The following graph shows the percentage of number of students in three different disciplines in a certain college for the years 2002-2007
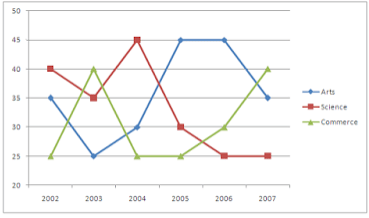
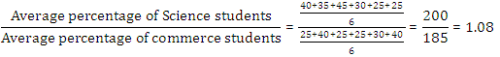
The average percentage of science students is approximately how many times the average percentage of commerce students?
- a)3
- b)1.08
- c)2.15
- d)2
- e)1.16
Correct answer is option 'B'. Can you explain this answer?
| FREE This question is part of | Download PDF Attempt this Test |
Verified Answer
Directions (Q.15-19): The following graph shows the percentage of numb...
Most Upvoted Answer
Directions (Q.15-19): The following graph shows the percentage of numb...
Free Test
FREE
| Start Free Test |
Community Answer
Directions (Q.15-19): The following graph shows the percentage of numb...

|
Explore Courses for Quant exam
|
|
Similar Quant Doubts


Directions (Q.15-19): The following graph shows the percentage of number of students in three different disciplines in a certain college for the years 2002-2007The average percentage of science students is approximately how many times the average percentage of commerce students?a)3b)1.08c)2.15d)2e)1.16Correct answer is option 'B'. Can you explain this answer?
Question Description
Directions (Q.15-19): The following graph shows the percentage of number of students in three different disciplines in a certain college for the years 2002-2007The average percentage of science students is approximately how many times the average percentage of commerce students?a)3b)1.08c)2.15d)2e)1.16Correct answer is option 'B'. Can you explain this answer? for Quant 2024 is part of Quant preparation. The Question and answers have been prepared according to the Quant exam syllabus. Information about Directions (Q.15-19): The following graph shows the percentage of number of students in three different disciplines in a certain college for the years 2002-2007The average percentage of science students is approximately how many times the average percentage of commerce students?a)3b)1.08c)2.15d)2e)1.16Correct answer is option 'B'. Can you explain this answer? covers all topics & solutions for Quant 2024 Exam. Find important definitions, questions, meanings, examples, exercises and tests below for Directions (Q.15-19): The following graph shows the percentage of number of students in three different disciplines in a certain college for the years 2002-2007The average percentage of science students is approximately how many times the average percentage of commerce students?a)3b)1.08c)2.15d)2e)1.16Correct answer is option 'B'. Can you explain this answer?.
Directions (Q.15-19): The following graph shows the percentage of number of students in three different disciplines in a certain college for the years 2002-2007The average percentage of science students is approximately how many times the average percentage of commerce students?a)3b)1.08c)2.15d)2e)1.16Correct answer is option 'B'. Can you explain this answer? for Quant 2024 is part of Quant preparation. The Question and answers have been prepared according to the Quant exam syllabus. Information about Directions (Q.15-19): The following graph shows the percentage of number of students in three different disciplines in a certain college for the years 2002-2007The average percentage of science students is approximately how many times the average percentage of commerce students?a)3b)1.08c)2.15d)2e)1.16Correct answer is option 'B'. Can you explain this answer? covers all topics & solutions for Quant 2024 Exam. Find important definitions, questions, meanings, examples, exercises and tests below for Directions (Q.15-19): The following graph shows the percentage of number of students in three different disciplines in a certain college for the years 2002-2007The average percentage of science students is approximately how many times the average percentage of commerce students?a)3b)1.08c)2.15d)2e)1.16Correct answer is option 'B'. Can you explain this answer?.
Solutions for Directions (Q.15-19): The following graph shows the percentage of number of students in three different disciplines in a certain college for the years 2002-2007The average percentage of science students is approximately how many times the average percentage of commerce students?a)3b)1.08c)2.15d)2e)1.16Correct answer is option 'B'. Can you explain this answer? in English & in Hindi are available as part of our courses for Quant.
Download more important topics, notes, lectures and mock test series for Quant Exam by signing up for free.
Here you can find the meaning of Directions (Q.15-19): The following graph shows the percentage of number of students in three different disciplines in a certain college for the years 2002-2007The average percentage of science students is approximately how many times the average percentage of commerce students?a)3b)1.08c)2.15d)2e)1.16Correct answer is option 'B'. Can you explain this answer? defined & explained in the simplest way possible. Besides giving the explanation of
Directions (Q.15-19): The following graph shows the percentage of number of students in three different disciplines in a certain college for the years 2002-2007The average percentage of science students is approximately how many times the average percentage of commerce students?a)3b)1.08c)2.15d)2e)1.16Correct answer is option 'B'. Can you explain this answer?, a detailed solution for Directions (Q.15-19): The following graph shows the percentage of number of students in three different disciplines in a certain college for the years 2002-2007The average percentage of science students is approximately how many times the average percentage of commerce students?a)3b)1.08c)2.15d)2e)1.16Correct answer is option 'B'. Can you explain this answer? has been provided alongside types of Directions (Q.15-19): The following graph shows the percentage of number of students in three different disciplines in a certain college for the years 2002-2007The average percentage of science students is approximately how many times the average percentage of commerce students?a)3b)1.08c)2.15d)2e)1.16Correct answer is option 'B'. Can you explain this answer? theory, EduRev gives you an
ample number of questions to practice Directions (Q.15-19): The following graph shows the percentage of number of students in three different disciplines in a certain college for the years 2002-2007The average percentage of science students is approximately how many times the average percentage of commerce students?a)3b)1.08c)2.15d)2e)1.16Correct answer is option 'B'. Can you explain this answer? tests, examples and also practice Quant tests.
|
|
Explore Courses for Quant exam
|
|
Signup for Free!
Signup to see your scores go up within 7 days! Learn & Practice with 1000+ FREE Notes, Videos & Tests.
|
© EduRev
|
Education Revolution
|


Follow Us
|


Signup to see your scores
go up
within 7 days!
within 7 days!
Takes less than 10 seconds to signup