


Quant Exam > Quant Questions > Directions (21-25): Study the following graph...
Start Learning for Free

Directions (21-25): Study the following graph carefully to answer these questions.
The line graph shows the population of 2 states over a period of 6 years
The line graph shows the population of 2 states over a period of 6 years
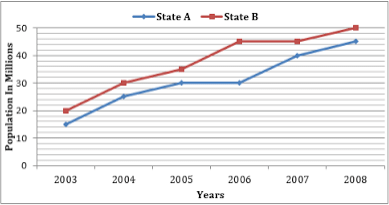
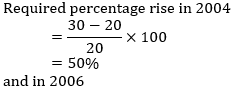
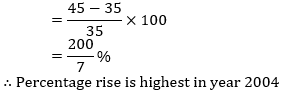
For state B the percentage rise in population from the previous year was the highest in which of the following years?
- a)2008
- b)2006
- c)2005
- d)2004
- e)2007
Correct answer is option 'D'. Can you explain this answer?
| FREE This question is part of | Download PDF Attempt this Test |
Verified Answer
Directions (21-25): Study the following graph carefully to answer thes...

|
Explore Courses for Quant exam
|
|
Directions (21-25): Study the following graph carefully to answer these questions.The line graph shows the population of 2 states over a period of 6 yearsFor state B the percentage rise in population from the previous year was the highest in which of the following years?a)2008b)2006c)2005d)2004e)2007Correct answer is option 'D'. Can you explain this answer?
Question Description
Directions (21-25): Study the following graph carefully to answer these questions.The line graph shows the population of 2 states over a period of 6 yearsFor state B the percentage rise in population from the previous year was the highest in which of the following years?a)2008b)2006c)2005d)2004e)2007Correct answer is option 'D'. Can you explain this answer? for Quant 2024 is part of Quant preparation. The Question and answers have been prepared according to the Quant exam syllabus. Information about Directions (21-25): Study the following graph carefully to answer these questions.The line graph shows the population of 2 states over a period of 6 yearsFor state B the percentage rise in population from the previous year was the highest in which of the following years?a)2008b)2006c)2005d)2004e)2007Correct answer is option 'D'. Can you explain this answer? covers all topics & solutions for Quant 2024 Exam. Find important definitions, questions, meanings, examples, exercises and tests below for Directions (21-25): Study the following graph carefully to answer these questions.The line graph shows the population of 2 states over a period of 6 yearsFor state B the percentage rise in population from the previous year was the highest in which of the following years?a)2008b)2006c)2005d)2004e)2007Correct answer is option 'D'. Can you explain this answer?.
Directions (21-25): Study the following graph carefully to answer these questions.The line graph shows the population of 2 states over a period of 6 yearsFor state B the percentage rise in population from the previous year was the highest in which of the following years?a)2008b)2006c)2005d)2004e)2007Correct answer is option 'D'. Can you explain this answer? for Quant 2024 is part of Quant preparation. The Question and answers have been prepared according to the Quant exam syllabus. Information about Directions (21-25): Study the following graph carefully to answer these questions.The line graph shows the population of 2 states over a period of 6 yearsFor state B the percentage rise in population from the previous year was the highest in which of the following years?a)2008b)2006c)2005d)2004e)2007Correct answer is option 'D'. Can you explain this answer? covers all topics & solutions for Quant 2024 Exam. Find important definitions, questions, meanings, examples, exercises and tests below for Directions (21-25): Study the following graph carefully to answer these questions.The line graph shows the population of 2 states over a period of 6 yearsFor state B the percentage rise in population from the previous year was the highest in which of the following years?a)2008b)2006c)2005d)2004e)2007Correct answer is option 'D'. Can you explain this answer?.
Solutions for Directions (21-25): Study the following graph carefully to answer these questions.The line graph shows the population of 2 states over a period of 6 yearsFor state B the percentage rise in population from the previous year was the highest in which of the following years?a)2008b)2006c)2005d)2004e)2007Correct answer is option 'D'. Can you explain this answer? in English & in Hindi are available as part of our courses for Quant.
Download more important topics, notes, lectures and mock test series for Quant Exam by signing up for free.
Here you can find the meaning of Directions (21-25): Study the following graph carefully to answer these questions.The line graph shows the population of 2 states over a period of 6 yearsFor state B the percentage rise in population from the previous year was the highest in which of the following years?a)2008b)2006c)2005d)2004e)2007Correct answer is option 'D'. Can you explain this answer? defined & explained in the simplest way possible. Besides giving the explanation of
Directions (21-25): Study the following graph carefully to answer these questions.The line graph shows the population of 2 states over a period of 6 yearsFor state B the percentage rise in population from the previous year was the highest in which of the following years?a)2008b)2006c)2005d)2004e)2007Correct answer is option 'D'. Can you explain this answer?, a detailed solution for Directions (21-25): Study the following graph carefully to answer these questions.The line graph shows the population of 2 states over a period of 6 yearsFor state B the percentage rise in population from the previous year was the highest in which of the following years?a)2008b)2006c)2005d)2004e)2007Correct answer is option 'D'. Can you explain this answer? has been provided alongside types of Directions (21-25): Study the following graph carefully to answer these questions.The line graph shows the population of 2 states over a period of 6 yearsFor state B the percentage rise in population from the previous year was the highest in which of the following years?a)2008b)2006c)2005d)2004e)2007Correct answer is option 'D'. Can you explain this answer? theory, EduRev gives you an
ample number of questions to practice Directions (21-25): Study the following graph carefully to answer these questions.The line graph shows the population of 2 states over a period of 6 yearsFor state B the percentage rise in population from the previous year was the highest in which of the following years?a)2008b)2006c)2005d)2004e)2007Correct answer is option 'D'. Can you explain this answer? tests, examples and also practice Quant tests.
|
|
Explore Courses for Quant exam
|
|
Suggested Free Tests
Signup for Free!
Signup to see your scores go up within 7 days! Learn & Practice with 1000+ FREE Notes, Videos & Tests.


|
© EduRev
|
Education Revolution
|


|


Signup to see your scores
go up within 7 days!
Access 1000+ FREE Docs, Videos and Tests
Takes less than 10 seconds to signup