


NEET Exam > NEET Questions > In a given population of 2000 individuals, 80...
Start Learning for Free
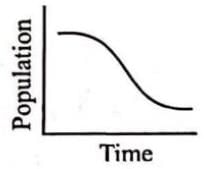
In a given population of 2000 individuals, 80 births and 125 deaths were reported over a given period of time. Which of the following graphs will correspond to it ?
- a)
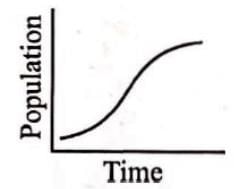
- b)
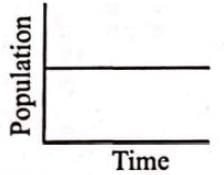
- c)
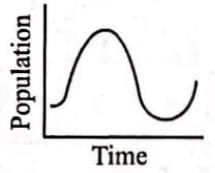
- d)
Correct answer is option 'A'. Can you explain this answer?

Most Upvoted Answer
In a given population of 2000 individuals, 80 births and 125 deaths we...
Number of deaths is more than the number of births, showing a declining population.

|
Explore Courses for NEET exam
|
|
Top Courses for NEETView all


Question Description
In a given population of 2000 individuals, 80 births and 125 deaths were reported over a given period of time. Which of the following graphs will correspond to it ?a)b)c)d)Correct answer is option 'A'. Can you explain this answer? for NEET 2025 is part of NEET preparation. The Question and answers have been prepared according to the NEET exam syllabus. Information about In a given population of 2000 individuals, 80 births and 125 deaths were reported over a given period of time. Which of the following graphs will correspond to it ?a)b)c)d)Correct answer is option 'A'. Can you explain this answer? covers all topics & solutions for NEET 2025 Exam. Find important definitions, questions, meanings, examples, exercises and tests below for In a given population of 2000 individuals, 80 births and 125 deaths were reported over a given period of time. Which of the following graphs will correspond to it ?a)b)c)d)Correct answer is option 'A'. Can you explain this answer?.
In a given population of 2000 individuals, 80 births and 125 deaths were reported over a given period of time. Which of the following graphs will correspond to it ?a)b)c)d)Correct answer is option 'A'. Can you explain this answer? for NEET 2025 is part of NEET preparation. The Question and answers have been prepared according to the NEET exam syllabus. Information about In a given population of 2000 individuals, 80 births and 125 deaths were reported over a given period of time. Which of the following graphs will correspond to it ?a)b)c)d)Correct answer is option 'A'. Can you explain this answer? covers all topics & solutions for NEET 2025 Exam. Find important definitions, questions, meanings, examples, exercises and tests below for In a given population of 2000 individuals, 80 births and 125 deaths were reported over a given period of time. Which of the following graphs will correspond to it ?a)b)c)d)Correct answer is option 'A'. Can you explain this answer?.
Solutions for In a given population of 2000 individuals, 80 births and 125 deaths were reported over a given period of time. Which of the following graphs will correspond to it ?a)b)c)d)Correct answer is option 'A'. Can you explain this answer? in English & in Hindi are available as part of our courses for NEET.
Download more important topics, notes, lectures and mock test series for NEET Exam by signing up for free.
Here you can find the meaning of In a given population of 2000 individuals, 80 births and 125 deaths were reported over a given period of time. Which of the following graphs will correspond to it ?a)b)c)d)Correct answer is option 'A'. Can you explain this answer? defined & explained in the simplest way possible. Besides giving the explanation of
In a given population of 2000 individuals, 80 births and 125 deaths were reported over a given period of time. Which of the following graphs will correspond to it ?a)b)c)d)Correct answer is option 'A'. Can you explain this answer?, a detailed solution for In a given population of 2000 individuals, 80 births and 125 deaths were reported over a given period of time. Which of the following graphs will correspond to it ?a)b)c)d)Correct answer is option 'A'. Can you explain this answer? has been provided alongside types of In a given population of 2000 individuals, 80 births and 125 deaths were reported over a given period of time. Which of the following graphs will correspond to it ?a)b)c)d)Correct answer is option 'A'. Can you explain this answer? theory, EduRev gives you an
ample number of questions to practice In a given population of 2000 individuals, 80 births and 125 deaths were reported over a given period of time. Which of the following graphs will correspond to it ?a)b)c)d)Correct answer is option 'A'. Can you explain this answer? tests, examples and also practice NEET tests.
|
|
Explore Courses for NEET exam
|
|

Signup for Free!
Signup to see your scores go up within 7 days! Learn & Practice with 1000+ FREE Notes, Videos & Tests.
|
© EduRev
|
Education Revolution
|


|


Signup on EduRev and stay on top of your study goals
10M+ students crushing their study goals daily