


Class 10 Exam > Class 10 Questions > Fill in the blanks.(i) For a given data with ...
Start Learning for Free

Fill in the blanks.
(i) For a given data with 110 observations the ‘less than ogive’ and ‘more than ogive’ intersect at (18, 20). The median of the data is __P__ .
(ii) The curve is drawn by taking upper limit of class interval along x-axis and cumulating frequency along y-axis is __Q__ than ogive.
(iii) T he m ean of 50 num ber s is 18, the new mean will be __R__ if each observation is increased by 4.
(iv) The mean of seven consecutive natural numbers is 20, then the largest number is __S__ and smallest number of them is __T__ .
P, Q, R, S, T
- a)18, Less, 22, 23, 17
- b)20, More, 25, 22, 16
- c)18, More, 22, 24, 18
- d)20, Less, 25, 22, 16
Correct answer is option 'A'. Can you explain this answer?
| FREE This question is part of | Download PDF Attempt this Test |
Most Upvoted Answer
Fill in the blanks.(i) For a given data with 110 observations the &lsq...
(i) The intersection point of less than ogive and more than ogive, the x-coordinate is the median. Median is 18.
(ii) Less than ogive is drawn by taking the upper limit of class interval along x-axis and their corresponding less than cumulative frequencies along y-axis.
(iii) Sum of 50 numbers = 50 x 18 = 900
If each number is increased by 4, then
new sum = 900 + 4 x 50 = 1100
∴ New Mean = 1100/50 = 22
(iv) Let seven consecutive numbers are x, x + 1, x + 2, ...., x + 6.
Mean = 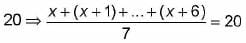
⇒ 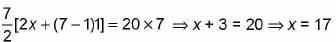
Smallest number x = 17 Largest number = x + 6 = 17 + 6 = 23.
Attention Class 10 Students!
To make sure you are not studying endlessly, EduRev has designed Class 10 study material, with Structured Courses, Videos, & Test Series. Plus get personalized analysis, doubt solving and improvement plans to achieve a great score in Class 10.


|
Explore Courses for Class 10 exam
|
|
Similar Class 10 Doubts


Top Courses for Class 10View all


Fill in the blanks.(i) For a given data with 110 observations the ‘less than ogive’ and ‘more than ogive’ intersect at (18, 20). The median of the data is __P__ .(ii) The curve is drawn by taking upper limit of class interval along x-axis and cumulating frequency along y-axis is __Q__ than ogive.(iii) T he m ean of 50 num ber s is 18, the new mean will be __R__ if each observation is increased by 4.(iv) The mean of seven consecutive natural numbers is 20, then the largest number is __S__ and smallest number of them is __T__ .P, Q, R, S, Ta)18, Less, 22, 23, 17b)20, More, 25, 22, 16c)18, More, 22, 24, 18d)20, Less, 25, 22, 16Correct answer is option 'A'. Can you explain this answer?
Question Description
Fill in the blanks.(i) For a given data with 110 observations the ‘less than ogive’ and ‘more than ogive’ intersect at (18, 20). The median of the data is __P__ .(ii) The curve is drawn by taking upper limit of class interval along x-axis and cumulating frequency along y-axis is __Q__ than ogive.(iii) T he m ean of 50 num ber s is 18, the new mean will be __R__ if each observation is increased by 4.(iv) The mean of seven consecutive natural numbers is 20, then the largest number is __S__ and smallest number of them is __T__ .P, Q, R, S, Ta)18, Less, 22, 23, 17b)20, More, 25, 22, 16c)18, More, 22, 24, 18d)20, Less, 25, 22, 16Correct answer is option 'A'. Can you explain this answer? for Class 10 2024 is part of Class 10 preparation. The Question and answers have been prepared according to the Class 10 exam syllabus. Information about Fill in the blanks.(i) For a given data with 110 observations the ‘less than ogive’ and ‘more than ogive’ intersect at (18, 20). The median of the data is __P__ .(ii) The curve is drawn by taking upper limit of class interval along x-axis and cumulating frequency along y-axis is __Q__ than ogive.(iii) T he m ean of 50 num ber s is 18, the new mean will be __R__ if each observation is increased by 4.(iv) The mean of seven consecutive natural numbers is 20, then the largest number is __S__ and smallest number of them is __T__ .P, Q, R, S, Ta)18, Less, 22, 23, 17b)20, More, 25, 22, 16c)18, More, 22, 24, 18d)20, Less, 25, 22, 16Correct answer is option 'A'. Can you explain this answer? covers all topics & solutions for Class 10 2024 Exam. Find important definitions, questions, meanings, examples, exercises and tests below for Fill in the blanks.(i) For a given data with 110 observations the ‘less than ogive’ and ‘more than ogive’ intersect at (18, 20). The median of the data is __P__ .(ii) The curve is drawn by taking upper limit of class interval along x-axis and cumulating frequency along y-axis is __Q__ than ogive.(iii) T he m ean of 50 num ber s is 18, the new mean will be __R__ if each observation is increased by 4.(iv) The mean of seven consecutive natural numbers is 20, then the largest number is __S__ and smallest number of them is __T__ .P, Q, R, S, Ta)18, Less, 22, 23, 17b)20, More, 25, 22, 16c)18, More, 22, 24, 18d)20, Less, 25, 22, 16Correct answer is option 'A'. Can you explain this answer?.
Fill in the blanks.(i) For a given data with 110 observations the ‘less than ogive’ and ‘more than ogive’ intersect at (18, 20). The median of the data is __P__ .(ii) The curve is drawn by taking upper limit of class interval along x-axis and cumulating frequency along y-axis is __Q__ than ogive.(iii) T he m ean of 50 num ber s is 18, the new mean will be __R__ if each observation is increased by 4.(iv) The mean of seven consecutive natural numbers is 20, then the largest number is __S__ and smallest number of them is __T__ .P, Q, R, S, Ta)18, Less, 22, 23, 17b)20, More, 25, 22, 16c)18, More, 22, 24, 18d)20, Less, 25, 22, 16Correct answer is option 'A'. Can you explain this answer? for Class 10 2024 is part of Class 10 preparation. The Question and answers have been prepared according to the Class 10 exam syllabus. Information about Fill in the blanks.(i) For a given data with 110 observations the ‘less than ogive’ and ‘more than ogive’ intersect at (18, 20). The median of the data is __P__ .(ii) The curve is drawn by taking upper limit of class interval along x-axis and cumulating frequency along y-axis is __Q__ than ogive.(iii) T he m ean of 50 num ber s is 18, the new mean will be __R__ if each observation is increased by 4.(iv) The mean of seven consecutive natural numbers is 20, then the largest number is __S__ and smallest number of them is __T__ .P, Q, R, S, Ta)18, Less, 22, 23, 17b)20, More, 25, 22, 16c)18, More, 22, 24, 18d)20, Less, 25, 22, 16Correct answer is option 'A'. Can you explain this answer? covers all topics & solutions for Class 10 2024 Exam. Find important definitions, questions, meanings, examples, exercises and tests below for Fill in the blanks.(i) For a given data with 110 observations the ‘less than ogive’ and ‘more than ogive’ intersect at (18, 20). The median of the data is __P__ .(ii) The curve is drawn by taking upper limit of class interval along x-axis and cumulating frequency along y-axis is __Q__ than ogive.(iii) T he m ean of 50 num ber s is 18, the new mean will be __R__ if each observation is increased by 4.(iv) The mean of seven consecutive natural numbers is 20, then the largest number is __S__ and smallest number of them is __T__ .P, Q, R, S, Ta)18, Less, 22, 23, 17b)20, More, 25, 22, 16c)18, More, 22, 24, 18d)20, Less, 25, 22, 16Correct answer is option 'A'. Can you explain this answer?.
Solutions for Fill in the blanks.(i) For a given data with 110 observations the ‘less than ogive’ and ‘more than ogive’ intersect at (18, 20). The median of the data is __P__ .(ii) The curve is drawn by taking upper limit of class interval along x-axis and cumulating frequency along y-axis is __Q__ than ogive.(iii) T he m ean of 50 num ber s is 18, the new mean will be __R__ if each observation is increased by 4.(iv) The mean of seven consecutive natural numbers is 20, then the largest number is __S__ and smallest number of them is __T__ .P, Q, R, S, Ta)18, Less, 22, 23, 17b)20, More, 25, 22, 16c)18, More, 22, 24, 18d)20, Less, 25, 22, 16Correct answer is option 'A'. Can you explain this answer? in English & in Hindi are available as part of our courses for Class 10.
Download more important topics, notes, lectures and mock test series for Class 10 Exam by signing up for free.
Here you can find the meaning of Fill in the blanks.(i) For a given data with 110 observations the ‘less than ogive’ and ‘more than ogive’ intersect at (18, 20). The median of the data is __P__ .(ii) The curve is drawn by taking upper limit of class interval along x-axis and cumulating frequency along y-axis is __Q__ than ogive.(iii) T he m ean of 50 num ber s is 18, the new mean will be __R__ if each observation is increased by 4.(iv) The mean of seven consecutive natural numbers is 20, then the largest number is __S__ and smallest number of them is __T__ .P, Q, R, S, Ta)18, Less, 22, 23, 17b)20, More, 25, 22, 16c)18, More, 22, 24, 18d)20, Less, 25, 22, 16Correct answer is option 'A'. Can you explain this answer? defined & explained in the simplest way possible. Besides giving the explanation of
Fill in the blanks.(i) For a given data with 110 observations the ‘less than ogive’ and ‘more than ogive’ intersect at (18, 20). The median of the data is __P__ .(ii) The curve is drawn by taking upper limit of class interval along x-axis and cumulating frequency along y-axis is __Q__ than ogive.(iii) T he m ean of 50 num ber s is 18, the new mean will be __R__ if each observation is increased by 4.(iv) The mean of seven consecutive natural numbers is 20, then the largest number is __S__ and smallest number of them is __T__ .P, Q, R, S, Ta)18, Less, 22, 23, 17b)20, More, 25, 22, 16c)18, More, 22, 24, 18d)20, Less, 25, 22, 16Correct answer is option 'A'. Can you explain this answer?, a detailed solution for Fill in the blanks.(i) For a given data with 110 observations the ‘less than ogive’ and ‘more than ogive’ intersect at (18, 20). The median of the data is __P__ .(ii) The curve is drawn by taking upper limit of class interval along x-axis and cumulating frequency along y-axis is __Q__ than ogive.(iii) T he m ean of 50 num ber s is 18, the new mean will be __R__ if each observation is increased by 4.(iv) The mean of seven consecutive natural numbers is 20, then the largest number is __S__ and smallest number of them is __T__ .P, Q, R, S, Ta)18, Less, 22, 23, 17b)20, More, 25, 22, 16c)18, More, 22, 24, 18d)20, Less, 25, 22, 16Correct answer is option 'A'. Can you explain this answer? has been provided alongside types of Fill in the blanks.(i) For a given data with 110 observations the ‘less than ogive’ and ‘more than ogive’ intersect at (18, 20). The median of the data is __P__ .(ii) The curve is drawn by taking upper limit of class interval along x-axis and cumulating frequency along y-axis is __Q__ than ogive.(iii) T he m ean of 50 num ber s is 18, the new mean will be __R__ if each observation is increased by 4.(iv) The mean of seven consecutive natural numbers is 20, then the largest number is __S__ and smallest number of them is __T__ .P, Q, R, S, Ta)18, Less, 22, 23, 17b)20, More, 25, 22, 16c)18, More, 22, 24, 18d)20, Less, 25, 22, 16Correct answer is option 'A'. Can you explain this answer? theory, EduRev gives you an
ample number of questions to practice Fill in the blanks.(i) For a given data with 110 observations the ‘less than ogive’ and ‘more than ogive’ intersect at (18, 20). The median of the data is __P__ .(ii) The curve is drawn by taking upper limit of class interval along x-axis and cumulating frequency along y-axis is __Q__ than ogive.(iii) T he m ean of 50 num ber s is 18, the new mean will be __R__ if each observation is increased by 4.(iv) The mean of seven consecutive natural numbers is 20, then the largest number is __S__ and smallest number of them is __T__ .P, Q, R, S, Ta)18, Less, 22, 23, 17b)20, More, 25, 22, 16c)18, More, 22, 24, 18d)20, Less, 25, 22, 16Correct answer is option 'A'. Can you explain this answer? tests, examples and also practice Class 10 tests.
|
|
Explore Courses for Class 10 exam
|
|
Suggested Free Tests
Signup for Free!
Signup to see your scores go up within 7 days! Learn & Practice with 1000+ FREE Notes, Videos & Tests.


|
© EduRev
|
Education Revolution
|


|


Signup to see your scores
go up within 7 days!
Access 1000+ FREE Docs, Videos and Tests
Takes less than 10 seconds to signup