


Class 10 Exam > Class 10 Questions > Following figure represents the phenomenon:a)...
Start Learning for Free
Following figure represents the phenomenon:
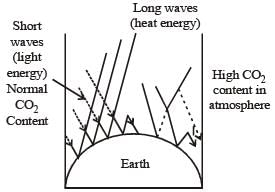
- a)Acid rain
- b)Greenhouse effect
- c)Ozone depletion
- d)None of these
Correct answer is option 'B'. Can you explain this answer?

Most Upvoted Answer
Following figure represents the phenomenon:a)Acid rainb)Greenhouse eff...
Heat absorbed by surface of earth during the daytime is emitted back into the atmosphere in the form of infrared radiations. Part of the infra-red radiations passes out of the atmosphere. The remaining infra-red radiations are absorbed by green house gases (GHGs) and re-emitted in all the directions including back to earth called greehouse effect.

|
Explore Courses for Class 10 exam
|
|
Top Courses for Class 10View all


Question Description
Following figure represents the phenomenon:a)Acid rainb)Greenhouse effectc)Ozone depletiond)None of theseCorrect answer is option 'B'. Can you explain this answer? for Class 10 2025 is part of Class 10 preparation. The Question and answers have been prepared according to the Class 10 exam syllabus. Information about Following figure represents the phenomenon:a)Acid rainb)Greenhouse effectc)Ozone depletiond)None of theseCorrect answer is option 'B'. Can you explain this answer? covers all topics & solutions for Class 10 2025 Exam. Find important definitions, questions, meanings, examples, exercises and tests below for Following figure represents the phenomenon:a)Acid rainb)Greenhouse effectc)Ozone depletiond)None of theseCorrect answer is option 'B'. Can you explain this answer?.
Following figure represents the phenomenon:a)Acid rainb)Greenhouse effectc)Ozone depletiond)None of theseCorrect answer is option 'B'. Can you explain this answer? for Class 10 2025 is part of Class 10 preparation. The Question and answers have been prepared according to the Class 10 exam syllabus. Information about Following figure represents the phenomenon:a)Acid rainb)Greenhouse effectc)Ozone depletiond)None of theseCorrect answer is option 'B'. Can you explain this answer? covers all topics & solutions for Class 10 2025 Exam. Find important definitions, questions, meanings, examples, exercises and tests below for Following figure represents the phenomenon:a)Acid rainb)Greenhouse effectc)Ozone depletiond)None of theseCorrect answer is option 'B'. Can you explain this answer?.
Solutions for Following figure represents the phenomenon:a)Acid rainb)Greenhouse effectc)Ozone depletiond)None of theseCorrect answer is option 'B'. Can you explain this answer? in English & in Hindi are available as part of our courses for Class 10.
Download more important topics, notes, lectures and mock test series for Class 10 Exam by signing up for free.
Here you can find the meaning of Following figure represents the phenomenon:a)Acid rainb)Greenhouse effectc)Ozone depletiond)None of theseCorrect answer is option 'B'. Can you explain this answer? defined & explained in the simplest way possible. Besides giving the explanation of
Following figure represents the phenomenon:a)Acid rainb)Greenhouse effectc)Ozone depletiond)None of theseCorrect answer is option 'B'. Can you explain this answer?, a detailed solution for Following figure represents the phenomenon:a)Acid rainb)Greenhouse effectc)Ozone depletiond)None of theseCorrect answer is option 'B'. Can you explain this answer? has been provided alongside types of Following figure represents the phenomenon:a)Acid rainb)Greenhouse effectc)Ozone depletiond)None of theseCorrect answer is option 'B'. Can you explain this answer? theory, EduRev gives you an
ample number of questions to practice Following figure represents the phenomenon:a)Acid rainb)Greenhouse effectc)Ozone depletiond)None of theseCorrect answer is option 'B'. Can you explain this answer? tests, examples and also practice Class 10 tests.
|
|
Explore Courses for Class 10 exam
|
|

Signup for Free!
Signup to see your scores go up within 7 days! Learn & Practice with 1000+ FREE Notes, Videos & Tests.


|
© EduRev
|
Education Revolution
|


|


Signup to see your scores
go up within 7 days!
Access 1000+ FREE Docs, Videos and Tests
Takes less than 10 seconds to signup