GMAT Exam > GMAT Questions > The graph shows a family’s monthly elec...
Start Learning for Free
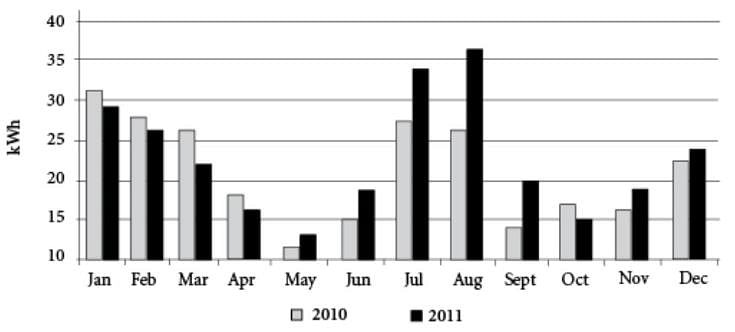
The graph shows a family’s monthly electricity consumption, in kWh, over the course of two years.


Q. Based on the given information, fill in the blanks in each of the following statements.
1. The family’s electricity consumption in January 2011 was approximately ____% of its consumption in December 2010.
2. If the family paid a constant rate of $x per kWh between June 2010 and November 2010, inclusive, then it paid _____as much between June 2010 and August 2010, inclusive, as it did between September 2010 and November 2010, inclusive.
- a)74, 0.45
- b)126, 1.45x
- c)79, 1.45
- d)135, 145
- e)140, 0.45x
Correct answer is option 'B'. Can you explain this answer?
| FREE This question is part of | Download PDF Attempt this Test |
Most Upvoted Answer
The graph shows a family’s monthly electricity consumption, in k...
Statement 1:
The family’s electricity consumption in January 2011 was approximately ___ % of its consumption in December 2010.
=> Electricity consumption in (Jan 2011 / Dec 2010) x 100 % Approximation - (29/22.5) x 100
= 126%
The family’s electricity consumption in January 2011 was approximately ___ % of its consumption in December 2010.
=> Electricity consumption in (Jan 2011 / Dec 2010) x 100 % Approximation - (29/22.5) x 100
= 126%
Statement 2: If the family paid a constant rate of $x per kWh between June 2010 and November 2010, inclusive, then it paid ____ as much between June 2010 and August 2010, inclusive, as it did between September 2010 and November 2010, inclusive.
=> Electricity consumption in the months of (June 2010 + July 2010 + Aug 2010) / (Sep 2010 + Oct 2010 + Nov 2010) Approximation - ( 70 / 47 )
= 1.45 times
=> Electricity consumption in the months of (June 2010 + July 2010 + Aug 2010) / (Sep 2010 + Oct 2010 + Nov 2010) Approximation - ( 70 / 47 )
= 1.45 times
Attention GMAT Students!
To make sure you are not studying endlessly, EduRev has designed GMAT study material, with Structured Courses, Videos, & Test Series. Plus get personalized analysis, doubt solving and improvement plans to achieve a great score in GMAT.

|
Explore Courses for GMAT exam
|

|
Similar GMAT Doubts
The graph shows a family’s monthly electricity consumption, in kWh, over the course of two years.Q. Based on the given information, fill in the blanks in each of the following statements.1. The family’s electricity consumption in January 2011 was approximately ____% of its consumption in December 2010.2. If the family paid a constant rate of $x per kWh between June 2010 and November 2010, inclusive, then it paid _____as much between June 2010 and August 2010, inclusive, as it did between September 2010 and November 2010, inclusive.a)74, 0.45b)126, 1.45xc)79, 1.45d)135, 145e)140, 0.45xCorrect answer is option 'B'. Can you explain this answer?
Question Description
The graph shows a family’s monthly electricity consumption, in kWh, over the course of two years.Q. Based on the given information, fill in the blanks in each of the following statements.1. The family’s electricity consumption in January 2011 was approximately ____% of its consumption in December 2010.2. If the family paid a constant rate of $x per kWh between June 2010 and November 2010, inclusive, then it paid _____as much between June 2010 and August 2010, inclusive, as it did between September 2010 and November 2010, inclusive.a)74, 0.45b)126, 1.45xc)79, 1.45d)135, 145e)140, 0.45xCorrect answer is option 'B'. Can you explain this answer? for GMAT 2024 is part of GMAT preparation. The Question and answers have been prepared according to the GMAT exam syllabus. Information about The graph shows a family’s monthly electricity consumption, in kWh, over the course of two years.Q. Based on the given information, fill in the blanks in each of the following statements.1. The family’s electricity consumption in January 2011 was approximately ____% of its consumption in December 2010.2. If the family paid a constant rate of $x per kWh between June 2010 and November 2010, inclusive, then it paid _____as much between June 2010 and August 2010, inclusive, as it did between September 2010 and November 2010, inclusive.a)74, 0.45b)126, 1.45xc)79, 1.45d)135, 145e)140, 0.45xCorrect answer is option 'B'. Can you explain this answer? covers all topics & solutions for GMAT 2024 Exam. Find important definitions, questions, meanings, examples, exercises and tests below for The graph shows a family’s monthly electricity consumption, in kWh, over the course of two years.Q. Based on the given information, fill in the blanks in each of the following statements.1. The family’s electricity consumption in January 2011 was approximately ____% of its consumption in December 2010.2. If the family paid a constant rate of $x per kWh between June 2010 and November 2010, inclusive, then it paid _____as much between June 2010 and August 2010, inclusive, as it did between September 2010 and November 2010, inclusive.a)74, 0.45b)126, 1.45xc)79, 1.45d)135, 145e)140, 0.45xCorrect answer is option 'B'. Can you explain this answer?.
The graph shows a family’s monthly electricity consumption, in kWh, over the course of two years.Q. Based on the given information, fill in the blanks in each of the following statements.1. The family’s electricity consumption in January 2011 was approximately ____% of its consumption in December 2010.2. If the family paid a constant rate of $x per kWh between June 2010 and November 2010, inclusive, then it paid _____as much between June 2010 and August 2010, inclusive, as it did between September 2010 and November 2010, inclusive.a)74, 0.45b)126, 1.45xc)79, 1.45d)135, 145e)140, 0.45xCorrect answer is option 'B'. Can you explain this answer? for GMAT 2024 is part of GMAT preparation. The Question and answers have been prepared according to the GMAT exam syllabus. Information about The graph shows a family’s monthly electricity consumption, in kWh, over the course of two years.Q. Based on the given information, fill in the blanks in each of the following statements.1. The family’s electricity consumption in January 2011 was approximately ____% of its consumption in December 2010.2. If the family paid a constant rate of $x per kWh between June 2010 and November 2010, inclusive, then it paid _____as much between June 2010 and August 2010, inclusive, as it did between September 2010 and November 2010, inclusive.a)74, 0.45b)126, 1.45xc)79, 1.45d)135, 145e)140, 0.45xCorrect answer is option 'B'. Can you explain this answer? covers all topics & solutions for GMAT 2024 Exam. Find important definitions, questions, meanings, examples, exercises and tests below for The graph shows a family’s monthly electricity consumption, in kWh, over the course of two years.Q. Based on the given information, fill in the blanks in each of the following statements.1. The family’s electricity consumption in January 2011 was approximately ____% of its consumption in December 2010.2. If the family paid a constant rate of $x per kWh between June 2010 and November 2010, inclusive, then it paid _____as much between June 2010 and August 2010, inclusive, as it did between September 2010 and November 2010, inclusive.a)74, 0.45b)126, 1.45xc)79, 1.45d)135, 145e)140, 0.45xCorrect answer is option 'B'. Can you explain this answer?.
Solutions for The graph shows a family’s monthly electricity consumption, in kWh, over the course of two years.Q. Based on the given information, fill in the blanks in each of the following statements.1. The family’s electricity consumption in January 2011 was approximately ____% of its consumption in December 2010.2. If the family paid a constant rate of $x per kWh between June 2010 and November 2010, inclusive, then it paid _____as much between June 2010 and August 2010, inclusive, as it did between September 2010 and November 2010, inclusive.a)74, 0.45b)126, 1.45xc)79, 1.45d)135, 145e)140, 0.45xCorrect answer is option 'B'. Can you explain this answer? in English & in Hindi are available as part of our courses for GMAT.
Download more important topics, notes, lectures and mock test series for GMAT Exam by signing up for free.
Here you can find the meaning of The graph shows a family’s monthly electricity consumption, in kWh, over the course of two years.Q. Based on the given information, fill in the blanks in each of the following statements.1. The family’s electricity consumption in January 2011 was approximately ____% of its consumption in December 2010.2. If the family paid a constant rate of $x per kWh between June 2010 and November 2010, inclusive, then it paid _____as much between June 2010 and August 2010, inclusive, as it did between September 2010 and November 2010, inclusive.a)74, 0.45b)126, 1.45xc)79, 1.45d)135, 145e)140, 0.45xCorrect answer is option 'B'. Can you explain this answer? defined & explained in the simplest way possible. Besides giving the explanation of
The graph shows a family’s monthly electricity consumption, in kWh, over the course of two years.Q. Based on the given information, fill in the blanks in each of the following statements.1. The family’s electricity consumption in January 2011 was approximately ____% of its consumption in December 2010.2. If the family paid a constant rate of $x per kWh between June 2010 and November 2010, inclusive, then it paid _____as much between June 2010 and August 2010, inclusive, as it did between September 2010 and November 2010, inclusive.a)74, 0.45b)126, 1.45xc)79, 1.45d)135, 145e)140, 0.45xCorrect answer is option 'B'. Can you explain this answer?, a detailed solution for The graph shows a family’s monthly electricity consumption, in kWh, over the course of two years.Q. Based on the given information, fill in the blanks in each of the following statements.1. The family’s electricity consumption in January 2011 was approximately ____% of its consumption in December 2010.2. If the family paid a constant rate of $x per kWh between June 2010 and November 2010, inclusive, then it paid _____as much between June 2010 and August 2010, inclusive, as it did between September 2010 and November 2010, inclusive.a)74, 0.45b)126, 1.45xc)79, 1.45d)135, 145e)140, 0.45xCorrect answer is option 'B'. Can you explain this answer? has been provided alongside types of The graph shows a family’s monthly electricity consumption, in kWh, over the course of two years.Q. Based on the given information, fill in the blanks in each of the following statements.1. The family’s electricity consumption in January 2011 was approximately ____% of its consumption in December 2010.2. If the family paid a constant rate of $x per kWh between June 2010 and November 2010, inclusive, then it paid _____as much between June 2010 and August 2010, inclusive, as it did between September 2010 and November 2010, inclusive.a)74, 0.45b)126, 1.45xc)79, 1.45d)135, 145e)140, 0.45xCorrect answer is option 'B'. Can you explain this answer? theory, EduRev gives you an
ample number of questions to practice The graph shows a family’s monthly electricity consumption, in kWh, over the course of two years.Q. Based on the given information, fill in the blanks in each of the following statements.1. The family’s electricity consumption in January 2011 was approximately ____% of its consumption in December 2010.2. If the family paid a constant rate of $x per kWh between June 2010 and November 2010, inclusive, then it paid _____as much between June 2010 and August 2010, inclusive, as it did between September 2010 and November 2010, inclusive.a)74, 0.45b)126, 1.45xc)79, 1.45d)135, 145e)140, 0.45xCorrect answer is option 'B'. Can you explain this answer? tests, examples and also practice GMAT tests.

|
Explore Courses for GMAT exam
|

|
Suggested Free Tests
Signup for Free!
Signup to see your scores go up within 7 days! Learn & Practice with 1000+ FREE Notes, Videos & Tests.


